1. Laboratório de Biomecânica da EEFD/UFRJ.
2. Laboratório de Fisiologia do Exercício da EEFD/UFRJ.
Received in 25/4/05. 2nd version received in 29/5/05. Approved in 3/8/05. Correspondence to: M arco Antonio Cavalcanti Garcia, Rua maranhão, 305, casa 5, M éier – 20720-230 – Rio de Janeiro, RJ. E-mail: [email protected]; [email protected]
Interpretation of the mechanisms related to the
muscular strength gradation through accelerometry
Thiago Torres da M atta1, Talita Adão Perini2, Glauber Lameira de Oliveira2, Juliana dos Santos Ornellas2,
Angelina Adriana Louzada1, José M agalhães1, Luís Aureliano Imbiriba1 and M arco Antonio Cavalcanti Garcia1
O
RIGINALA
RTICLEKey w ords: M echanomyography. M M G. Vibromyography. VM G. M uscular
contrac-tion. ENGLISH VERSION
ABSTRACT
The aim of this study w as to characterize the temporal and spec-tral components of the muscle contractions in different contrac-tion levels through the accelerometry. Fifteen male and tw elve female right-handed individuals participated in this study. The trial w as constituted by a maximal w orkload (M W) test that allow ed to determine five different w orkloads (20% , 40% , 60% , 80% and 100% of M W) w hich, by its turn, allow ed to determine five per-centage w orkloads during the strength test (20% , 40% , 60% , 80% , and 100% of the M W) in isometry during eight seconds each of them. A biaxial accelerometer w as put on the muscular abdomen of the right brachii biceps muscle. The mean square root (RM S value), a temporal parameter, and the mean frequency (M FE), a spectral parameter w ere extracted from the accelerometry signals (M M G signals). Such parameters w ere analyzed tow ards the X (per-pendicular to the fibers) and Y (parallel to the fibers) directions. Both groups presented a descent behavior pattern of the loaded M FE (Y), and the most accentuated w as the female group. The M FE variable (X) in the female group presented similar behavior before the M FE (Y), and it w as observed a statistically significant difference only betw een 20% of the M W and every other w ork-load (p = 0.0022 for 40% and p < 0.0001 for the remaining). The male group did not present any statistically significant difference betw een w orkloads. The RM S value (Y) presented an ascent be-havior w ith the w orkload in both genders, presenting differences betw een the 20% and 40% w orkloads of the M W (p = 0.000), and 80% and 100% of the M W (p = 0.01) in the male group. But it w as observed no statistically significant difference betw een w orkloads in the female group. It is argued that during the muscular contrac-tion, there is non-uniform variations on the fiber’s diameter, be-sides the low frequency lateral oscillations. Such information seems to have strong correlation betw een the type of the fibers, and this could contribute for a better clarification on the possible mecha-nisms involved in the gradation process of the muscular strength.
INTRODUCTION
M echanisms involving muscular contractions still constitute an important subject for studies in the Physiology and Biomechanical areas. Different authors have been dedicated themselves to un-derstand how the strength gradation occurs under different
condi-tions, mainly in situations such as the muscular stress(1), aging(2)
and under the influence of training programs(3). In such context,
tw o processes are normally considered: the recruitment of motor units (M U), and the frequency variation of the potentials of action of the motor units recruited (PAUM s).
Aiming to understand how these processes are modulated dur-ing the muscular contraction, some authors have been usdur-ing the electromyography (EM G) as a tool to interpret the studied muscle through the myoelectrical activity (EM G signal) generated by it. So, upon submitting an individual to different contraction levels and types, it is possible to extract different parameters in the time and frequency domains through the EM G signal, in order to
inter-pret the gradation mechanisms of the muscular strength(4).
On the other hand, there are w orks suggesting that the know l-edge on the mechanical features involved in the contractile pro-cess must be also considered, as to allow a better understanding on the strength gradation processes in the myoelectrical point of view(5).
In such a sense, another technique to analyze the muscular con-traction that becomes more popular every day is the mechano-myography (M M G), w hich is basically characterized by the use of microphones placed on the surface of the muscle to catch those noises that reflect the muscular contraction caused by the PAUM s
into the muscular fibers(6,7). Such contractions that may be
concen-trated mainly in a frequency band defined betw een 5 and 50 Hz, w ould represent small vibrations and/or pressure w aves produced by dimensional changing of the active fibers mainly on their
trans-versal axles(8). According to Neering et al.(8), such process occur
due to the redistribution of aqueous material presents in the sarco-plasm, and they still point out that despite these variations are present in a non-uniform w ay, they could contribute even to iden-tify some structural features of the muscular fibers. So, w ith the increase in the triggering rate of the PAUM s that is one of the strategies to increase the muscular strength, there w ill be a reduc-tion in the intervals betw een contracreduc-tions, w hich w ill be summed
up, and they w ill lead to a state know n as the tetany(9) w henever it
occurs a maximal contraction.
Besides of using microphones to study muscular contractions, another type of sensor is suggested as an alternative form to study: it is the accelerometer. It is supposed that since the muscular con-tractions produce vibrations, and such vibrations occur both to-w ards parallel and perpendicular directions in relation to the mus-cular fibers, such sensors w ould be able to detect these move-ments(10).
Therefore, this technique has been also identified as vibromyo-graphy (VM G) and/or Acceleromyovibromyo-graphy (AM G). How ever, there are little studies discussing the actual meaning of the vibrations generated in both directions and in function of the m uscular strength.
Among those w orks present in the literature, the majority devel-ops discussions from the vibrations laterally generated by the muscular fibers, implying that only this direction has a
physiologi-cal meaning. Despite Ouamer et al.(11) indicate that the mechanical
information on the real mechanisms involved in such phenome-non, mainly related to those longitudinally generated vibrations related to the fibers. Those authors, using microphones distribut-ed on the muscular abdomen of the brachii biceps suggest that the recruitment pattern of the M U, and the frequency of the PAUM s could be a better foundation w hen it is considered both the direc-tions of the muscular vibration (perpendicular and longitudinal to the fibers), and even contradicting a great number of authors as to
the actual meaning of the lateral oscillations(11).
Thus, as it w as found no w orks in the literature discussing the muscular contraction in both directions (perpendicularly and longi-tudinally to the fibers) through the use of the accelerometry, this study had as purpose to fulfill such lack of know ledge on the pro-posed technique, thus characterizing the temporal and spectral components of the M M G signals in both directions, related to the muscular strength generated by the brachii biceps muscle, but also upon different contraction levels, and thus, comparing it in both genders.
M ATERIALS AND M ETHODS
The sampling w as composed by tw o groups of both genders, being 15 male (w ith ages 24.0 ± 5.25 years), and 12 female (ages 21.7 ± 1.5 years), right-handed students of a graduation course in Physical Education at EEFD/UFRJ, regular practitioner of regular physical activities, and w ith no history of lesions in the muscle-skeletal system in the upper limbs. Every volunteer received orien-tation on the procedures adopted, and signed a consent term to participate in the study, w hich w as duly submitted to the HUCFF/ UFRJ’s Ethics Committee, and received the number 125/03.
The acquisition system w as composed by a Personal Computer (Pentium – 200 M Hz), a 12 bits analogical-digital converter (Daq-Pad 1200 – National Instruments, USA), w ith dynamic band of ± 5 V. To capture the M M G signals, it w as used a biaxial accelerometry system (ADXL202E model, Analog Devices, USA), w ith transmis-sion band of 200 Hz and sensitivity of 315 mV/g (g = gravity accel-eration), w ith total mass of 1.5 g (figure 1). Such system w as de-veloped at the Biomechanical Lab of the EEFD/UFRJ, and it allow ed to measure accelerations up to 2 g. The sampling frequency w as of 2 kHz. The acquisition programs and signal processing, as w ell as the one developed to perform the tests w ere elaborated on a LabVIEW 5.0 (National Instruments, USA).
Fig. 1 – Accelerometer and axles defined as to the di-rections of the measured accelerations (X – lateral vi-brat ions of t he m uscular fibers; Y – longitudinal vibra-t ions of vibra-t he m uscular f i-bers). A ruler is placed aside the accelerometer to allow a better visualization of its dimensions.
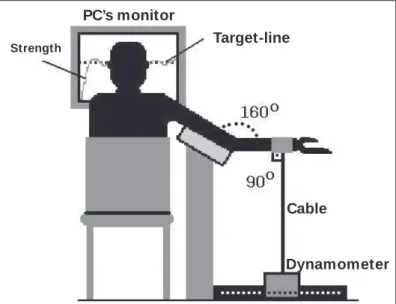
To perform the tests, it w as developed a mechanical device to support the right upper limb, and it w as used a dynamometry sys-tem w ith capacity to perform individual adjustment of the height and distance related to the right shoulder articulation, w hen
keep-ing it in 70o abduction (figure 2). A dynamometer (Kratos
Dina-mometros Ltda.) fixed to the ground w as used to the acquisition of the strength signals.
Fig. 2 – Scheme of the mechanical device and positioning of the volunteer related to the strength acquisition system and the PC’s monitor
PC’s monitor
Target-line
StrengthCable
Dynamometer
While the tests w ere accomplished, each volunteer remained seat having his (her) knees and hip articulations flexed atapproxi-mately 90o and having the right upper limb abducted, according to
w hat is show n in the figure 2.
The trial protocol w as composed by a maximal w orkload test (M W) for 6 s. From such data, it w as calculated the percentage w orkloads ministered in the strength tests: 20% , 40% , 60% , 80% , and 100% of the M W. All tests w ere performed in a sole day, and each isometric contraction w as kept for eight seconds, w ith a tw o minutes minimum interval betw een each test. In order to reach the target-w orkload, each volunteer received visual feedback sup-ported by a Personal Computer’s monitor (figure 2) for each of the random w orkload w hich w as chosen in random order through a ballot before each acquisition.
Besides, the researcher stimulated verbally every volunteer. Since there is no clear protocol in the literature to place the ac-celerometer, it w as placed on the ventral portion of the right brachii biceps muscle using a double-face tape, follow ing the protocol
suggested by Hermens et al.(12) to place surface electrodes w hen
acquiring EM G signals. This protocol is based on the distance measured from the acromion and the cubital fossa close to the articular line of the elbow.
When such measurement w as taken having the individual seat to acquire the M M G signals at 1/3 of the cubital fossa, the acceler-ometer w as put in place (figure 3).
The acquisition of the strength and the M M G signals w ere de-fined from the reach of the target-w orkload for 8 seconds. Never-theless, in order to analyze the data, it w as studied only the 6 inter-mediary seconds of each signal acquired, and thus excluding the first and the last ones. Such procedure w as adopted in order to attain the minimal steady M M G signals from the behavior of the strength signal (figure 4).
rection) did not present any statistical difference related to the
gender factor (F(1.25) = 4.08; p = 0.054). How ever, there w as
differ-ences betw een “ w orkloads” (F(4.100) = 47.03; p = 0.0000).
Further-more, there w as no interaction betw een both factors (F(4.100) = 0.62;
p = 0.64). The RM S value on X presented higher mean results w ith progressive increase of the w orkload compared to those calculat-ed on Y. How ever, such difference w as not statistically testcalculat-ed. Another difference observed in the comparison betw een the RM S values attained in both directions, w hich w as not statistically test-ed as w ell, w as the higher variability of data betw een individuals of the X sampling. The Tukey’s post-hoc analysis has show n statisti-cally significant difference only betw een 20 and 40% of the M W (p = 0.003) to the male group (figure 5).
Fig. 4 – Example of the procedure adopted to record the M M G signals from the strength signals that acted as reference to calculate the different analysis parameters in the time and frequency domains
Interval c onsidered to c alc ulate the RNS and M FE parameters (means of this 6 sec ond portion)
S
tr
e
n
g
th
(
kg
f) Target
Strength signal Workload
Beginning of the rec ording Time (s) End of the rec ording
From the M M G signals, it w as calculated the follow ing parame-ters tow ards the X (perpendicular to the muscular fibers) and Y (parallel to the muscular fibers) signals: mean frequency (M FE), a parameter to discriminate the behavior of the components of the signal’s frequency’ from the potency spectrum and the mean square root (RM S value), a temporal parameter that reflects the variation of the amplitude. On the other hand, each of these parameters w as extracted from the 1 second-w indow from the intermediary portions selected. Next, it w as calculated the arithmetical average of the parameters for 6 seconds of the collected signals, as it w as suggested in the figure 4.
The M FE w as obtained through the signal potency’s spectrum
(Sm(f)) calculated through the Fourrier’s Fast Transformed (FFT).
Such method allow s to determine every component of the fre-quency that composes the signal that can be mathematically ex-pressed as follow s:
( )
( )
∫
∫
= f
m f
m
FME
df f S
df f fS MMG
0 0
(1)
w here,
Sm(f) is the spectral density function of the M M G signal related to
1 second.
By its turn, the RM S value determining the variation of the am-plitude w as attained through the follow ing equation:
( )
∫
= T
RMS x t dt
T MMG
0 2
1
(2)
w here,
X(t) is the portion of the signal on the T endurance segment, also equals to 1 second.
In order to compare the parameters betw een the five studied
w orkloads, it w as used the ANOVA tw o-w ay (α = 0.05), and the
Tukey’s post-hoc HSD analysis. The data analysis w as performed
on the Statistica softw are® 6.0 (StarSoft, USA).
RESULTS
The amplitude of the signal betw een groups that w as analyzed through the RM S value on X (perpendicular axle to the fibers’
di-X_RMS20
X_RMS40
X_RMS60
X_RMS80
X_RMS100
SEXO
m/
s
2
0.000 0.004 0.008 0.012 0.016 0.020 0.024
Masculino Feminino
p=0,003
Fig. 5 – M ean behavior (± standard deviation) of the accelerations attained (RM S value) in the X direction (perpendicular to the muscular fibers) for every w orkload and both genders
GENDER
M ale Fem ale
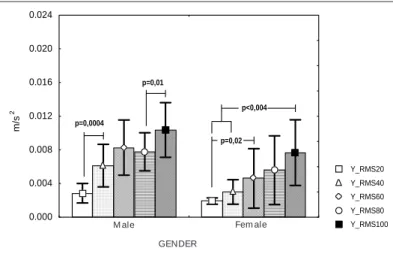
As to the RM S value’s behavior on Y (parallel axle tow ards the direction of the fibers), it presented statistically significant
differ-ences to the follow ing factors: “ gender” (F(1.25) = 8.39; p = 0.0077),
and “ w orkloads” (F(4.100) = 45.89; p = 0.0000). Even so, there w as
no interaction betw een both factors (F(4.100) = 2.00; p = 0.09). The
Tukey’s post-hoc analysis has identified that the RM S value (Y) pre-sented an ascent behavior, and presenting the highest differences betw een the 20% and 40% M W (p = 0.0004), and 80% and 100% of the M W (p = 0.01) for the male group. The female group pre-sented similar behavior to that observed in the male group, but it w as detected no statistically significant difference betw een w ork-loads (p > 0.05). Upon the comparison of both groups, the male group presented mean results higher to those found in the female group only betw een w orkloads of 40% (p = 0.001), 60% (p = 0.002), and 100% (p = 0.01) of the M W (figure 6).
Y_RMS20 Y_RMS40 Y_RMS60 Y_RMS80 Y_RMS100 SEXO
m/s
2
0.000 0.004 0.008 0.012 0.016 0.020 0.024
Masculino Feminino
p=0,0004
p=0,01
p=0,02 p<0,004
Fig. 6 – M ean behavior (± standard deviation) of the accelerations attained (RM S value) in the Y direction (longitudinal to the muscular fibers) for every w orkload and both genders
M ale Fem ale
GENDER
df
df
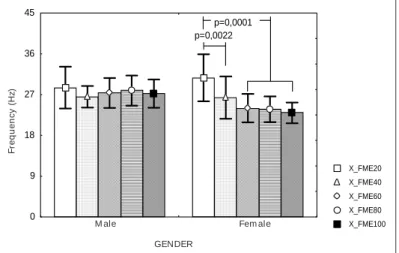
The FM E on X (perpendicular axle to the direction of the fibers) betw een both genders did not present statistically significant
dif-ference ((F(1,25) = 2.72; p = 0.1115) but it w as found differences
betw een “ w orkloads” (F(4.100) = 19.14; p = 0.00000) and
interac-tion betw een factors (F(4.100) = 12.02; p = 0.00000). The variable
M FE (X) in the female group presented similar behavior to the M FE (Y), and it w as observed a statistical significant difference only betw een the 20% M W and every other w orkloads (p = 0.0022 to 40% , and p < 0.0001 to the others). As to the male group, it w as observed no statistically significant difference betw een w orkloads (figure 7).
DISCUSSION
According to Neering et al.(8), a portion of the aqueous material
present into the sarcoplasm is redistributed to other parts of the muscular fiber during the muscular contraction, and this w ould lead to a change in the volume of the different portions along its struc-ture, thus generating laterally distributed pressure w aves. These authors point out that the variations are presented in a non-uni-form w ay, but they could contribute even to the identification of some structural features of the muscular fibers, as it w as already pointed out. As major part of the studies on the M M G is based on the use of especially adapted microphones to capture the signal generated by the changing in the volume of fibers, the behavior on the frequency domain is defined as an increase in the M FE to the
increase of the muscular contraction level(13). Through the
acceler-ometry, the method used in this w ork, it w as possible to observe a descent behavior in both directions (X and Y) of the M FE, w ith an increase in the percentage level of the M W, mainly in the female group. These results corroborate the theory of the mechanical fu-sion process of the motor units, w hich is consequence of the as-cent in the PAUM ’s triggering rate w henever there is an increase
in the contraction level(14). The justification for these possible
dif-ferences is in the fact that the skin and the layer of the adipose tissue can act as a low -pass filter that attenuates those compo-nents w ith higher signal frequency w hen captured through an
ac-celerometer(15). Besides, it is discussed that the components of
the frequency of the M M G signal is strongly dependent on the
type of the muscular fiber(7). So, in order to determine the reason
for such M FE’s behavior mainly on Y, it w ould be necessary to obtain further information as to the type of the fiber of the individ-uals analyzed. Even though, it is believed that in low contraction levels, the activity of a reduced number of motor units w ould let to a “ shaking” picture of the muscle, and such signal of small ampli-tude is observed through the RM S value, but rather w ith high fre-quency components.
When the contraction level is raised w ith more recruited M Us and upon the contraction of the phase, it is possible to cause an increase in the amplitude and a reduction of the frequency
compo-nents both on X(14).
The RM S value (X) presented an ascent behavior in the w
ork-load. Yoshitake et al.(6) discuss that an increase in the RM S value in
this direction is defined by an increase in the sum of the potentials in the action of the motor units. Upon the comparison of the re-sults found, it is supposed that the male group w ith mean values higher than those presented by the female group presents a high-er Type II-fibhigh-er rate. On the contrary of the female individuals w ho w ould present a low er proportion of such fiber, the M M G signal on X w ould result in presenting such initially expected behavior. As to the amplitude of the M M G signal on Y, it w as found no w ork in the literature presenting an ascent behavior related to the level of the contraction, except through the use of microphones. So, it w as not possible to set a relationship betw een the mechanisms
dis-cussed by Neering et al.(8) and the RM S value on Y. Even though, it
is supposed that the elastic components in series of the muscle commonly represented by tendons in mechanical models have some kind of interference on such behavior.
CONCLUSION
As to the technique presented, it is undoubted that there is sev-eral gaps that must be fulfilled, not only related to the methodolog-ical limitations, but also as to the interpretation of the muscular strength gradation mechanisms. Due to the little know ledge on the M M G signal features, its acquisition w as determined through isometric contractions, i.e., w ith no significant variances of the muscular length, w hose variable is determinant to the promotion of muscular strength, and this variable is determinant to the pro-duction of “ noise” into the signal.
X_FME20 X_FME40 X_FME60 X_FME80 X_FME100 SEXO
Freqüência (Hz)
0 9 18 27 36 45
Masculino Feminino p=0,0022
p=0,0001
Fig. 7 – M ean behavior (± standard deviation) of the frequencies attained (M FE value) in the X direction (perpendicular to the muscular fibers) for every w orkload and both genders
F
req
u
en
cy
(Hz
)
M ale Fem ale
GENDER
The M FE on Y (parallel axle tow ards the direction of the fibers) presented similar behavior to that presented by M FE on X, that is,
absence of statistical difference betw een the “ gender” factor (F(1.25)
= 0.35; p = 0.85), and differences betw een “ w orkloads” (F(4.100) =
61.25; p = 0.0000), besides of interaction betw een both factors (F(4.100) = 8.87; p = 0.00000). The male group presented a higher M FE (Y) at 20% of the M W to those presented in other levels. Betw een other contraction levels (40% , 60% , 80% , and 100% of the M W) it w as observed no statistically significant difference (p > 0.05). On the other hand, the female group presented a more ac-centuated fall bias of the M FE (Y) upon the ascent w orkload (figure 8).
Y_FME20 Y_FME40 Y_FME60 Y_FME80 Y_FME100 SEXO
Freqüência (Hz)
0 9 18 27 36 45
Masculino Feminino
p=0,026 p=0,0001
p=0,0001
Fig. 8 – M ean behavior (± standard deviation) of the frequencies attained (FM E value) in the Y direction (longitudinal to the muscular fibers) for every w orkload and both genders
F
req
u
en
cy
(Hz
)
M ale
GENDER
Besides, as it is being discussed the use of a biaxial accelerom-eter, not to use a dynamic w ay of contraction w as chosen for the movement devices w ould not be introduced into the signal, as this w ork had as purpose to characterize some of its basic properties. Thus, upon the application of a sole biaxial accelerometer on the muscular abdomen and setting the acquisitions in non-dynamic conditions, it can be attained more safety in the results found in this study.
Despite the little know ledge on this technique, the application of the accelerometry has proved to be easy to be used and at a low cost. How ever, despite the potential contribution involved in the muscular strength gradation process in different conditions, including in an associated w ay to the EM G, and as it is not yet a
commercially available technique, this makes difficult to reproduce its results to attain a better evaluation on the consistency of each of the time and frequency parameters extracted from the M M G signal.
ACKNOWLEDGM ENTS
To UFRJ’s the Assistance to the Student Division (DAE) by the conces-sion of the Supporting Scholarship to the student Angelina Adriana Louza-da.
All the authors declared there is not any potential conflict of inter-ests regarding this article.
REFERENCES
1. Lin M , Liang H, Lin K, Hw ang Y. Electromyographical assessment on muscular fatigue – An elaboration upon repetitive typing activity. J Electromyogr Kinesiol 2004;14:661-9.
2. Hinman RS, Cow an SM , Crossley KM , Bennell KL. Age-related changes in elec-tromyographic quadriceps activity during stair descent. J Orthop Res 2005;23: 322-6.
3. Clarys JP, Alew aeters K, Zinzen E. The influence of geographic variations on the muscular activity in selected sports movements. J Electromyogr Kinesiol 2001; 11:451-7.
4. Karlsson S, Gerdle B. M ean frequency and signal amplitude of the surface EM G of the quadriceps muscles increase w ith increasing torque – a study using the continuous w avelet transform. J Electromyogr Kinesiol 2001;11:131-40. 5. Hof AL. M uscle mechanics and neuromuscular control. J Biomech 2003;36:1031-8. 6. Yoshitake Y, Shinohara M , Eu H, M oritani T. Characteristics of surface mechano-myogram are dependent on development of fusion motor units in humans. J Appl Physiol 2002;93:1744-52.
7. Yoshitake Y, M oritani T. The muscle sound properties of different muscle fiber types during voluntary and electrically induced contractions. J Electromyogr Ki-nesiol 1999;9:209-17.
8. Neering IR, Quesenberry LA, M orris VA, Taylor SR. Nonuniform volume changes during muscle contraction. Biophy J 1991;59:926-32.
9. Enoka RM . Bases Neuromecânicas da Cinesiologia. 4a ed. São Paulo: M anole, 2000.
10. M atheson GO, M affey-Ward L, M ooney M , Ladly K, Fung T, Zhang YT. Vibro-myography as a quantitative measure of muscle force production. Scandinavian Journal Rehabil M ed 1997;29:29-35.
11. Ouamer M , Boiteaux M , Petitjean M , Travens L, Salès A. Acoustic myography during voluntary isometric contraction reveals non-propagative lateral vibration. J Biomech 1999;36:1031-8.
12. Hermens HJ, Freriks B, M erletti R, Stegeman D, Blok J, Rau G, et al. European Recommendations for Surface Electromyography – SENIAM Project, n. 8, 1999. 13. Oster G, Jaffe JS. Low frequency sounds from sustained contraction of human
skeletal muscle. Biophys J 1980;30:119-28.
14. Akataki K, M ita K, Watakabe M , Itoh K. M echanomyogram and force relation-ship during isometric ramp contractions of the biceps brachii muscle. Eur J Appl Physiol 2001;84:19-25.