Metabolic Analysis of Medicinal
Dendrobium
officinale
and
Dendrobium huoshanense
during Different Growth Years
Qing Jin, Chunyan Jiao, Shiwei Sun, Cheng Song, Yongping Cai*, Yi Lin*, Honghong Fan, Yanfang Zhu
Department of Life Sciences, Anhui Agricultural University, Hefei, 230036, China
*[email protected](YC);[email protected](YL)
Abstract
Metabolomics technology has enabled an important method for the identification and quality control of Traditional Chinese Medical materials. In this study, we isolated metabolites from cultivatedDendrobium officinaleandDendrobium huoshanensestems of different growth years in the methanol/water phase and identified them using gas chromatography coupled with mass spectrometry (GC-MS). First, a metabolomics technology platform for Dendro-biumwas constructed. The metabolites in theDendrobiummethanol/water phase were mainly sugars and glycosides, amino acids, organic acids, alcohols.D.officinaleandD. huoshanenseand their growth years were distinguished by cluster analysis in combination with multivariate statistical analysis, including principal component analysis (PCA) and orthogonal partial least squares discriminant analysis (OPLS-DA). Eleven metabolites that contributed significantly to this differentiation were subjected to t-tests (P<0.05) to identify biomarkers that discriminate betweenD.officinaleandD.huoshanense, including sucrose, glucose, galactose, succinate, fructose, hexadecanoate, oleanitrile, myo-inositol, and glyc-erol. Metabolic profiling of the chemical compositions ofDendrobiumspecies revealed that the polysaccharide content ofD.huoshanensewas higher than that ofD.officinale, indicat-ing that theD.huoshanensewas of higher quality. Based on the accumulation of Dendro-biummetabolites, the optimal harvest time forDendrobiumwas in the third year. This initial metabolic profiling platform forDendrobiumprovides an important foundation for the further study of secondary metabolites (pharmaceutical active ingredients) and metabolic
pathways.
Introduction
Dendrobiumis a perennial herb in the familyOrchidacea(DendrobiumSw.) and is widely dis-tributed in Australasia, Oceania and other tropical and subtropical areas [1,2]. In China, there are 74Dendrobiumspecies and two varieties [3], and nearly 50 of these species are used in medicine [4]. However, wildDendrobiumresources are threatened by extinction due to slow growth rates, habitat destruction and overexploitation. Thus, artificial, large-scale cultivation of medicalDendrobiumhas been developed. As valuable Chinese medicinal materials,
OPEN ACCESS
Citation:Jin Q, Jiao C, Sun S, Song C, Cai Y, Lin Y, et al. (2016) Metabolic Analysis of Medicinal
Dendrobium officinaleandDendrobium huoshanense
during Different Growth Years. PLoS ONE 11(1): e0146607. doi:10.1371/journal.pone.0146607
Editor:Mohana Krishna Reddy Mudiam, CSIR-Indian Institute of Toxicology Research, INDIA
Received:September 6, 2015
Accepted:December 18, 2015
Published:January 11, 2016
Copyright:© 2016 Jin et al. This is an open access article distributed under the terms of theCreative Commons Attribution License, which permits unrestricted use, distribution, and reproduction in any medium, provided the original author and source are credited.
Data Availability Statement:All relevant data are within the paper and its Supporting Information files.
Funding:The study was supported by Discipline Backbone Cultivated Foundation in Anhui Agricultural University (Grant No.2014XKPY-41,www.ahau.edu. cn), Twelfth Five-Year Plan for Science & Technology Support of Anhui Province (Grant No.1301032139,
Dendrobiumspecies play important pharmacological roles with abundant polysaccharides, alkaloids, phenanthrenes, bibenzyls, and other biologically active substances [5,6]. However, the chemical constituents and contents differ significantly among different medicinal Dendro-biumspecies. Some non-genuineDendrobiumis adulterated and many fake species referred to as“Dendrobium”are circulating in the market. This misrepresentation is not conducive to the safety and quality of medicinalDendrobium, its clinical applications, or the healthy develop-ment of the industry. Therefore, an effective comprehensive method ofDendrobium germ-plasm identification and quality control is urgently needed.
Dendrobium officinaleKimura et Migo andDendrobium huoshanenseC. Z. Tang et S. J. Cheng are both commercially valuable, particularlyD.huoshanense[7]. A comprehensive anal-ysis of the chemical compositions of cultivatedD.officinaleandD.huoshanenseand the differ-ences in their metabolic components have not been reported. Metabolomics is the study of all low molecular weight metabolites within an organism or cell during a specific period of time by both qualitative and quantitative methods. Metabolomics has been widely used in the study of medicinal plants, including the identification of medicinal herbs [8], discrimination of origin [9], determination of harvest time [10], method of processing [11] and other factors. Metabolo-mic studies ofDendrobiummetabolites have been limited.
In this study, a metabolic profile ofDendrobiumwas constructed using gas chromatogra-phy-mass spectrometry (GC-MS) combined with multivariate statistical analysis. The changes in the composition and content of metabolites, including sugars, alcohols, organic acids, amino acids and other metabolites, were studied in perennially cultivatedD.officinaleandD.
huoshanenseto identify biomarkers as a reference for the identification and quality control of Dendrobium.
Materials and Methods
Plant materials and reagents
The experiment was conducted using one-, two- and three-year-old basin-culturedD.officinale andD.huoshanenseseedlings (Fig 1) grown in a greenhouse (Hefei Anhui Mulong Mountain DendrobiumBiotechnology Development Co., Ltd) under the conditions of day 24°C and night 18°C, with natural light. Six replicates of each sample, including one- to three-year-old stems of the two species, were collected from the same pot. Surface soil was removed by wash-ing with water, and the materials were dried with filter paper. Then, the samples were immedi-ately frozen in liquid nitrogen and stored at -80°C until use for metabolomics analysis.
Methanol and chloroform (HPLC grade) were purchased from TEDIA (Fairfield, OH, USA). Pyridine was obtained from Dr. Ehrenstorfer (Augsburg, Germany). Adonitol and methoxylamine hydrochloride were purchased from Sigma-Aldrich. N,O-bis (trimethylsilyl)-trifluoroacetamide (BSTFA) containing 1% trimethylchlorosilane (TMCS) was purchased from SUPELO (Bellefonte, PA, USA). Ultra-pure water was obtained from Wahaha Group Co., Ltd. (Hangzhou, China).
Metabolite extraction and derivatization
Metabolite extraction was performed according to the reference [12]. Each of the frozen sam-ples (100±5 mg of fresh weight forD.officinale, 10±0.5 mg of fresh weight forD.huoshanense) was ground to a fine powder with liquid nitrogen and transferred to 10-mL centrifuge tubes. Quality control (QC) samples were used by mixing the same mass of eachDendrobiumsample and blank samples were also prepared with empty reactions, handling with the same method as that for the real samples. Next, 1.4 mL of cold methanol (-20°C) was added to the tube and vor-texed for 1 min. As an internal quantitative standard in the methanol/water phase, 60μL of
adonitol (0.2 mg/mL) was added to the tube and vortexed for 30 s. The mixture was extracted using a supersonic instrument for 30 min (40°C). Next, mixed with 750μL of chloroform and
1.4 mL of dH2O (4°C) vortexed for 1 min, and centrifuged at 8000 rpm for 15 min. One millili-ter of the upper phase was transferred into a fresh 1.5-mL tube and dried under a nitrogen gas stream for derivatization. First, the dried samples were dissolved in 60μL of methoxylamine
hydrochloride (20 mg/mL in pyridine), vortexed for 30 s and heated at 37°C for 120 min. Then, 60μL of BSTFA was added, followed by heating at 25°C for 90 min. The derivatized
sam-ples were transferred into glass vials (Aglient) for GC-MS analysis.
GC-MS analysis
The samples were analyzed using an Agilent 7890A gas chromatograph coupled to an Agilent 5975C mass spectrometer. The chromatographic separation was performed on a DB-5MS col-umn (30 m ×250μm × 0.25μm). The injection volume was 1μL, and the split ratio was 20: 1.
The injector and ion source temperatures were 280°C and 250°C, respectively. The interface temperature was 250°C. The helium gas flow rate through the column was 1.0 mL/min. The temperature program began at 40°C and was held for 5 min, then increased at 10°C/min to 280°C and was maintained for 5 min. For MS detection, ions were generated by a 70-eV elec-tron with an elecelec-tron impact (EI) ionization mass spectrometric detector (MSD). Quadrupole mass spectrometry was performed using the full-scan method from 35 to 780 (m/z).
Data analysis
Raw GC-MS data were exported into CDF format by Agilent GC/MS 6890 data analysis soft-ware and subsequently processed by XCMS (V. 1.12.1) running under the R package (V. 2.7.2). The main functions of the XCMS software include matched filtration, peak detection, peak matching and novel nonlinear retention time alignment. Internal standards and any known artefact peaks caused by column pressure, noise, solvent and derivatization procedure, were removed from the matrix. The XCMS output was further processed using Microsoft Excel 2010. The peak area of each metabolite was normalized according to the adonitol internal
Fig 1. CultivatedDendrobiumseedlings. (A) CultivatedD.officinale(B) CultivatedD.huoshanense; 1, 2, and 3 represent one-,two- and three-year-old seedlings.
standard. Finally, the normalized data were imported into Simca-p software (V. 11.5) for multi-variate statistical analysis, including unsupervised principal component analysis (PCA) and supervised orthogonal partial least squares discriminant analysis (OPLS-DA), and into SPSS (V. 13.0) for cluster analysis and t-tests. A statistically significant threshold of variable influ-ence on projection values (variable influinflu-ence on projection values, VIP>1) obtained from the OPLS-DA model was combined Student’s t test (t-test) (P<0.05) to identifiy discriminating metabolites [13]. Metabolites were identified by searching the commercial database NIST 11. Publicly available data from the KEGG pathway database (http://www.kegg.jp/kegg/pathway. html) were used to confirm the relationships between metabolite-metabolite correlations. Heat map analysis was performed using Multi Experiment View 4.9.
Results
Detection of extracts from
Dendrobium
samples
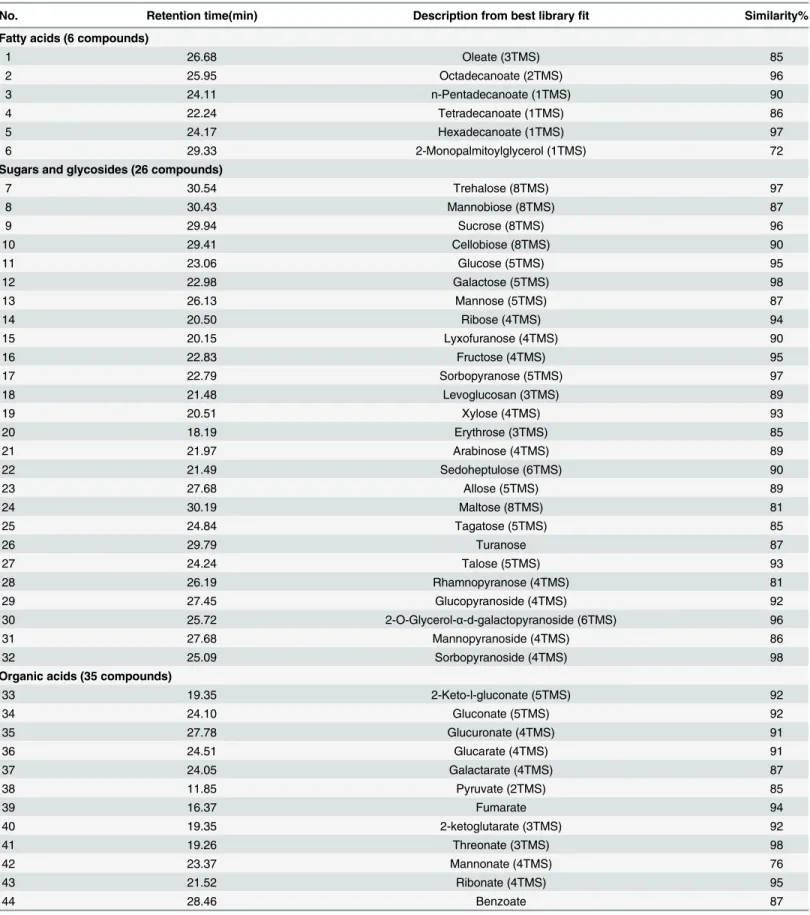
The GC-MS spectra of methanol/water phase extracts from one-year-oldD.officinaleandD. huoshanensestems are presented inFig 2. In total, 544 peaks (Fig 2A) and 249 peaks (Fig 2B) were observed forD.officinaleandD.huoshanense, respectively, and pretreated using AMDIS software. A total of 139 metabolites ofDendrobiummethanol/water phase extracts were tenta-tively identified based on similarities of greater than 70% to mass fragments in the NIST 11 standard mass spectral databases. We classified the 139 metabolites into nine main categories: fatty acids, sugars and glycosides, organic acids, amino acids, amines and amides, alcohols, alkanes, ketones, and others (Table 1).
Fig 2. GC-MS spectra of extracts from one-year-oldD.officinaleandD.huoshanensestems.A and B show the spectra of methanol/water phase extracts ofD.officinaleandD.huoshanenseone-year-old stems, respectively.
Table 1. Identification of metabolites in methanol/water phase extracts ofDendrobiumstems.
No. Retention time(min) Description from best libraryfit Similarity% Fatty acids (6 compounds)
1 26.68 Oleate (3TMS) 85
2 25.95 Octadecanoate (2TMS) 96
3 24.11 n-Pentadecanoate (1TMS) 90
4 22.24 Tetradecanoate (1TMS) 86
5 24.17 Hexadecanoate (1TMS) 97
6 29.33 2-Monopalmitoylglycerol (1TMS) 72
Sugars and glycosides (26 compounds)
7 30.54 Trehalose (8TMS) 97
8 30.43 Mannobiose (8TMS) 87
9 29.94 Sucrose (8TMS) 96
10 29.41 Cellobiose (8TMS) 90
11 23.06 Glucose (5TMS) 95
12 22.98 Galactose (5TMS) 98
13 26.13 Mannose (5TMS) 87
14 20.50 Ribose (4TMS) 94
15 20.15 Lyxofuranose (4TMS) 90
16 22.83 Fructose (4TMS) 95
17 22.79 Sorbopyranose (5TMS) 97
18 21.48 Levoglucosan (3TMS) 89
19 20.51 Xylose (4TMS) 93
20 18.19 Erythrose (3TMS) 85
21 21.97 Arabinose (4TMS) 89
22 21.49 Sedoheptulose (6TMS) 90
23 27.68 Allose (5TMS) 89
24 30.19 Maltose (8TMS) 81
25 24.84 Tagatose (5TMS) 85
26 29.79 Turanose 87
27 24.24 Talose (5TMS) 93
28 26.19 Rhamnopyranose (4TMS) 81
29 27.45 Glucopyranoside (4TMS) 92
30 25.72 2-O-Glycerol-α-d-galactopyranoside (6TMS) 96
31 27.68 Mannopyranoside (4TMS) 86
32 25.09 Sorbopyranoside (4TMS) 98
Organic acids (35 compounds)
33 19.35 2-Keto-l-gluconate (5TMS) 92
34 24.10 Gluconate (5TMS) 92
35 27.78 Glucuronate (4TMS) 91
36 24.51 Glucarate (4TMS) 91
37 24.05 Galactarate (4TMS) 87
38 11.85 Pyruvate (2TMS) 85
39 16.37 Fumarate 94
40 19.35 2-ketoglutarate (3TMS) 92
41 19.26 Threonate (3TMS) 98
42 23.37 Mannonate (4TMS) 76
43 21.52 Ribonate (4TMS) 95
44 28.46 Benzoate 87
Table 1. (Continued)
No. Retention time(min) Description from best libraryfit Similarity%
45 19.65 Phenylacetate 95
46 15.93 Succinate (2TMS) 97
47 19.74 Tartarate (2TMS) 86
48 13.26 Oxalate 90
49 13.88 Butanoate 82
50 12.72 Propanoate 89
51 19.34 Pentanoate 85
52 13.01 Hexanoate 90
53 12.02 Acetate 87
54 17.36 Nonanoate 85
55 14.72 Carbamate 90
56 29.27 Phthalate 87
57 32.50 Isophthalate 82
58 31.30 Terephthalate 90
59 26.05 1-Naphthalenesulfonate 99
60 20.81 2-Butenedioate (2TMS) 84
61 16.54 2-Butenoate 75
62 22.67 Glutarate 86
63 22.60 1-Cyclohexene-1-carboxylic acid (3TMS) 95
64 11.89 trans-2,3-Dimethylacrylic acid 85
65 22.70 Citrate (3TMS) 92
66 27.79 Galacturonate (5TMS) 90
67 22.99 Arabino-Hexonate (4TMS) 87
Amino acids (16 compounds)
68 12.75 Alanine 98
69 14.55 Valine 92
70 15.38 Norleucine 82
71 15.69 Isoleucine (1TMS) 87
72 29.19 Leucine 79
73 15.73 Proline (1TMS) 94
74 15.87 Glycine (2TMS) 94
75 16.65 Serine (2TMS) 89
76 17.01 Threonine (3TMS) 93
77 18.69 Aspartate (2TMS) 95
78 19.86 Glutamate (2TMS) 92
79 21.59 Glutamine (3TMS) 92
80 19.78 Asparagine 92
81 19.95 Phenylalanine (2TMS) 93
82 22.41 Methionine 91
83 22.55 Allylglycine 90
Amines and amides (8 compounds)
84 9.66 Ethanamine 80
85 10.66 Triethylamine 87
86 20.94 1,4-Butanediamine (4TMS) 74
87 18.90 Benzamide 87
88 14.88 Benzenesulfonamide 86
89 19.97 Lysergamide 89
Table 1. (Continued)
No. Retention time(min) Description from best libraryfit Similarity%
90 26.33 Hexadecanamide 87
91 28.11 Octadecanamide 80
Alcohols (11 compounds)
92 15.44 Glycerol (3TMS) 93
93 18.62 Threitol (4TMS) 94
94 23.51 Galactitol (6TMS) 91
95 21.59 Arabitol 89
96 22.69 Myo-inositol (6TMS) 81
97 23.79 Glucitol 90
98 23.38 Mannitol (6TMS) 82
99 17.04 1,2-Propanediol 90
100 15.79 1,2-Butanediol (2TMS) 80
101 12.32 Benzenemethanol 94
102 28.12 Ethanol 88
Alkanes (19 compounds)
103 10.71 Ethane 87
104 9.53 Butane 89
105 22.85 Hexane 90
106 15.36 Heptane 87
107 10.82 Octane 90
108 11.24 Decane 86
109 12.07 Nonane 87
110 12.73 Undecane 89
111 16.41 Dodecane 85
112 16.51 Tridecane 85
113 16.03 Tetradecane 84
114 19.01 Pentadecane 87
115 20.72 Hexadecane 90
116 19.06 Heptadecane 92
117 19.62 Nonadecane 77
118 18.66 Eicosane 80
119 25.79 Heneicosane 84
120 24.21 Tetracosane 70
121 21.56 Heptacosane 86
Ketones (3 compounds)
122 20.76 Ethanone 98
123 23.98 Psicose (6TMS) 92
124 24.96 Propan-1-one 85
Others (15 compounds)
125 24.20 Sulfurous acid 75
126 16.05 Phosphate (3:1) 95
127 15.06 Benzene 86
128 14.91 Urea 93
129 20.63 Phenol 85
130 18.44 Piperidine 73
131 10.44 α-Pinene 87
132 18.72 Cadaverine (3TMS) 70
Metabolic profiling of two medicinal
Dendrobium
stems during different
growth years
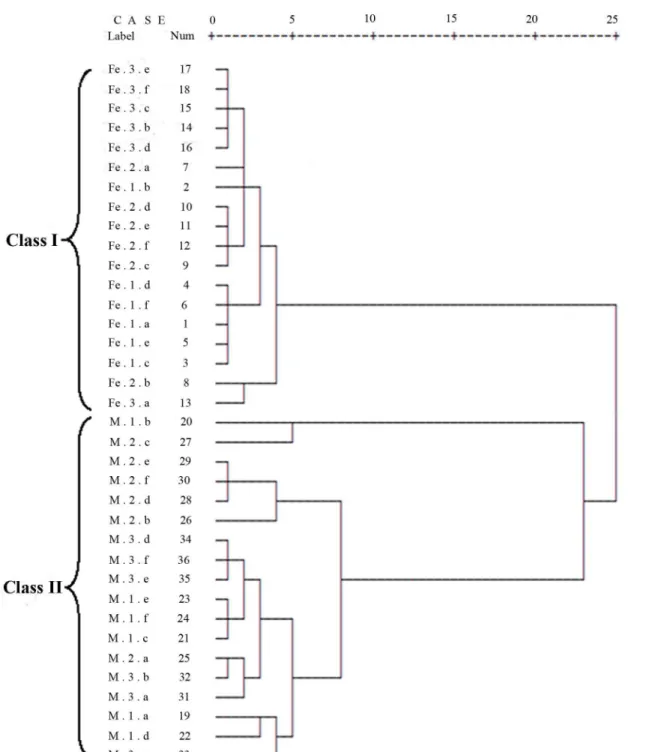
Cluster analysis of metabolites in two medicinalDendrobiumstems. The metabolites in theD.officinaleandD.huoshanensestems were subjected to cluster analysis using SPSS 13.0 software.D.officinaleandD.huoshanensewere clearly distinguished. Thirty-sixDendrobium samples were clustered into two major groups (Fig 3). AllD.officinalesamples were classified into Class I, and Class II contained 18 collections ofD.huoshanense. These results demonstrate that the metabolites in cultivatedD.officinaleandD.huoshanensewere substaintially different. The cluster analysis showed a certain influence on metabolite compositions by growth years. For example, collections ofD.officinalecould be generally clustered into three subgroups (one, two and three growth years), with some overlap. In order to further distinguish the two Den-drobiumspecies, we need to use multivariate statistical analysis.
Multivariate statistical analysis of metabolites in two medicinalDendrobiumstems.
Principal component analysis (PCA) and orthogonal partial least squares discriminant analysis (OPLS-DA) of cultivatedD.officinaleandD.huoshanensewere performed using Simca-p 11.5 software (Fig 4andFig 5). The PCA analysis showed a substantial difference between the two Dendrobiumspecies (Fig 4), with two principal components explaining 83.8% of the total vari-ability (67.2% and 16.6% for principal component 1 and principal component 2, respectively). Moreover, a clear separation among different growth years (one, two, and three) of Dendro-biumsamples was observed in the scores plot, and only a few of samples overlapped. In order to find the features with power to distinguish the twoDendrobium species with different growth years, OPLS-DA model (noisy information was removed prior to model building) was established with the scores plot and loadings plot shown inFig 5. The R2X, R2Y, and Q2of this model were 0.755, 0.868 and 0.861, respectively, indicating the stability and reliability of this OPLS-DA model. Obviously, in the analysis of the twoDendrobiumspecies metabolites data, PCA and OPLS-DA were more powerful than cluster analysis.
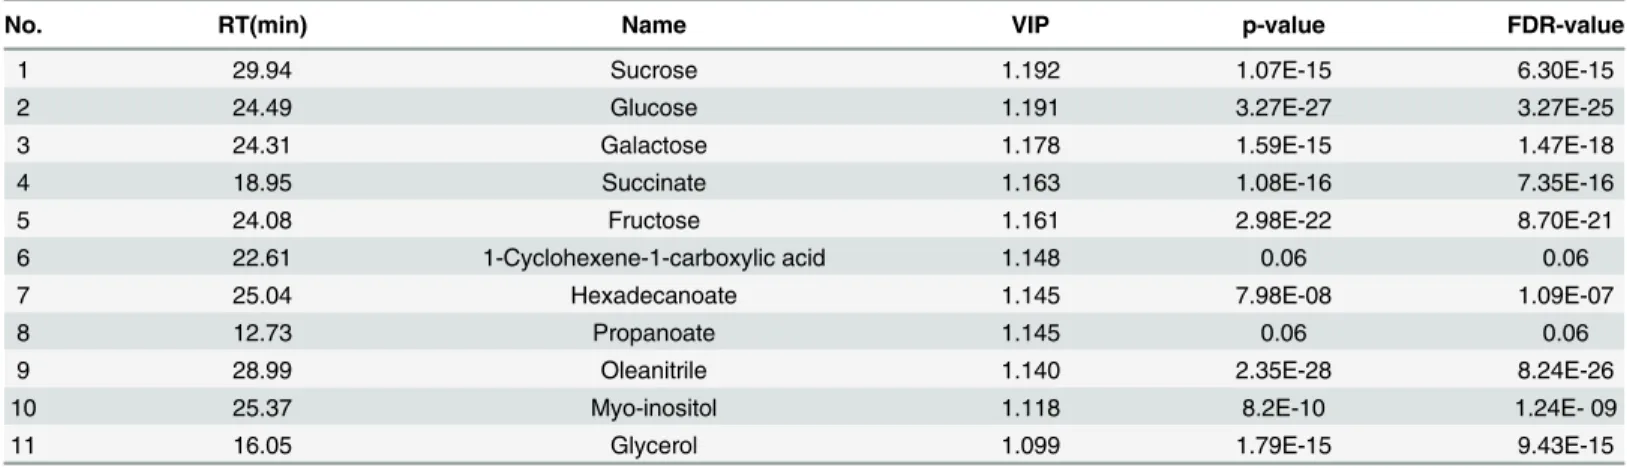
We further employed OPLS-DA to identify the metabolites contributing significantly to the separation.Table 2lists the top 11 metabolites (VIPs) influencing cluster formation within the methanol/water phase generated from OPLS-DA of the twoDendrobiumspecies. The identi-fied VIP components include 4 sugars (sucrose, galactose, glucose, fructose), 3 organic acids (1-cyclohexene-1-carboxylic acid, succinate, propanoate), 1 fatty acid (hexadecanoate), 2 alco-hols (glycerol, myo-inositol) and 1 volatile substance (oleanitrile). The contents of sucrose, galactose, glucose, fructose, succinate, myo-inositol, and glycerol were much higher inD. huoshanensethan inD.officinale(Fig 6), whereas hexadecanoate and oleanitrile levels were much lower inD.huoshanensethan inD.officinale. The VIP components from OPLS-DA were combined with the t-test (P<0.05) to identify nine significantly different metabolites
Table 1. (Continued)
No. Retention time(min) Description from best libraryfit Similarity%
133 28.97 Oleanitrile 90
134 14.29 1-Piperidinecarboxaldehyde 82
135 11.47 Benzonitrile 95
136 30.94 Coumarin 83
137 29.46 1,2-Benzenediol 83
138 13.32 Quinoline 87
139 29.44 Thiophene 80
(sucrose, glucose, galactose, succinate, fructose, hexadecanoate, oleanitrile, myo-inositol, and glycerol) as potential biomarkers that may discriminate these twoDendrobiumspecies.
Metabolites levels in the stems of two medicinalDendrobiumspecies during different growth years. Raw GC-MS data were pretreated, and the peak area of each metabolite was obtained. The software Multi Experiment View 4.9 was used to construct a heat map,
Fig 3. Hierarchical cluster analysis (HCA) of metabolic fingerprinters ofD.officinaleandD.huoshanense.“Fe”indicatesD.officinale, and“M”
indicatesD.huoshanense. The numbers 1, 2, and 3 indicate the corresponding growth years ofDendrobium. The letters a, b,
. . ., f indicate repeats of the same sample.
Fig 4. PCA scores plot and loadings plot forD.officinaleandD.huoshanensewith different growth years.(A) PCA scores plot for 36Dendrobium
collections. (B) PCA loadings plot marked by twoDendrobiumspecies.“Fe”indicatesD.officinale, and“M”indicatesD.huoshanense. The numbers 1, 2, and 3 indicate the corresponding growth years ofDendrobium.
Fig 5. OPLS-DA scores plot and loadings plot forD.officinaleandD.huoshanensewith different growth years.(A) OPLS-DA scores plot for 36
Dendrobiumcollections. (B) OPLS-DA loadings plot marked by twoDendrobiumspecies.“Fe”indicatesD.officinale, and“M”indicatesD.huoshanense. The numbers 1, 2, and 3 indicate the corresponding growth years ofDendrobium.
displaying the changes in metabolite content betweenD.officinaleandD.huoshanensein one-, two-, and three-year-old stems (Fig 7). The result suggested that the levels of the majority of amino acids were higher inD.officinalethan inD.huoshanense. Amino acids decreased inD. officinaleduring growth (from one to three years). By contrast, amino acids were maintained at
Table 2. Metabolites identified as important variables in the projection for species discrimination.
No. RT(min) Name VIP p-value FDR-value
1 29.94 Sucrose 1.192 1.07E-15 6.30E-15
2 24.49 Glucose 1.191 3.27E-27 3.27E-25
3 24.31 Galactose 1.178 1.59E-15 1.47E-18
4 18.95 Succinate 1.163 1.08E-16 7.35E-16
5 24.08 Fructose 1.161 2.98E-22 8.70E-21
6 22.61 1-Cyclohexene-1-carboxylic acid 1.148 0.06 0.06
7 25.04 Hexadecanoate 1.145 7.98E-08 1.09E-07
8 12.73 Propanoate 1.145 0.06 0.06
9 28.99 Oleanitrile 1.140 2.35E-28 8.24E-26
10 25.37 Myo-inositol 1.118 8.2E-10 1.24E- 09
11 16.05 Glycerol 1.099 1.79E-15 9.43E-15
RT, retention time; VIP, variable importance in the projection; p-value and FDR-value indicate the significance and false discovery rate of difference of the relative metabolite levels betweenD.officinaleandD.huoshanense, respectively.
doi:10.1371/journal.pone.0146607.t002
Fig 6. Important compounds (VIPs) that exhibited significant differences between the twoDendrobiumspecies.“Fe”meansD.officinale, and“M”
meansD.huoshanense. The bars represent metabolite peak areas across the 18 samples of each species. The error bars indicate the standard deviations of six biological repeats (including one-, two-, and three-year-oldDendrobiumstem samples, each with six repeats). The nine candidate biomarkers were sucrose, glucose, galactose, succinate, fructose, hexadecanoate, oleanitrile, myo-inositol, and glycerol (**P<0.01,D.officinalecompared toD. huoshanense).
low levels during three years of growth inD.huoshanense, with only valine and proline exhibit-ing higher levels in three-year-old stems. The profiles of changes in sugar and glycoside levels were obvious in bothD.officinaleandD.huoshanense. The total amount of sugars was higher inD.huoshanensethanD.officinale. Sucrose, glucose, mannose, fructose and erythrose main-tained constant high levels during the three-year growth period in bothDendrobiumspecies, whereas galactose and trehalose reached their highest levels inD.officinaleduring the first growth year and then decreased in the next two years. ForD.huoshanense, sugar and glycoside levels either remained constantly high or increased from one to three growth years. The organic acids propanoate, succinate, and 1-cyclohexene-1-carboxylic acid all remained at a high level during the three growth years. InD.officinale, 2-keto-l-gluconate, 2-ketoglutarate, glutarate,
Fig 7. Heat map of major metabolites during different growth stages ofD.officinaleandD.huoshanense.All data are provided inS1 Table. The metabolite peak areas in each sample represent the average peak areas. The lowest figures are in green, and the highest figures are in red.“Fe”and“M”
refer toD.officinaleandD.huoshanense, respectively. The numbers 1, 2, and 3 represent one, two, and three growth years.
ribonate and arabino-hexonate decreased throughout the three-year growth period. InD. huoshanense, 2-keto-l-gluconate, gluconate, acetate, 2-butenoate and benzoate increased signifi-cantly during the three years. Fatty acids and ketones did not vary during the growth stage. Alco-hols other than glycerol and myo-inositol remained at high levels in bothDendrobiumspecies. Other alcohols exhibited different changes betweenD.officinaleandD.huoshanense. For exam-ple, arabitol and 1,2-butanediol increased inD.officinalebut decreased inD.huoshanense.
Construction of metabolic profiling between two medicinal
Dendrobium
species
The functions of the identified metabolites in the main plant metabolic pathways network were examined (Fig 8). As compared with those inD.officinale, the contents of sucrose, glucose, myo-inositol, hexane and benzamide inD.huoshanenseincreased 9.5-fold, 54.4-fold, 12.6-fold, 4.2-fold and 9.7-fold, respectively. Whereas, the contents of piperidine, oxalate, octadecanoate, urea, carbamate, ethane and oleanitrile decreased 0.2-fold, 0.3-fold, 0.5-fold, 0.02-fold, 0.009-fold, 0.3-fold and 0.15-fold, correspondingly. As shown above, most soluble sugars showed significant increases inD.huoshanense, which may suggest much higher freezing toler-ance inD.huoshanense[14]. InD.officinale, the content of piperidine was much higher than that inD.huoshanense.
Discussion
Metabolomics has been applied extensively to plants [15–17], such as the identification of metabolite changes, the identification of differences in metabolites between wild type and mutant plants [18–21]. The use of metabolomics to studyDendrobiummetabolites has not been reported. We preliminarily constructed a metabolomics platform and analyzed the metabolites in the methanol/water phase of cultivatedD.officinaleandD.huoshanensestems collected during different growth years.
Analysis of
Dendrobium
metabolic profiling provides an important basis
for species identification
Cluster analysis of the methanol/water phase metabolites ofDendrobiumdistinguished the two Dendrobiumspecies.D.officinaleandD.huoshanensewere classified into two clusters, Class I and Class II, respectively. PCA and OPLS-DA, two multivariate statistical analysis methods widely used in metabolomics, both not only clearly separatedD.officinaleandD.huoshanense but also distinguished different growth years of eachDendrobiumspecies. VIP components combined with the t-test (P<0.05), in which significantly different metabolites were selected as potential biomarkers (sucrose, glucose, galactose, succinate, fructose, hexadecanoate, oleani-trile, myo-inositol, and glycerol), provide an important method forDendrobiumidentification. Consistent with our results, Yuan H reported that the relative peak area of glucose could be used as a foundation forDendrobiumidentification using a pre-column derivatization HPLC method [22]. Currently, oleanitrile has not been reported inDendrobiumspecies. In our study, oleanitrile was one of the biomarkers ofDendrobium, which suggests the metabolomics tech-nology platform we constructed is relatively comprehensive.
Analysis of
Dendrobium
metabolic profiling provides an important basis
for quality control of medicinal
Dendrobium
medicinal quality ofDendrobium[24]. The heat map and 11 VIP components confirmed the higher sugar content inD.huoshanensethan inD.officinale(Fig 7andTable 2), which indi-cates thatD.huoshanenseexhibits better quality. According to the metabolic profiling of Den-drobium, we suppose thatD.officinalemay have piperidine alkaliod because of its high piperidine content [25]. However, piperidine alkaliod has not been successfully annotated. It’s probable that we just detected the metabolites in polar phase ofDendrobium. The metabolites fromDendrobiumnon-polar phase should also be detected since most alkaloids are fat-souble in plants. Besides, most of the secondary metabolites are thermally labile and unsuitable for GC-MS analysis.
During the three growth years, the total sugar content first decreased and then increased. These changes may reflect the basic physical transformation and energy metabolism in the
Fig 8. Comparisions of metabolite levels inD.officinaleandD.huoshanense.The ratios in the red or green bar indicate high or low relative metabolite peak areas, respectively, of cultivatedD.huoshanensecompared toD.officinale. The level of significance was set at P<0.05. The metabolites in gray characters were undetectable. G6P, glucose-6-phosphate; F6P, fructose-6-phosphate; 3PGA, 3-phosphoglycerate; PEP, phosphoenolpyruvic acid.
Dendrobiumvegetative phase. Amino acids levels decreased over the growth years because basic amino acids are nitrogen-containing precursors that are involved in the biosynthesis of a variety of secondary metabolites in plants. Based on the accumulated metabolites in Dendro-bium, the optimal harvest time is in the third year [26]. Cluster analysis and multivariate statis-tical analysis ofDendrobiummetabolites discriminated differentDendrobiumspecies and provided a new basis for identification and quality control.
In our study, the metabolites inDendrobiumstems were analyzed using GC-MS, and the majority of the metabolites examined were primary metabolites. In future work, we will com-bine metabolomics, transcriptomics and proteomics technologies to further study secondary metabolites, particularly pharmaceutically effective ingredients inDendrobiumand synthesis mechanisms.
Supporting Information
S1 Table. Major metabolites ofD.officinaleandD.huoshanenseduring different growth years.
(XLS)
Acknowledgments
We would like to thank American Journal Experts (AJE) for editing our manuscript. Thanks for the GC-MS analysis platform provided by Zhongliang Zhu from University Of Science And Technology Of China. The study was supported by Discipline Backbone Cultivated Foundation in Anhui Agricultural University (Grant No.2014XKPY-41), Twelfth Five-Year Plan for Sci-ence & Technology Support of Anhui Province (Grant No.1301032139), and Collaborative innovation Center of Agri-forestry Industry in Dabieshan Area in Anhui Agricultural University.
Author Contributions
Conceived and designed the experiments: YL YC. Performed the experiments: QJ CJ SS YZ. Analyzed the data: QJ CJ SS CS. Contributed reagents/materials/analysis tools: CJ SS. Wrote the paper: QJ CJ SS HF.
References
1. Jin Q, Yao Y, Cai Y, Lin Y. Molecular cloning and sequence analysis of a phenylalanine ammonia-lyase gene from dendrobium. PLOS ONE. 2013; 8: e62352. doi:10.1371/journal.pone.0062352PMID:
23638048
2. Xiang X-G, Schuiteman A, Li D-Z, Huang W-C, Chung S-W, Li J-W, et al. Molecular systematics of den-drobium (Orchidaceae, Dendrobieae) from mainland Asia based on plastid and nuclear sequences. Mol Phylogenet Evol. 2013; 69: 950–960. doi:10.1016/j.ympev.2013.06.009PMID:23811435
3. Feng S, He R, Yang S, Chen Z, Jiang M, Lu J, et al. Start codon targeted (SCoT) and target region amplification polymorphism (TRAP) for evaluating the genetic relationship of dendrobium species. Gene. 2015; 567: 182–188. doi:10.1016/j.gene.2015.04.076PMID:25936992
4. Chen X, Wang F, Wang Y, Li X, Wang A, Wang C, et al. Discrimination of the rare medicinal plant den-drobium officinale based on naringenin, bibenzyl, and polysaccharides. Sci China Life Sci. 2012; 55: 1092–1099. doi:10.1007/s11427-012-4419-3PMID:23233224
5. Ng TB, Liu J, Wong JH, Ye X, Sze SCW, Tong Y, et al. Review of research on Dendrobium, a prized folk medicine. Appl Microbiol Biotechnol. 2012; 93: 1795–1803. doi:10.1007/s00253-011-3829-7
PMID:22322870
7. Lu S, Guo G, Cai Y. Progress in physiological and biochemical characters of dendrobium huosha-nense. Chin Tradit Herb Drugs. 2006; 37: 790.
8. Duan L-X, Chen T-L, Li M, Chen M, Zhou Y-Q, Cui G-H, et al. Use of the metabolomics approach to characterize Chinese medicinal material Huangqi. Mol Plant. 2012; 5: 376–386. doi:10.1093/mp/ ssr093PMID:22138859
9. Lee D-K, Yoon MH, Kang YP, Yu J, Park JH, Lee J, et al. Comparison of primary and secondary metab-olites for suitability to discriminate the origins of Schisandra chinensis by GC/MS and LC/MS. Food Chem. 2013; 141: 3931–3937. doi:10.1016/j.foodchem.2013.06.064PMID:23993568
10. Wang H, Wang H-H, Ma C-F, Liu B-Y, Xu G-W, Ye H-C. Metabolomics-based studies on Artemisinin biosynthesis. In: Plant metabolomics. Netherlands: Springer; 2015. pp. 245–273.
11. Sun H, Ni B, Zhang A, Wang M, Dong H, Wang X. Metabolomics study on Fuzi and its processed prod-ucts using ultra-performance liquid-chromatography/electrospray-ionization synapt high-definition mass spectrometry coupled with pattern recognition analysis. Analyst. 2012; 137: 170–185. doi:10. 1039/c1an15833cPMID:22030742
12. Lisec J, Schauer N, Kopka J, Willmitzer L, Fernie AR. Gas chromatography mass spectrometry–based metabolite profiling in plants. Nat Protoc. 2006; 1: 387–396. doi:10.1038/nprot.2006.59PMID:
17406261
13. Jumtee K, Bamba T, Fukusaki E. Fast GC‐FID based metabolic fingerprinting of Japanese green tea leaf for its quality ranking prediction. Journal of separation science. 2009; 32: 2296–2304. doi:10. 1002/jssc.20090096PMID:19569110
14. Wanner LA, Junttila O. Cold-induced freezing tolerance in Arabidopsis. Plant Physiology. 1999; 120: 391–400. doi:10.1140/pp.120.2.391PMID:10364390
15. Noutsos C, Perera AM, Nikolau BJ, Seaver SMD. Metabolomic Profiling of the Nectars of Aquilegia pubescens and A. Canadensis. PLOS ONE. 2015; 10: e0124501. doi:10.1371/journal.pone.0124501
PMID:25933103
16. Zhang J, Wang X, Yu O, Tang J, Gu X, Wan X, et al. Metabolic profiling of strawberry (Fragaria× ana-nassa Duch.) during fruit development and maturation. Journal of experimental botany. 2010; erq343. doi:10.1093/jxb/erq343
17. Tan H, Xie Q, Xiang X, Li J, Zheng S, Xu X, et al. Dynamic Metabolic Profiles and Tissue-Specific Source Effects on the Metabolome of Developing Seeds of Brassica napus. PLOS ONE. 2015; 10: e0124794. doi:10.1371/journal.pone.0124794PMID:25919591
18. Lee E-J, Shaykhutdinov R, Weljie AM, Vogel HJ, Facchini PJ, Park S-U, et al. Quality assessment of ginseng by 1(H) NMR metabolite fingerprinting and profiling analysis. J Agric Food Chem. 2009; 57: 7513–7522. doi:10.1021/jf901675yPMID:19655726
19. Kim N, Kim K, Choi BY, Lee D, Shin Y-S, Bang K-H, et al. Metabolomic approach for age discrimination of panax ginseng using UPLC-Q-Tof MS. J Agric Food Chem. 2011; 59: 10435–10441. doi:10.1021/ jf201718rPMID:21916514
20. Toh D-F, New L-S, Koh H-L, Chan EC. Ultra-high performance liquid chromatography/time-of-flight mass spectrometry (UHPLC/TOFMS) for time-dependent profiling of raw and steamed Panax notogin-seng. J Pharm Biomed Anal. 2010; 52: 43–50. doi:10.1016/j.jpba.2009.12.005PMID:20079593
21. Tianniam S, Tarachiwin L, Bamba T, Kobayashi A, Fukusaki E. Metabolic profiling of Angelica acutiloba roots utilizing gas chromatography-time-of-flight-mass spectrometry for quality assessment based on cultivation area and cultivar via multivariate pattern recognition. J Biosci Bioeng. 2008; 105: 655–659. doi:10.1263/jbb.105.655PMID:18640606
22. Yuan H, Bai Y, Si J, Zhang A, Jin X. Variation of monosacchride composition of polysacchrides in Den-drobium officinale by pre-column derivatization HPLC method. Zhongguo Zhong Yao Za Zhi=China Journal of Chinese Materia Medica. 2011; 36: 2465–2470. PMID:22256746
23. Xu J, Han Q-B, Li S-L, Chen X-J, Wang X-N, Zhao Z-Z, et al. Chemistry, bioactivity and quality control of Dendrobium, a commonly used tonic herb in traditional Chinese medicine. Phytochemistry reviews. 2013; 12: 341–367. doi:10.1007/s11101-013-9310-8
24. Lv G, Yan M, Chen S. Review of pharmacological activities of Dendrobium officinale based on tradi-tional functions. Zhongguo Zhong Yao Za Zhi=China Journal of Chinese Materia Medica. 2013; 38: 489–493. PMID:23713270
25. Virjamo V, Julkunen-Tiitto R. Shoot development of Norway spruce (Picea abies) involves changes in piperidine alkaloids and condensed tannins. Trees. 2014; 28: 427–437. doi: 10.1107/s00468-013-0960-3