E
CONOMIC
ANALYSIS OF THE VACCINATION
STRATEGIES ADOPTED IN BRAZIL IN
1982 ’
Ma&a A&& Domz’ngzcex UgG2
I
N’I’RODUCTION
The economic crisis affecting Latin America in recent years has seen widespread reduction in resources ear- marked for government programs in so- cial sectors-including the health sector. In Brazil, this trend aggravated the situa- tion that was already emerging in the pe- riod preceding the crisis when, despite economic growth and the availability of extensive financial resources, such re- sources were generally being allocated to the directly productive sectors of the economy, with social sector projects be- ing given a secondary status.
Internationally, the shortage of public resources drew attention to the need to rationalize use of those available and to identify areas of action that should receive priority. Among the prior- ity areas identified were activities of the PAHOIWHO Expanded Program on Immunization (EPI) directed at provid- ing the vaccines that serve as effective
’ The study reported here was carried out at the Public Health Services (SESP) Foundation of the Ministry of Health of Brazil, with advice provided by economist Andrew Creese, author of the methodology employed. This article has also been published in Portuguese in the Bob&a de La Ojkina Sanitati Panamericana, vol. 103, no. 6, 1987, pp. 675-694.
s National School of Public Health (Escola National de Saude Publica), Oswald0 Cruz Foundation (Funda@o Oswald0 Cruz), Rio de Janeiro, Brazil.
tools for controlling preventable commu- nicable diseases.
Among other things, the EPI developed a methodology for economic evaluation of different Member Country vaccination strategies and later promoted studies applying that methodology. This article analyzes implementation of the EPI in Brazil in l$S? by comparing the economic performance (including the cost of vaccination services and the num- ber of vaccinations given) of the three ba- sic vaccination strategies being imple- mented in the country at that time. The three strategies, consolidated under the National Program on Immunization and implemented by various institutions at the federal, state, and municipal levels of government, can be described as follows:
l Second, the routine program
was intensified by short-duration vacci- nation services provided at designated times by mobile teams. These teams served both peripheral urban areas of headquarters districts, where the sup- porting health units were located, and rural areas of particular municipalities that were thinly populated and therefore not served by a permanent health unit. Such intensification of the routine pro- gram was planned and implemented by full-time personnel of the supporting health units involved. These intensified efforts sometimes provided only one or two kinds of vaccination, and sometimes provided the full range of vaccinations called for by the EPI program.
l Finally, mass vaccination cam-
paigns of short duration were conducted. (In 1982 these were limited to providing
a single vaccine in most states.) Specific resources were earmarked for these cam- paigns, in which a range of organizations and individuals-including local govem- ments, health units, schools, private or- ganizations, and volunteers-partici- pated by contributing human and material resources.
M
ATERIALSAND
METHODS
Each of these vaccination strategies was studied, using a sample of 55 health units (Annex 1) from 15 mu- nicipalities located in two Brazilian states, Pa.15 in the north and Pernam- buco in the northeast. These municipali- ties exhibited notably different charac- teristics in terms of size, urban or rural
features, and the responsible health in- stitutions involved (the Public Health Services Foundation, state secretariats of health, or other agencies).
The types of health units in- volved were as follows:
l Forty of the units were health
posts with primary care personnel trained in simplified techniques. These posts were linked to health centers that pro- vided support and supervision.
l Ten of the units were health
centers providing regular medical and health care in four basic specialties-clin- ical medicine, minor surgery, obstetrics and gynecology, and pediatrics. This care was provided for ambulatory patients by general practitioners.
l Four of the units were mixed,
consisting of a health center and inpa-
tient facility under a single administra- 2 tive structure. These units, which were 3 providing medical-health and dental E care, lent support to the health centers and posts within their areas of responsi- 2 bility.
l One unit was a local hospital c 2
providing care in the aforementioned ba- sic medical specialties and clinical surgery
2 for a defined population. 5 2 Some of the units were urban
and some rural, with varying degrees of
5 accessibility. Several, in riverine parts of 2 Par5 State, could be reached only by 2 boat. As indicated in Annex 1, a variety s of federal, state, and municipal institu-
tions provided support for the study & units. Table 1 shows the recorded vacci- ‘rt . nation coverage provided by the routine 3 vaccination services of the study munici- D palities in 1982, combined in the case of
the second polio vaccination with cover-
$, age provided by the mass campaign,
‘s Since the auestion at hand
8
was not whether vaccination services were
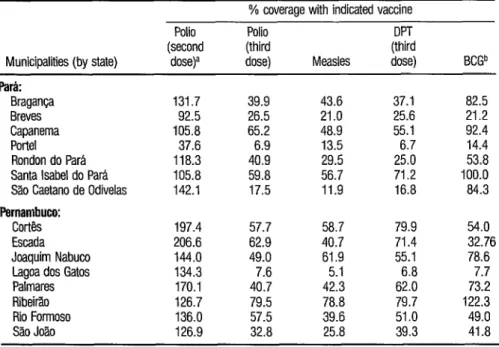
TABLE 1. Recorded vaccination coverage among children one year of age in the study municipaliies that was provided by the routine vaccination services. In the case of the second polio immunization the data also include coverage provided by the mass campaign.
% coverage with indicated vaccine Polio Polio
(second (third (%!I Municipalities (by state) dose)a dose) Measles dose)
Park
Braganca 131.7 39.9 43.6 37.1 Breves 92.5 26.5 21 .o 25.6 Capanema 105.8 65.2 48.9 55.1 Porte1 37.6 6.9 13.5 6.7 Rondon do Para 118.3 40.9 29.5 25.0 Santa Isabel do Para 105.8 59.8 56.7 71.2 Sao Caetano de Odivelas 142.1 17.5 11.9 16.8
Pernambuco:
Cortb 197.4 57.7 58.7 79.9 Escada 206.6 62.9 40.7 71.4 Joaquim Nabuco 144.0 49.0 61.9 55.1 Lagoa dos Gatos 134.3 7.6 5.1 6.8 Palmares 170.1 40.7 42.3 62.0 Ribeirao 126.7 79.5 78.8 79.7 Rio Formoso 136.0 57.5 39.6 51 .o Sao Joao 126.9 32.8 25.8 39.3
a Percentages over 100 reflect double vaccinations or vaccination of children outside of the mdmted age bracket.
b Percentage of all children under one year of age.
BCGb
82.5 21.2 92.4 14.4 53.8 100.0 84.3
54.0 32.76 78.6
7.7 73.2 122.3 49.0 41.8
vices should be provided by the govern- ment, our study’s aim was to identify the most efficient means of providing these services without losing sight of the EPI goals. For purposes of this analysis, it was felt most suitable to employ the cost- effectiveness method described by econ- omist Andrew Creese in the WHO docu- ment “Expanded Program on Immuni- zation: Costing Guidelines.“3
Within this context, the rela- tionship between cost and effectiveness indicates the relative success of each strat- egy. For purposes of the analysis, cost was defined as social cost-i.e., the resources spent by society as a whole, including but not limited to the resources spent by the responsible institutions-of imple-
’ World Health Organization, Geneva, 1979.
menting the National Program on Im- munization (Programa National de Imuniza@o-PNI). Effectiveness was defined in terms of the number of chil- dren under one year of age who were fully vaccinated with each type of vac- cine, and the number of vaccinations they received.
costs
The costs calculated included costs at all the administrative levels in- volved in the PNI, stratified as follows:
l Level I: the implementing en-
nation posts performing the vaccina- tions;
0 Level II: the regional supervi- sory and coordinating bodies, these con- sisting of the regional health boards of the state health secretariats;
. Level III: the national pro- gram’s state coordinating bodies, these being the state health secretariats and the regional boards of the Public Health Ser- vices (SESP) Foundation; and
l Level IV: the program’s na-
tional coordinating bodies, i.e., the health ministry’s National Secretariat for Basic Actions (SNABS) and SESP Foun- dation; and the Ministry of Social Secu- rity and Welfare’s Drug Supply Center, which was responsible for distributing the vaccines.
Data on the capital costs (of buildings, vehicles, and equipment) and operating costs (of personnel, consum- ables, travel, etc.) involved in carrying out the national program in 1982 were gathered at each of these four adminis- trative levels. In most cases where a cost could not be attributed exclusively to the vaccination service, this cost had to be apportioned in accordance with the share applicable to the program. Thus, the costs of personnel directly or indirectly involved in the program were calculated according to the estimated percentage of working time devoted to vaccination pro- gram work. Similarly, the costs of equip- ment, materials consumed, and other goods and services (water, electricity, tele- phones, etc.) were apportioned accord- ing to the percentage of total consump- tion used for the national program.
For the health units, the costs were merely calculated in this manner. However, costs at other administrative levels were apportioned to each health unit involved. In this way, the total esti- mated cost of the vaccination service con- sisted of the vaccination cost at each
health unit plus that portion of the costs at other levels apportioned to each unit.
Besides considering the social costs to the health sector, the calculations included the costs incurred by the users of vaccination services. For that purpose, a one-month survey was taken at one routine vaccination service and two cam- paign posts (one urban and one rural) for each municipality in the sample. This survey sought to determine the time and money spent by the users for each vacci- nation. In addition, in the case of the vaccination campaign (which involved participation by several social sectors) contributions received in the form of vol- untary labor, donations, and loans were added to the social costs.*
Since effectiveness was mea- sured in terms of the number of vaccina- tions provided to infants, the unit for comparing performance of the different vaccination services was the ratio of total cost to the number of such vaccinations, which was known as the “unit vaccina- tion cost .” Similarly, when considering effectiveness from the standpoint of complete vaccinations (i.e., three doses of DPT and poliomyelitis vaccines) the unit of comparison was the ratio of total cost to the number of complete vaccina- tions, termed the “unit cost of complete vaccination.”
To compare strategies, the cost to the user of each vaccination was added to the unit cost of vaccination for
* The methodology used in the one-month survey is de- scribed in greater detail in the appendix of a document entitled “Detalhamento do modelo de c6lculo adotado
no estudo de custo-eficikcia das estratggias de vaci-
na@o,” which is available from the author.
the health unit involved. And, since the strategies in question were undertaken at different times, the costs derived were converted to December 1982 equiva- lents, based on the General Price Index.
E
XECUTION OF
VACCINATION
STRATEGIES IN THE
MUNICIPALITIES STUDIED
Delivery of routine vaccina- tion services in each municipality was or- ganized through the supporting health center. Partly for this reason, there were variations in the way the work was done from one unit to the next. For instance, certain units, instead of offering all the PNI (national program) vaccines on a daily basis, chose to set aside a specific day of the week for each vaccine, so as to avoid major losses when using bottles with many doses. Or, to cite a more ex- treme example, certain health posts in Para State that served small populations offered vaccination services only once a month, on a predetermined date. These posts did not keep vaccines in stock; rather, they received them monthly from the support units, to which they re- turned the unused vaccines. Neverthe- less, the most common practice in the health units studied was to provide vacci- 2 nations daily, on a comprehensive basis, 2 offering the full range of PNI vaccines.
- 3
Six health posts included in the Para r;3 study sample were closed during the pe- .g riod covered by the study and thus were 9, not considered (even though they repre- 2 3 sented immobile, unproductive capital). z Intensification of routine ser- 3
vices in 1982 was carried out by 10 units in the Pernambuco sample and six in the Par5 sample. Certain health centers (such as the one at Santa Isabel do Par-a) di- 254 rected these intensified services at pe-
ripheral areas of the municipal seat. Oth- ers, located in the sugar cane region of Pernambuco, dispatched their teams to areas where the cane was grown and pro- cessed; this was done on working days, with the team returning each day to the support unit. In general, the success of these intensification efforts depended greatly upon how well the schedule of visits to the local population was planned, and also upon prior publicity given to the dates of the vaccination days.
The National Poliomyelitis Vaccination Campaign, which had been launched in 1980 with the “National Days of Poliomyelitis Vaccination” aimed at children under five years of age, was continued in 1982. A number of Par5 State municipalities used the struc- ture of this poliomyelitis campaign to si- multaneously administer DPT vaccine to children of the same age group in urban areas. Indeed, Sao Caetano de Odivelas was the only Par5 municipality in the study sample that did not include DPT vaccine in the campaign.
C
OST ANALYSIS
The analysis was carried out in two ways. First, the costs at the various health units were compared, taking into account the units’ different characteris- tics and the cost structures of the various strategies employed. And second, the costs of the various strategies were com- pared, together with the results obtained by each. For purposes of this study, the two types of analysis are referred to as
Irma-Strategy Analysis
Routine services: structure of vaccina- tion costs. Regarding the composition of vaccination costs, fued costs (taken as the costs of buildings, vehicles, equip- ment, and administrative personnel) were found to average 35.1% of the health units’ total vaccination costs in the Pernambuco health units and 48.3 %
of the total costs in the Par2 health units. The considerable share of total vaccina- tion costs accounted for by these fued costs means, in essence, that in order to lower costs, either the number of vacci- nations must be increased or else the futed costs must be reduced.
Such reduction could be ac- complished, among other things, by re- ducing the idle capacity of unused or un- derused capital resources. For example, underused vaccination rooms (found most notably at health posts that vacci- nate only once a month) could be used for other activities. The existence of such idle capacity in the health units studied is shown by the high share of health post vaccination costs attributed to the cate- gory “buildings,” which in certain Par5 units accounted for between 58 % and
88% of all the costs reported.
Regarding variable costs, the largest component was found to be the cost of directly involved personnel, which averaged 37.1% of all variable costs in Par5 and 5 1.8 % in Pemambuco.
The actual vaccines employed accounted for about 4% of the total vaccination program costs in the units studied.
Routine services: vaccination costs.
In seeking to compare overall vaccination costs at different units, the costs incurred
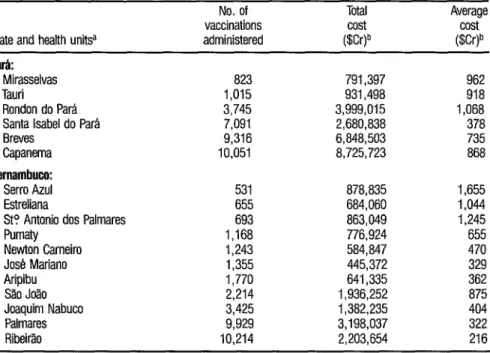
at other administrative levels were ini- tially omitted so as to avoid reducing contrasts between the units’ costs by add- ing the prorated costs of the other levels. Table 2 (the only table from which these upper-level costs were omitted) shows the costs found for 14 different units per- taining to one institution (the Public Health Services Foundation or SESP) , se- lected because these units all had the same basic cost factors-especially with regard to personnel costs, which consti- tuted the largest single item.
For the units in Pernambuco, it was found that the average cost per vaccination tended to decrease with in- creased output, and that marginal costs were much lower than average costs (ex- cept for the SgoJo20 and Aripubu units). This trend, graphed in Figure 1, suggests that most of the health units were oper-
ating far below their most productive ca- 2
pacity. 3
This trend was less clear-cut in I2 Par5 because the units that vaccinated
the most people tended to be the hardest iz to reach (such as Breves) or to serve dis- E persed rural populations (such as Ron- + don do Pars)-circumstances that led to
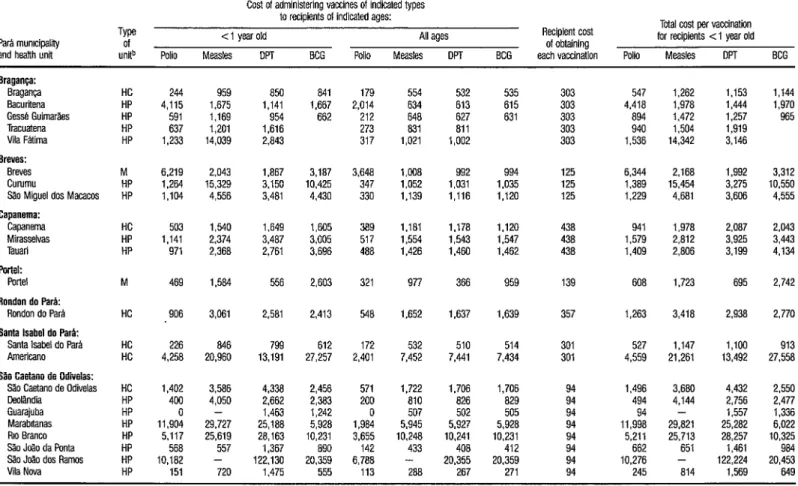
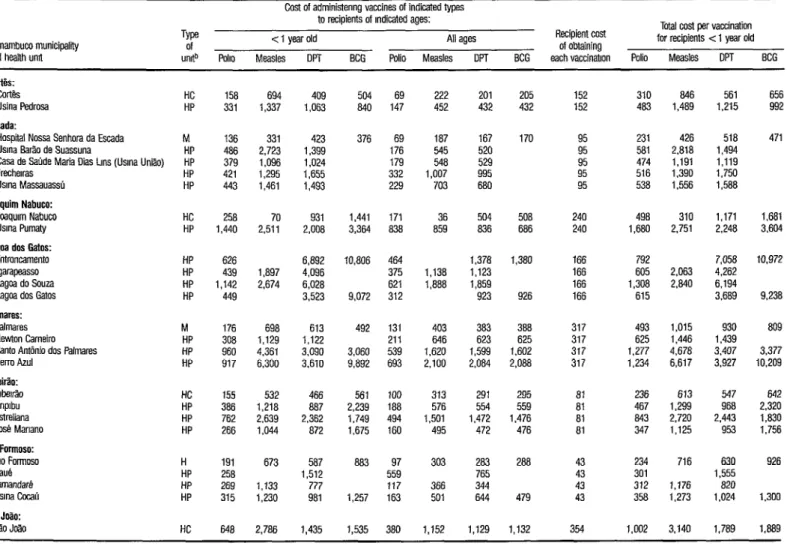
increased average vaccination costs. 2 5 Tables 3 and 4 show the costs per vaccination, by type of vaccination, is for all the study units. Generally, 5 throughout Pernambuco and in most of
the Par2 municipalities, the larger
2 (higher-ranking) types of units had the s lowest average costs per vaccination, due
2 mainly to economies of scale. That is, the
smaller units administered fewer vaccina- & l
tions and were forced to operate with
futed costs that constituted a consider- 3 able share of the total cost. D
Another factor that should be s considered in this regard is the now-rec- 25 ognized tendency of users to turn prefer- s entially to health units that provide B higher levels of care (even though they
TABLE 2. Vaccination costs at health units of one institution, the Special Public Health Servfce (Service Especial de Salde Wblica-SESP), in the study municipalities of Pati and Pernambuco, 1982.
State and health unW
No. of Total vaccinations cost administered @.Nb
Average
P&i:
Mirasselvas Tauri
Rondon do Para Santa Isabel do Para Breves
Capanema
Pernambuco:
Serro Azul Estreliana
St? Antonio dos Palmares Pumaty
Newton Carneiro Jose Mariano Aripibu Silo Jofto Joaquim Nabuco Palmares Ribeirao
823 791,397 962
1,015 931,498 918
3,745 3,999,015 1,068 7,091 2,680,838 378 9,316 6848,503 735 10,051 8,725,723 868
531 878,835 1,655 655 684,060 1,044 693 863,049 1,245 1,168 776,924 655 1,243 584,847 470 1,355 445,372 329 1,770 641,335 362 2,214 1,936,252 875 3,425 1,382,235 404 9,929 3,198,037 322 10,214 2,203,654 216
a Two health units pertaining to the Specral Publrc Health Service (see Annex 1). those of Curumuru and Slo Miguel dos Macacos in Breves
(Pad State), were not included here because they had only been in existence a short time and their services were still beutg establrshed.
b The average free market exchange rate rn 1982 was 1 dollar (US) = 279 cruzerros.
FIGURE 1. Average costs of vaccination versus the number of vaccinations administered at the health units of one institutfon, the Special Public Health Service (SESP), in the study municipalities of Pernam- buco State, 1982.
0 Palmares Rrberrb
200 - Jos’a Manano l
I I I I I I 1 I I I
1,000 2,000 3,000 4,000 5,000 6,000 7,000 6,000 9,000 10.000
TABLE 3. Unit costs of vaccination in routine programs of the Pati health units studied-by type of vaccine and age of recipients (< 1 year or all ages) in cruzeiros (1982).”
Pera mumcipetff and heskh unit
Type of
units Polio
Cost of administering vaccines of indicated types
to recipients of indicated ages:
< 1 year old All ages
Measles DPT BCG Polio Measles DPT BCG
Recipient cost
of obtaining
each vaccination Polio
Total cost per vaccination
for recipients ~1 year old
Measles DPT BCG
Sraganca: Braganca Bacurffena
Gesse Guimer%s
Tracuetena Vila Fatima Breves:
Breves Curumu
s;io Migueldos Macecos Capanema: Capsnema Mirasselvas Tauari Parteli Porte1
Rondon do Park
Rondon do Para
Santa Isabel do Pera:
Santalsabeldo Per&
American0
S&I Caotano de Odiiolas:
SaoCaetano de Odbelas
DeoNndia Guarajuba Marabrtanas
RIO aranco
%oJ~odaPonte ShoJtio dos Remos Vila Nova
HP HP HP
244 959 850
4,115 1,675 1,141
591 1,169 954
637 1,201 1,616
1,233 14,039 2,843
841 1,667 662
179 554 532
2,014 634 613
212 646 627
273 a31 ail
317 1,021 1,002
535 615 631
303 547 1,262 1,153
303 4,418 1,978 1,444
303 a94 1,472 1.257
303 940 1,504 1,919
303 1,536 14,342 3,146
1,144 1,970 965
M 6,219 2.043 1.867 3,187 3,648 1,008 992 994 125 6,344 2.168 1,992 3,312
HP 1,264 15,329 3,150 10,425 347 1,052 1,031 1,035 125 1.369 15,454 3,275 10,550
HP 1,104 4,556 3,481 4,430 330 1,139 1,116 1,120 125 1.229 4.681 3,606 4,555
HC 503 1,540 1,649 1,605 389 1.181 1.178 1.120 438 941 1,978 2,087 2,043
HP 1.141 2,374 3.487 3,005 517 1.554 1,543 1.547 438 1,579 2,812 3,925 3,443
HP 971 2,368 2,761 3,696 488 1,426 1,460 1,462 438 1,409 2,806 3,199 4,134
M 469 I.584 556 2,603 321 977 366 959 139 608 1,723 695 2,742
HC 906 3,061 2,581 2,413 548 1,652 1,637 1,639 357 1,263 3,418 2,938 2,770
HC 226 846 799 612 172 532 510 514 301 527 1,147 1,100 913
HC 4,256 20,960 13,191 27,257 2,401 7,452 7,441 7,434 301 4,559 21,261 13,492 27,558
HC 1,402
HP 400
HP 0
HP 11,904
HP 5.117
HP 566
HP 10,162
HP 151
3.586 4,050 - 29.727 25,619 557 - 4,338 2,662 1,463 25,188 28,163 1,367
1,722 1,706 1,706
at0 826 a29
507 502 505
5,945 5,927 5,928
10,248 10,241 10,231
433 408 412
3.680 4,144 - 29,821 25,713 651 - 4,432 2,756 1,557 25,262 28,257 1,461 122,130
720 1,475
2,456 571
2,383 200
1,242 0
5,928 1,984
10,231 3,655
890 142
20,359 6,788
555 113
1,496 494 94 11,998 5,211 662
288 20,355 267 20,359 271 94 94 10,276 245 at4 122,224 1,569
2,550 2.477 1,336 6,022 10,325 20,:: 649
a Theaveragefree market exchange r&in 1982was 1 doflar(tJS) = 279 cruzeiros.
b M = mixed unit; HC = heafthcenter; HP = health post,
N
IQ
E PAHO Bdletin 22(j), 1988
TABLE 4. Unif costs of vaccination in routine programs of the Fernambuco health units studied-by type of vaccine and age of recipients (< 1 year or all ages) in cruzeiros (1982).”
Pemembucomunicipefff
and heafth unit
Type Of unrtb poll0
Costofadministenng vaccines of indicated types
to recipients of Indicated ages:
c 1 year old All ages
Measles DPT BCG Polio Measles DPT
Recipient cost Totelcostpervaccinstion
of obtaining fof recipients <I year old
BCG each vaccinabon Polio Measles DPT BCG
cork cores Usina Pedrosa Esoeda:
Hospital NosseSenhom da Esceda
Usrna B&odeSuassuna
Case de Seude Maria Dias Lens (Usrna Uniao)
Frecherras
Usrna Masseuassu
Joequim Nabuco:
Josqurm Nabuco
Usrna Pumety
lagoa dos Getos:
Entroncemento lgarapeasso LagoedoSouze
Lagos dos Gates
Palmares: PalmareS
Newton Cerneiro
Santo Antonio dos Palmares
Serro Azul Ribeirao: RIberr.% Anprbu Estreliana Jose Manano Rio Formoso:
RIO Formosa
SaUB
Tamandare Usrna &ah ShoJo?io:
S?oJmo
HC 158 694 409 504 69 222 201 205 152 310 a46 561 656
HP 331 1,337 1,063 840 147 452 432 432 152 483 1,489 1,215 992
M 136 331 423
HP 486 2.723 1,399
HP 379 1,096 1,024
HP 421 1,295 1,655
HP 443 1,461 1,493
376 69 ia7 167
176 545 520
179 548 529
332 1,007 995
229 703 680
170 95 231 426 518
95 581 2.618 1,494
95 474 I.191 1,119
95 516 1.390 1,750
95 538 1.556 1,588
471
HC 258 70 931 1,441 171
HP 1,440 2.511 2,008 3,364 a38 504 508
240 498 310 1,171 1,681
836 686 240 1.680 2,751 2.246 3,604
HP 626
HP 439
HP 1,142
HP 449
6,892 4,096 6.028 3,523
10,806 464 375 621 312 1,378 1,123 1,859 923 1,380 1.897
2,674 1,138 1,888
166 792
166 605
166 1.308
166 615
2,063 2.840
9,072 926
7,058 4,262 6,194 3,669 10,972 9.238
M 176 698 613
HP 308 1,129 1,122
HP 960 4,361 3.090
HP 917 6,300 3.610
492
3,060 9,892
131 403 383 386 317 493 1,015 930
211 646 623 625 317 625 1,446 1,439
539 1,620 1,599 1.602 317 1,277 4,678 3.407
693 2,100 2,084 2.088 317 1,234 6,617 3,927
809
3,377 10.209
HC 155 532 466 561 100 313 291 295 81 236 613 547 642
HP 386 1,218 a87 2,239 188 576 554 559 61 467 1,299 968 2,320
HP 762 2,639 2,362 1,749 494 1,501 1,472 1,476 al 843 2,720 2,443 I.830
HP 266 1,044 872 1,675 160 495 472 476 ai 347 1,125 953 1,756
H 191
HP 258
HP 269
HP 315
673 1,133 1,230 587 1,512 777 981 aa3 1,257 97 559 117 163 303 366 501 283 765 344 644 288 479 43 43 43 43 354 234 301 312 358 716 1,176 1,273 630 1,555 820 1.024 926
HC 648 2.786 1,435 1,535 380 1.152 1,129 1,132 1,002 3.140 1,769
1.300
I.889
aTheaveregefreernerket exchange r&in 1982was 1 dotfar = 279 cruzeiros.
users can receive other services, in addi- tion to vaccinations, during a single visit. This obviously contributes to drawing us- ers away from the more basic units, low- ering the latter’s output.
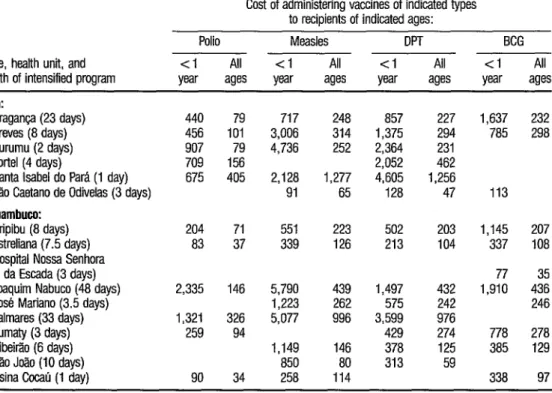
Intensified services. Providing inten- sified vaccination services involves shift- ing some health unit personnel of a given municipality to that municipality’s mar- ginal urban or rural areas. The main cost components here are personnel, vac- cines, other materials, and transporta- tion (vehicles and fuel). As Table 5 indi- cates, the average costs of vaccinations tended to be quite uniform (generally on the order of 200 cruzeiros) except at cer- tain units such as Santa Isabel do Para and Palmares that were at the two ex-
tremes in terms of program duration (one and 3 3 days, respectively). This sug- gests that in the first case there may not have been enough time to provide a sat- isfactory number of vaccinations, while in the second the time dedicated to in- tensified program activities may have been excessive relative to the target pop- ulation’s size. Such higher costs could also have been linked to the manner in which availability of the intensified ser- vices was publicized in the target com- munities .
TABLE 5. Unit costs of vaccination in the intensified programs carried out by 18 of the Par5 and Fernambuco health units studied-by the type of vaccine, the age groups vaccinated (cl year or all ages), and the health units involved, in cruzeiros (1982): Note that the costs to recipients in the intensified pmgrams were not considered significant.
State, health unit, and length of intensified program
Cost of administering vaccines of indicated types to recipients of indicated ages:
Polio Measles DPT BCG <I All < 1 All <I All <l All w ages year ages wr ages year ages
PA:
Braganca (23 days) Breves (8 days) Curumu (2 days) Porte1 (4 days)
Santa Isabel do Pam (1 day) Sao Caetano de Odiielas (3 days)
Fernambuw:
Aripibu (8 days) Estreliana (7.5 days) Hospital Now Senhora
da Escada (3 days) Joaquim Nabuco (48 days) Jose Mariano (3.5 days) Palmares (33 days) Pumaty (3 days) Ribeitio (6 days) So Joao (10 days)
Usina Cocau (1 day)
440 79 456 101 907 79 709 156 675 405
717 248 3,006 314 4,736 252 2,128 1,277 91 65
857 227 1,375 294 2,364 231 2,052 462 4,605 1,256 128 47
204 71 551 223 502 203 83 37 339 126 213 104
2,335 146 1,321 326 259 94
5,790 439 1,223 262 5,077 996
90 34
1,149 146 850 80 258 114
1,497 432 575 242 3,599 976 429 274 378 125 313 59
1,637 232 785 298
113
1,145 207 337 108 77 35 1,910 436 246 778 278 385 129 338 97
Campaign activities. Total costs of the campaign varied a good deal from one municipality to the next. Because many of the actual costs were social costs (including volunteer work, donations, and so forth), these variations were due largely to differing degrees of public mo- bilization in the different communities studied.
Regarding elements contrib- uting to the campaign’s vaccination costs, publicity was significant, account- ing for 5.8 % of the total cost in the Par-5 municipalities and 10.8% in the Pernambuco municipalities. Likewise, transportation (9.7 % of the total cost in the Par% municipalities, 8.2% in the Pernambuco municipalities) was an ex- pensive element because of the need to move human and material resources to health posts in the interior.
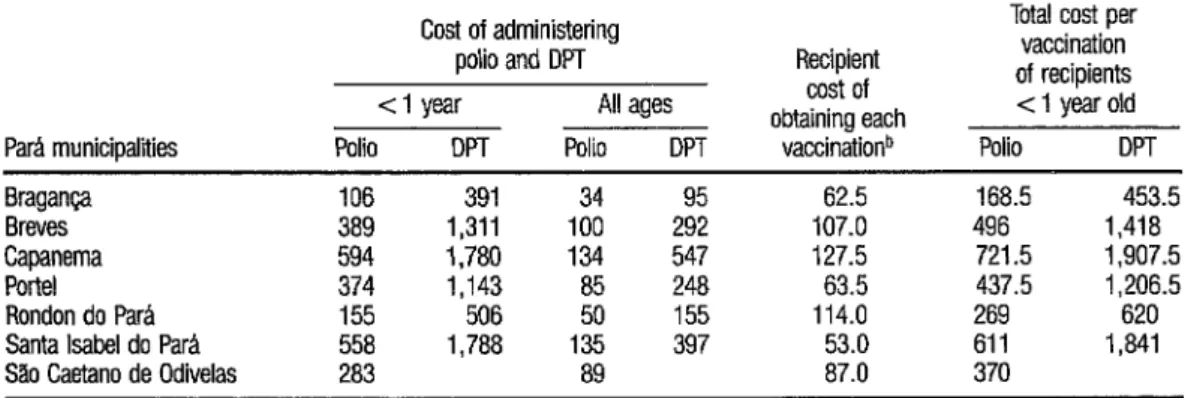
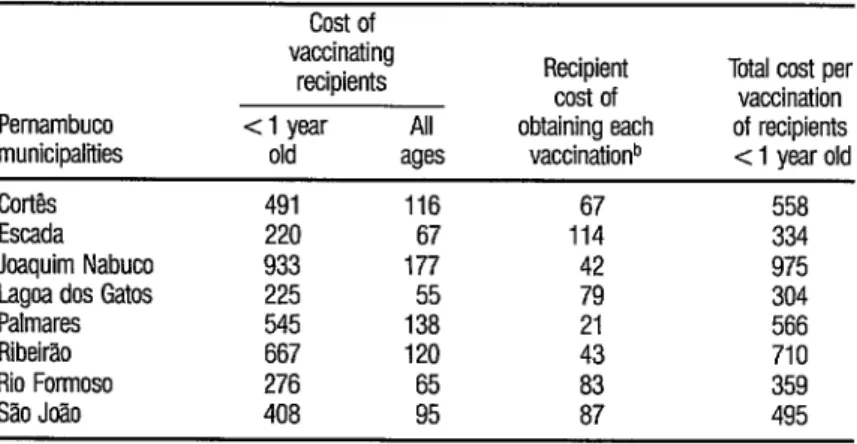
Overall, the cost of providing polio vaccinations to children under one year old were relatively low compared to the costs recorded for the routine and in- tensified programs, ranging from 106 to
594 cruzeiros in Para and from 220 to 933 cruzeiros in Pernambuco (Tables 6 and 7). However, the polio campaign’s goal in Brazil was to vaccinate all chil- dren under four years of age; and, in this context, it should be noted that the cam- paign cost of providing vaccinations to all children under one year old (without considering vaccination of other age groups) would be considerably higher than the campaign costs reported here.
Inter-Strategy Analysis
It would be incorrect to ana- lyze the three strategies independently of one another, since both the intensified and campaign strategies depended heav- ily upon the support structure provided by the futed units conducting the routine program. The issues in question are (a) whether the complementary strategies (the intensified efforts and the cam- paign) pay off in terms of cost-effective- ness, and (b) given these considerations, what is the best combination of strate- gies.
Cost. Tables 3 and 4 show the routine program costs of providing each vaccina- tion (including the costs of the health
TABLE 6. Unit costs of vaccination in the Par6 polio and DPT campaign (second doses)-by age group and municipality, in cruzeiros (1962).”
ParA municipalities
Cost of administering polio and DPT cl year All ages Polio DPT Polio DPT
Recipient cost of obtaining each
vaccinationb
Total cost per vaccination of recipients c 1 year old Polio DPT Bragan@ 106 391 34 62.5 168.5 453.5 Breves 389 1,311 100 107.0 496 1,418 Capanema 594 1,780 134 547 127.5 721.5 1,907.5 Porte1 374 1,143 85 248 63.5 437.5 I,2065 Rondon do ParA 155 506 50 155 114.0 269 620 Santa Isabel do Para 558 1,788 135 397 53.0 611 1,841 Silo Caetano de Odiielas 283 89 87.0 370
a The average free market exchange rate in 1982 was 1 dollar (US) = 279 crmiros.
TABLE 7. Unit costs of vaccination in the Pernambuco polio campaign (second dose)-by age group and municipality, in cruzeiros (19FQa
Pernambuco municipalities
cost of vaccinating
recipients Recipient cost of Total vaccination cost per <l year All obtaining each of recipients old ages vaccinationb < 1 year old
Cortb 491 116 67 558
Escada 220 67 114 334
Joaquim Nabuco 933 177 42 975
Lagos dos Gatos 225 55 79 304
Palmares 545 138 21 566
Ribeirao 667 120 43 710
Rio Formoso 276 65 83 359
Sao Jo2.0 408 95 87 495
p The average free market exchange rate in 1982 was 1 dollar (US) = 279 cruzeims.
b Weighted average of costs to users of rural and urban posts.
unit’s vaccination service and the appor- tioned costs of the other administrative levels providing coordination and super- vision). In addition, they show the esti- mated costs to users of obtaining each vaccination (essentially the cost of trans- portation and lost parental work time).
In general, the estimated costs to users were less for vaccination through the campaign or intensified program than they were for vaccination through the routine program. In the case of the campaign, this was due largely to the many field posts established, which re- duced the distances people had to travel. In the case of intensified vaccination, it was because the costs to users were not considered-the vaccination effort being geared mainly to workers in the sugar in- dustry (and being implemented at the sugar mills) and to small peripheral pop- ulations in outlying areas where vaccina- tion posts were set up in easily accessible locales.
Data provided on the cost per vaccination of children under one year old (see the right-hand columns of Tables 3 through 7) indicate that so far as the study samples are concerned, the cam- paign was the strategy with the lowest av- erage unit vaccination costs in both states. In ParB State, the average costs of a vaccination administered through the campaign, the intensified program, and the routine program were 439, 637, and 2,5 50 cruzeiros, respectively. In Pernam- buco State, the respective average costs were 538, 983, and 629 cruzeiros, the cost difference between the campaign and the routine program being less sig- n&cant.
Also, the campaign vaccina- tion costs were not so low as they appear. That is, if the campaign vaccinations of children who had already received three doses of polio vaccine through the rou- tine program were not considered, then the costs per effective dose of vaccine ad- ministered by the campaign strategy would be higher than those shown.
Coverage. The campaign provided the greatest vaccine coverage, apparently reaching 100% in all the study munici-
palities except Breves and Porte1 in Pari State. (These two municipalities have hard-to-reach populations dispersed in large rural areas with difficult access by water.) These high rates of coverage (100%) suggest that the child popula- tion of the municipalities was probably underestimated.
Coverage achieved through routine vaccination (see Table 1) was gen- erally greater for BCG than for measles vaccine, the third dose of polio vaccine, or the third dose of DPT vaccine. This is probably because multiple vaccinations were not needed for BCG and the vac- cine could be administered during the child’s first month, when the mother’s ongoing contact with the health unit was relatively strong. The coverage achieved by routine vaccination was very poor at the health posts of the interior that only offered vaccinations once a month. For 3 example, at Sno Caetano de Odivelas 2 municipality, routine coverage was
. 3
17.5 % for poliomyelitis vaccination, cu -4 11.9% for measles, and 16.8% for DPT $$ Coverage was also poor at health posts
QJ that served municipalities with large * 3 areas or dispersed populations that travel : by river (for example, Porte1 in Pad
262
State). Nonetheless, in some municipali- ties (such as Ribeirao and Santa Isabel do Pa&) the routine program achieved results that could be compared to those of the campaign, and that appeared al- most as good if combined with the results of the intensified program.
Resource allocation. The strategies can also be compared in terms of the way resources earmarked for them were used. For example, it was found that only 27 %
of the campaign’s vaccinations in Para and 24.4 % of those in Pernambuco were administered to individuals in the prior- ity (under one year) age group. In a sense this is wasteful, even considering the im- portance of propagating of the vaccine virus in the community as a whole (in the case of Sabin vaccine). In the case of DPT vaccine, where the issue of propagation does not come into play, the problem is more pronounced.
In a similar vein, vaccinations administered through the intensified ef- forts appear to have been administered indiscriminately to children up to four years old. By comparison, the routine program distributed its vaccinations more rationally, giving 59.7% in ParP and 5 1.4% in Pernambuco to children under one year old. Nonetheless, there was no opportunity for these percentages to approach 100%) given the large num- ber of children who had passed the age of one year without being vaccinated.
C
ONCLUSIONS AND
RECOMMENDATIONS
plied in every context. Nevertheless, the results obtained suggest certain general patterns of economic behavior in the areas involved that permit a number of conclusions.
To begin with, the campaign proved effective at producing a short- term increase in vaccination coverage in the two Brazilian states studied. With few exceptions, coverage was excellent and vaccination costs were low. It should be recalled, however, that in some study municipalities the results attained by the routine program were quite similar to those of the campaign, especially when they are considered in combination with the results of intensified programs offer- ing vaccination services at designated times.
The feasibility of maintaining the level of community mobilization that the campaign achieved in its first years for several more years should also be considered. It is possible that if this strategy is repeated annually, it will be- come regarded as routine and will lose some of its ability to elicit the wide-rang- ing social support that its exceptional character has generated to date.
In addition, the campaign strategy seems less applicable to some kinds of vaccinations. For example, some antigens such as BCG are more difficult to administer, thus requiring specialized human resources and limiting the useful- ness of the massive voluntary labor force that Brazil’s polio campaign enjoyed at the time of this study.
With a view to consolidating a network of satisfactory health services and confirming the positive experiences encountered in the routine programs of some study municipalities (in terms of both coverage and unit costs of vaccina- tion), it is felt that strengthening the routine services and supplementing them with intensified programs provid- ing vaccinations on designated days is a
viable option for increasing vaccination coverage at a unit cost not much greater than that of the campaign.
If such a course were fol- lowed, the response would not be lim- ited to the vaccination program. Rather, if the routine program were carried out with the sort of community involvement found in the campaign, it should lead to increased demand for the rest of the health services offered by the units’ other programs.
Along this line, the smaller health units have been found to operate with fured costs that are very high relative to their total costs and that increase the unit cost of vaccinations. It would thus be interesting to study additional ways of making use of their physical structures- endeavoring, for example, to use such structures to support programs for basic sanitation, health education, and other activities related to community health.
Furthermore, bearing in mind that most of the intensified services proved efficient, and that the main cur- rent functions of the health posts are to provide vaccinations and basic health ser- vices, it is recommended that the intensi- fication of services be stepped up in the interior of municipalities and on the pe- riphery of urban areas, rather than sim- ply increasing the number of fued posts providing routine services. To this end, the vaccination services offered on desig- nated days need to become an ongoing activity (no longer sporadic, as they are today in most units where they are of- fered), with a well-defined and well- structured annual work plan, and with services organized so that the peripheral populations are assured all the vaccine doses needed to fulfill the National Pro- gram on Immunization.
The success of such an under- taking will depend not only on technical planning, but also upon effective and profound interaction between health centers and the local communities they serve, upon a fostering of community awareness that community participation in the struggle against communicable diseases is important, and upon enlist- ment of community members as health promoters working with the health unit. Within this context, the National Pro- gram on Immunization would be able to facilitate sound structuring and dissemi- nation of the schedules and locales for vaccination on designated days in a man- ner calculated to achieve desirable results.
If the trend found in this study is confirmed, i.e., if relatively greater vaccination cost-efficiency occurs at the health centers than at the health posts, it is recommended that the health center’s activities be strengthened, so as to render its vaccination services more dy- namic. In that way, in combination with the posts providing basic care, it would be possible to develop a program of rou- tine vaccination and vaccination on des- ignated days aimed at the populations of marginal urban and rural areas. Health posts in the interior would also partici- pate in vaccination activities on desig- nated days, and could become local poles for health education activities-serving % small population centers and increasing 2 the degree of interaction between health
units and communities. s
2 Unfortunately, the multiplic- .g ity of Brazilian institutions providing 9) health services has proved an obstacle to Q ;t structured development and organiza- 2 tional integrity of such a multi-tiered sys- 3
tern. Also, Brazil still has no official sys- tern for estimating its population, especially in small population centers. Developing this is particularly impor- 264 tam, as such estimates are fundamental
to sound development of public health activities (including vaccination pro- grams), for which it is important to know the size of the target population. The study data in Table 1 showing campaign- related coverages consistently exceeding
100% reflects the fact that the current situation leaves much to be desired.
Finally, it should be empha- sized that this study analyzed implemen- tation of the EPI in just two Brazilian states, and so it should be regarded more as an experimental exercise than as an in- vestigation permitting firm generaliza- tions. Research efforts of this nature can be useful as planning instruments at the local level, and possibly the state level; but it is important to avoid their indis- criminate application outside the study regions, especially in countries like Brazil with great regional diversity.
A
CKNOWLEDGMENTS
The author would like to ex- press her thanks to the National Secretar- iat for Basic Actions of the Ministry of Health, the Drug Supply Center of the Ministry of Social Security and Welfare, and the secretariats of health of the states of Pernambuco and Par& institutions that collaborated with this study and fa- cilitated data-gathering.
S
UMMARY
routine programs conducted at estab- lished health units, through intensified short-term efforts, and through annual mass campaigns. To assess how well these various strategies were working locally and to weigh their cost-effectiveness, a study was conducted of 55 health units in the states of Par-5 and Pernambuco. Forty of these units were health posts, 10 were health centers, four were mixed units with inpatient facilities, and one was a hospital.
The analytical method used was the cost-effectiveness method de- scribed in a WHO document entitled “Expanded Program on Immunization: Costing Guidelines.” In general, the costs estimated were made to include not only the cost to the specific unit involved but also costs at higher administrative levels, costs to the families of vaccine re- cipients, and the social costs of unpaid volunteer labor, donations, and so forth. Effectiveness was rated in terms of the number of children under one year old who were vaccinated.
In general, fuced costs (of buildings, vehicles, and administrative personnel) were found to be quite high in the routine services, accounting for 48% of the health units’ total vaccina- tion costs in Para and 35 % in Pernam- buco. Comparing units operating under the same institution (the Public Health Services Foundation), it was found that the average cost per vaccination in Pernambuco tended to decrease as the number of vaccinations increased-sug- gesting that most units were operating far below their most productive capacity. (This trend was less clear-cut in Par5 be- cause of complicating factors.) Overall, throughout the Pernambuco study areas
and in most of the Par5 study areas, the larger units registered the lowest average costs per vaccination, due mainly to economies of scale.
Regarding the cost per vacci- nation of children under one year old, the mass campaign was found to cost less than either of the other two strategies in both Par6 and Pernambuco. It should be noted, however, that these were average costs, and that in some study areas (mainly in Pernambuco) the routine pro- gram was more cost-effective than the campaign. Also, some of the children vaccinated had already received three doses of the vaccine administered (polio or DPT), and so the campaign costs per effective dose of vaccine administered were higher than those shown.
Similarly, the campaign pro- vided the greatest coverage in the study areas-apparently providing 100 % cov- 2
erage in most places. But some munici- 3 palities achieved results that could be compared to the campaign results
5 through the routine program supple- E mented by intensified services. More-
over, only about a quarter of the cam- 5 E: paign vaccinations were administered to
children under one year old (the priority
2 Z; age group), while over half the routine
program vaccinations went to members is of this group. There could also be diffi- s culties in maintaining the level of com- munity mobilization the campaign at- z rained in its early years (including 1982), 2
once its annual occurrence comes to be g expected. And finally, the campaign
strategy appears less applicable to certain s . vaccines (such as BCG) that are harder to
administer, and so require more special- 3 ized personnel. D
Therefore, with a view to con- solidating a network of satisfactory health services, it is recommended that the routine services in the study area be strengthened and supplemented with in- tensified programs providing vaccina-
,$ 4
tions on designated days. Also, if it can be confirmed that relatively greater cost- effectiveness occurs at the larger centers, then it would seem advisable to strengthen health center activities so as to render their vaccination services more dy- namic. In that way, in combination with the health posts providing basic care, they could help to develop a program of routine and intensified vaccination aimed at the populations of marginal ur- ban and rural areas. It should be empha- sized, however, that the data presented here deal only with study areas in two states, and that they provide no ade- quate basis for drawing firm conclusions applicable in a general way to other places.
B
IBLIOGRAPHY
Abel-Smith, B. An International Study
of
Health Expenditure andIts Relevance for Health Plan- ning. WHO Public Health Papers, No. 32. World Health Organization, Geneva, 1967. Abel-Smith, B. Paying for Health Services: AStudy
of
the Costs and Sourcex of Finance in Sti Co2cntries. WHO Public Health Papers, No. 17. World Health Organization, Geneva, 1963.Barnum, H. N., D. Tarantola, and I. E Setiady. Cost-effectiveness of an immunization pro- gramme in Indonesia. Bzd,! IYHO 58(3):499- 2
503, 1980. o\
Y Brazil, Ministry of Health. Programa National de .
3
Imuniza@es (unpublished document). Bras- ilia, 1975.
cu ru
.j$ Brazil, Ministry of Health. 0 controle da po- u liomielite no Brasil Presentation by the Minis- a
4
try of Health to the Chamber of Deputies. Brasilia, 1980.
Brazil, Ministry of Health. Vigz%zcia epidemiob gica e imunizqoes: Legis/a@o b&ica. Brasilia,
1978,41 pp.
graphed document. World Health Organiza- tion, Geneva, 1979.
Creese, A., N. Sri abbaya,
x G. Casabal, and G. Wiseco. Cost-e ectiveness appraisal of immu- nization programmes. BuL WHO 60(4):621- 632, 1982.
Creese, A., and R. H. Henderson. Cost-benefit analysis and immunization programmes in de- veloping countries. Bz& I&HO 58(3):491-497, 1980.
Cruickshank, R., G. Edsall, J. deMeerloose, and V. N. Zhdanov. The Role of Immunization in Communicable Disease ControL. WHO Public Health Papers, No. 8. World Health Organiza- tion, Geneva, 1961, 118 pp.
Cullis, J., and l? West. The Economics of Heahh: An Introduction. New York University Press, New York, 1979.
Farhat, C. Fundamentos epr&ica das imunizapies em chzica m&&a e pediritrica, Livraria Athe- neu, SZO PauIo, 1981, 785 pp.
Funda@o Servifos de Saude Pdblica, Rio de Ja- neiro. Bd Epidemioll4( 3), 1982 (weeks 5 and 6).
Funda$o Servifos de Satide Pbblica, Rio de Ja- neiro. Bol EpidemioL 13(22-23), 1981 (weeks 22 and 23).
Funda@o Services de Satide Pbblica, Rio de Ja- neiro. Bol Epidemiol13(24-25), 1981, (weeks 47-50).
Funda@o Servisos de Saiide Piiblica, Rio de Ja- neiro. Bd Epidemiol 12( 16-17), 1980 (weeks
31 and 34).
Gonzalez, C. L. Mass Campa@ and General Health Services. WHO Publrc Health Pauers. No. 29. World Health Organization, Geneva; 1965, 87 pp.
Mishan, E. J. ELementos de anZ&e de custos- beneficioos. Zahar Editores, Rio de Janeiro, 1975, 203 pp.
Pan American Health Organization. Health for
All by the yea7 2000: Strategies. PAHO Off% cial Document 173. Washington, D.C., 1981. Ribeiro, P. A., M. J. Ferreira, and E. Braga. Eco- nomic Value of Health. Serviso Especial de Saude Publica, Rio de Janeiro, 1952, 125 pp. Creese, A. Expanded Programme on Immuniza-
Sorkin, A. Health Economics. Lexington Books, Lexington, 1975.
World Health Organization. ALma-Ata lgi’8: Pri- mury Health Care. Geneva, 1978, 79 pp. World Health Organization. L’hahation despro-
grammeJ de sad; pri+bes directeurs. Ge- neva, 1981, 49 pp.
World Health Or tween Heah a
anization. Interre/ationshz)s be- Programmes and Socio-Eco- nomic Development. WHO Public Health Pa- pers, No. 49. Geneva, 1973, 54 pp.
World Health Organization. Health Economics. WHO Public Health Papers, No. 64, Geneva, 1975, 44 pp.
ANNEX 1. The health units in the states of Par2 and Fernambuco that were included in the study.
State, municipality, and health unit Supporting institution Type of health unit I. Para State municipalities and units:
Braganw:
Braganca Bacuriteua Caratateua Gesse Guimames Tracuateua Vila de Broca Vila Fatima
Breves:
Breves Curumu
Sao Miguel dos Macacos
Capanema:
Capanema Mirasselvas Tauari POIICI:
Porte1
Rondon do Park Rondon do Para
Santa Isabel do Park
Santa Isabel do Para Americano Caraparlj Conceiflo do ha Jundiai Tacajds
Slo Ceetano de Odiieles:
Sb Caetano de Odivelas Beolandia
Guarajuba Marahianas Rio Branco S3.o Jo?to da Ponta Sao Jo20 dos Ramos Vita Nova
SESPAa SESPA SESPA SESPA SESPA SESPA SESPA
SESPb SESP SESP
SESP SESP SESP
SESPA
SESP
SESP SESPA SESPA SESPA SESPA SESPA
SESPA SESPA SESPA SESPA SESPA SESPA SESPA SESPA
Health center Heaith post Health post Health post Health post Health post
Health post 2 3 Mixed unit E
Health post
Health post if?
Heaith center z R Health post
Health post g
Mixed unit iis
Heaith center 8 2 Health center s! Health center s Health post
Health post E Health post . Heaith post
ANNEX 1. (continued)
State, municipalii, and health unit Supporting institution Type of health unit II. Pernarnbuco State municipalities
and units: coll?!s:
cork
Usina Pedrosa
Escada:
Hospital Nossa Senhora da Escada Usina Barao de Suassuna
Casa de Saude Maria Dias Lins (Usina Uniao)
Frecheiras Usina Massauassu
Joaquim Nabuco:
Joaquim Nabuco Usina de Pumaty Lagos des Gates:
Entroncamento lgarapeassir Lagoa do Souza Lagos dos Gatos
Palmares:
Palmares Newton Carneiro
Santo Antbnio dos Palmares Serro Azul
Ribeir30:
Ribeirao Aripiblj Estreliana Jose Mariano
Rio Formoso:
Hospital do Rio Fomroso
%
2 -
Saue 32 Tamandare Usina CocaC
g lo Jtio:
-c! 3.0 Joao
FUSAMC Health center FUSAM Health post FUSAM
FUSAM and
Barao de Suassuna Sugar Mill
FUSAM and Uniao Sugar Mill FUSAM FUSAM and
Massauassti Sugar Mill
Mixed unit Health post
Health post Health post Health post
SESP
SESP Health Health center post FUSAM
FUSAM FUSAM FUSAM
Heaith post Health post Health post Health post SESP
SESP SESP SESP SESP SESP SESP SESP
Rio Formoso League for the Protection of Maternity and Children FUSAM and Santo
Andre Sugar Mill Rio Formoso municipal
government Rio Formoso municipal
government and Cocali Sugar Mill
Mixed unit Health post Health post Health post Health center Health post Health post Health post Hospital
Health post Health post Health post
SESP Health center
268
a Secretariat of Health for the State of ParA (Secretaria de Salide do Estado do Park).
b Public Health Services Foundation (Funda@ ServiCos de Salide Wblica).
c Secretariat of Health for the Slate of Pemambuco, Amaury de Madeiros Health Foundation (Secretaria de Satide do