Topographic aspects of photic driving in
the electroencephalogram of children
and adolescents
1Laboratório de Neurobiologia e Neurofisiologia Clínica, Setor de Neurologia,
Instituto Fernandes Figueira, Fundação Oswaldo Cruz, Rio de Janeiro, RJ, Brasil
2Programa de Engenharia Biomédica (COPPE), Centro de Tecnologia,
Universidade Federal do Rio de Janeiro, Rio de Janeiro, RJ, Brasil V.V. Lazarev1,
A.F.C. Infantosi2,
D. Valencio-de-Campos2
and L.C. deAzevedo1
Abstract
The electroencephalogram amplitude spectra at 11 fixed frequencies of intermittent photic stimulation of 3 to 24 Hz were combined into driving “profiles” for 14 scalp points in 8 male and 7 female normal subjects aged 9 to 17 years. The driving response varied over fre-quency and was detected in 70 to 100% of cases in the occipital areas (maximum) and in 27 to 77% of cases in the frontal areas (minimum) using as a criterion peak amplitude 20% higher than those of the neighbors. Each subject responded, on average, to 9.7 ± 1.15 intermit-tent photic stimulation frequencies in the right occipital area and to 6.8 ± 1.97 frequencies in the right frontal area. Most of the driving responses (in relation to the previous background) were significant according to the spectral F-test (α = 0.05), which also detected changes in some cases of low amplitude responses not revealed by the peak criterion. The profileshad two maxima in the alpha and theta bands in all leads. The latter was not present in the background spectra in the posterior areas and was less pronounced in the anterior ones. The weight of the profile theta maximum increased towards the frontal areas where the two maxima were similar, while the profile amplitudes decreased. The profiles repeated the shape of the background spectra, except for the theta band. The interhemispheric correlation between profiles was high. The theta driving detected in all areas recorded suggests a generalized influence of the theta generators in prepubertal and pubertal subjects.
Correspondence
V.V. Lazarev
Laboratório de Neurobiologia e Neurofisiologia Clínica Instituto Fernandes Figueira FIOCRUZ
Av. Rui Barbosa, 716 22250-020 Rio de Janeiro, RJ Brasil
Fax: +55-21-2551-0547 E-mail: [email protected]
Received April 27, 2003 Accepted March 22, 2004
Key words
•Electroencephalogram
•Intermittent photic stimulation
•Photic driving
•Brain topography
•Children
•Adolescents
Introduction
The driving response to intermittent photic stimulation (IPS) is an important functional test used in electroencephalography (EEG) in order to enhance the manifestation of the latent sources of rhythmic bioelectrical ac-tivity including its pathological forms (1,2). In previous communication, we investigated
IPS across the EEG frequency range. These profiles proved to repeat the shape of the background spectra with high Pearson corre-lation coefficients between them, both hav-ing the maximum peaks in the alpha fre-quency band. However, in the profiles of children and adolescents, the second maxi-mum driving response was detected in the theta band, not present in the background EEG spectra and not described in the litera-ture on the driving reaction in adults. This heightened theta responsiveness was con-sidered to be peculiar for the age group studied. In comparison with the spectrum of the resting EEG, the driving profile sug-gested the possibility to provide a fuller rep-resentation of the set of potential oscillators. The aforementioned results were de-scribed for the right occipital region (3) gen-erally considered representative for the study of the EEG effects of visual stimulation (4-6). However, there is much supporting evi-dence in the literature for the thesis that the driving response may be observed in other cortical regions as well. Furthermore, the regional specificity may be very important in clinical and psychophysiological diagnosis, especially with respect to local alterations in the functional state of the brain.
First of all, this concerns hemispheric specificity. Various types of interhemispheric differences in the EEG driving reaction were observed in adult subjects and patients (7-9) and it was shown that IPS may emphasize the functional asymmetry (10). It has even been proposed that in certain cases the sensi-tivity of the left and right hemispheres to IPS may differ in relation to high and low stimu-lation frequencies (11).
Clinical research has shown that the in-terhemispheric relationships between the harmonic components of the responses to IPS might be of importance in topographic diagnosis (12,13). The asymmetric driving effects such as a locally increased rhythmic response at the delta or beta frequencies as well as a reduced or a disproportionately
strong response within the alpha-band may indicate a focal disturbance and should be taken into account as indicators of a func-tional alteration (14). Cortical lesions of a destructive type may cause ipsilateral de-pression or attenuation of driving, whereas irritative lesions, such as those of epileptic scars, may lead to an increased response on the side of the focus (15,16). In paranoid schizophrenia, an increased interhemispheric (17) and decreased intrahemispheric coher-ence (18) was observed during IPS, reveal-ing, according to the authors, a less lateral-ized cerebral organization than in normal subjects and a more diffuse, undifferentiated functional organization within the hemi-spheres. Asymmetrical effects of driving re-actions have also been utilized in research on the pathology of the visual field (1).
different from those activated in non-parox-ysmal driving. For this reason, the latter were associated with an inhibition of epilep-tic discharges (24).
Thus, the topographic aspect of photic driving looks promising for the study of the regional specificity of the functional state of the brain and its pathological alterations. Some approaches to quantitative EEG topo-graphic mapping may be used in the study of the complex spatial patterns of this phenom-enon (25). However, all the aforementioned data concern adult subjects. In our prelimi-nary examination of several children and adolescents suffering from migraine (26), we detected a low spatial consistency in peak frequencies and a decreased interhemi-spheric correlation of the photic driving pro-files by the methodology detailed in the pre-vious communication (3). Thus, the study of the photic driving topography in normal sub-jects of this age group is very important as a normative basis for clinical studies. How-ever, the weaker response with the lower amplitude in the regions anterior to the oc-cipital visual areas is usually one of the reasons for the latter to be an almost exclu-sive point of the examination of the driving responses (4-6).
The objective of the present study was to indicate with computerized criteria the pres-ence of the photic driving responses in vari-ous brain areas, to assess the sensitivity and physiological significance of these indica-tors and to compare the driving profiles in different regions in order to reveal the nor-mal topography of the potential latent oscil-lators not present in the resting EEG and characteristic for the age group studied.
Material and Methods
The topography of the driving responses was investigated in the same 8 male and 7 female volunteers, between 9 and 17 years of age with a median age of 13.3, who were described in the previous communication
(3). None was overtly left-handed (accord-ing to the writ(accord-ing hand and the reports of the parents) and none had a history of neurologi-cal, psychiatric or drug-related illness. The local Ethics Committee approved this re-search and the subjects or persons respon-sible gave informed consent to participate in the study.
EEG signals were recorded during a state of relaxed wakefulness (initial background, 2-3-min duration), during IPS of various frequencies and during wakefulness between stimulations at different frequencies. The eyes of the subjects were closed throughout the experiment. Each presentation of a fixed frequency lasted 20-30 s, with the same peri-ods between stimulations. One series of stimulations consisted of the following flicker frequencies: 3, 4, 5, 6, 8, 10, 12, 15, 18, 21, and 24 Hz.
The EEG was recorded with an 18-chan-nel Nihon Kohden polygraph (EEG-4418), at 14 scalp points, according to the Interna-tional 10/20 System, with unilateral refer-ences to the corresponding earlobes. These points were located over the following areas of the left (odd index) and right (even index) hemispheres: occipital (O1, O2), parietal (P3, P4), central (C3, C4), frontal (F3, F4), poste-rior temporal (T5, T6), mid-temporal (T3, T4), and anterior temporal (F7, F8). The recording characteristics were: 0.3-s time constant, 70-Hz high frequency filter and 15-µV/mm sensitivity. The EEG signals were recorded on magnetic tape with a TEAC XR-7000 tape recorder (Tokyo, Japan) with simultaneous paper recording, after digitali-zation with an A/D converter (12-bit preci-sion) at a sampling frequency of 256 Hz. The instants of stimulation were also ac-quired to be used as reference when applying the signal processing techniques. In order to avoid the possible short post-stimulation ef-fect (27), the first 5 s after each stimulation were excluded from analysis.
sec-tioned into M = 10 epochs of equal duration (2 s). Then, the spectra were estimated and the spectral F-test (SFT) was applied. The power spectrum was estimated using the modified periodogram of Bartlett based on the Discrete Fourier Transform of the 2-s duration epochs, resulting in a frequency resolution of 0.5 Hz. For each lead, the trum was represented as an amplitude spec-trum (i.e., the square root of the absolute power) and the presence of the driving re-sponse at the frequency of stimulation was ascertained by in-house software as an am-plitude peak which was at least 20% higher than the amplitudes at adjacent frequencies (± 1 Hz). In computer simulation, this level of prevalence gave a false-positive rate of less than 5% when the spectrum of signals was white, i.e., when there was no response to the stimuli (3). Henceforth, this will be referred to as “the 20% criterion”.
The SFT was calculated as the ratio of the power spectra obtained from the EEG during and before stimulation (28). Knowing that in the absence of spectral change the ratio of averaged periodograms follows an F-distri-bution, the null hypothesis (H0) of the ab-sence of response can be tested (29). Thus, the critical value was determined as SFTcrit = 2.12 for a level of significance of α = 5% and the SFT at any frequency was compared to this value. If SFT(f) <SFTcrit, the absence of response in the frequency f was accepted, but if SFT(f) ≥SFTcrit, H0 was rejected.
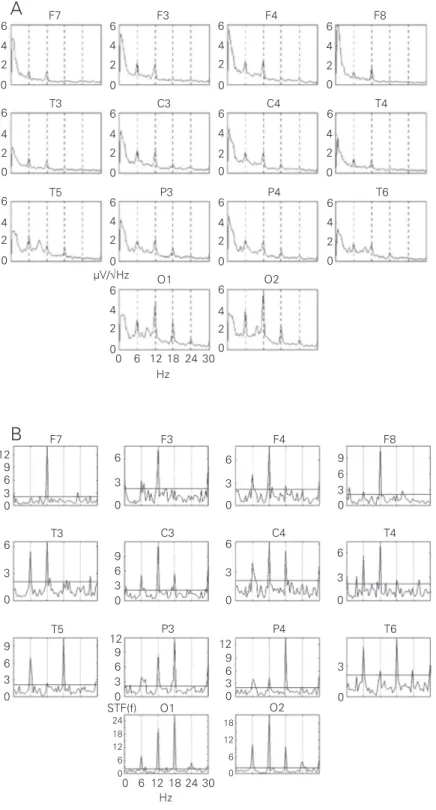
The results of the spectral analysis were presented for each subject as 14 spectro-grams plotted according to the electrode scalp position, as illustrated in Figure 1A. For each lead, the estimated spectrum is de-picted as an amplitude spectrum, i.e., the square root of the absolute power, with a frequency resolution of 0.5 Hz. The SFT values were also topographically plotted in the same way (Figure 1B). The frequency of stimulation and its harmonics were indicated by vertical lines (Figure 1).
The group data of the driving presence
Figure 1. An example of individual spectrograms (A) and spectral F-test value diagrams (B) (subject M) with a strong generalized driving response to 6-Hz intermittent photic stimula-tion in almost all the scalp points recorded (marked above each spectrum or diagram). Abscissas: frequency of EEG, in Hz. Vertical lines mark a frequency of stimulation and its harmonics, i.e., 6, 12, 18 Hz, etc., from left to right. Ordinates: A = amplitude spectra, in µV/ √Hz; B = spectral F-test values; horizontal line = critical value 2.12 for a level of significance α = 5%.
6 4 2 0 6 4 2 0 6 4 2 0 6 4 2 0 6 4 2 0 6 4 2 0 6 4 2 0 6 4 2 0 6 4 2 0 6 4 2 0 6 4 2 0 6 4 2 0 6 4 2 0 6 4 2 0 12 9 6 0 3 6 0 3 6 0 3 6 0 3 9 6 0 3 9 6 0 3 9 6 0 3 9 6 0 3 9 0 3
F7 F3 F4
0 6 12 18 24 30 Hz
F8
T5 P3 P4 T6
T3 C3 C4 T4
F7 F3 F4 F8
O1 O2
6
0 3
T3 C3 C4 T4
T5 P3 P4 T6
O1 O2
0 6 12 18 24 30
6 0 3 12 24 18 12 6 0 18 12 6 0 12 6 0 3
µV/√Hz
A
B
obtained by the 20% peak criterion and the SFT (α = 5%) at each fundamental frequency of stimulation (first harmonic) in each scalp lead were plotted as percent of subjects who responded to the given frequency of IPS at the given lead for the two different sche-matic scalp maps according to the electrode positions. The two maps were compared by subtraction of the values of the second map from those of the first one.
In order to compare the magnitude of the responses to all the frequencies of stimula-tion, amplitude spectra measured at all fre-quencies were plotted on the same diagram called “the frequency profile of the driving reaction” (or simply, “the profile”) (3).
The similarity of different profiles at dif-ferent scalp points was evaluated by the Pearson correlation coefficient (R). The sta-tistical significance of the differences be-tween profiles at each frequency was calcu-lated by the Wilcoxon test.
Results
The spectrograms of Figure 1A illustrate an example of a strong driving response to the IPS of 6 Hz in subject M. The figure shows the existence of peaks at the stimula-tion frequency and at some of its harmonics (12 and 18 Hz). In the occipital region, these peaks are more pronounced compared to those of other regions. One may see that the peak amplitudes decrease towards the fron-tal areas where the third harmonic of 18 Hz disappears. Furthermore, it is interesting to note that at 12 Hz (EEG frequency of the alpha band) the relative contribution was higher than at the stimulation frequency (see discussion of this effect in Ref. 3).
Figure 1B depicts the SFT of the 14 EEG leads for the same subject M at the same IPS of 6 Hz. Based on SFTcrit = 2.12 (indicated by the horizontal line), the null hypothesis of the absence of response was rejected (α = 5%) (false-positive rate), particularly for the frequency of stimulation and some of
its harmonics. For most of the other frequen-cies, H0 was accepted, that is, no response could be identified. Thus, one can say that in the central, parietal and occipital regions the presence of responses occurs at 6, 12 and 18 Hz. Furthermore, in the occipital regions there was also a response at 24 Hz while in the other ones no responses were identified at this frequency.
Comparing Figure 1A and B one can see that most of the driving responses recorded in all brain areas were detected by both spectral peak (the 20% criterion) and SFT. However, there were some cases of detec-tion of significant changes in the EEG by SFT against an absence of any visible peak in the spectrum, such as in F4, F8 and T4 at the frequency of 18 Hz. Sometimes, these cases did not relate to the harmonics of the IPS frequency, such as in T4 at 3.5 and 26 Hz, and could be rejected by an increase of the significance level to 2 or 1%. On the other hand, a spectral peak meeting the 20% criterion could not be confirmed by SFT, such as in F7 at 6 Hz.
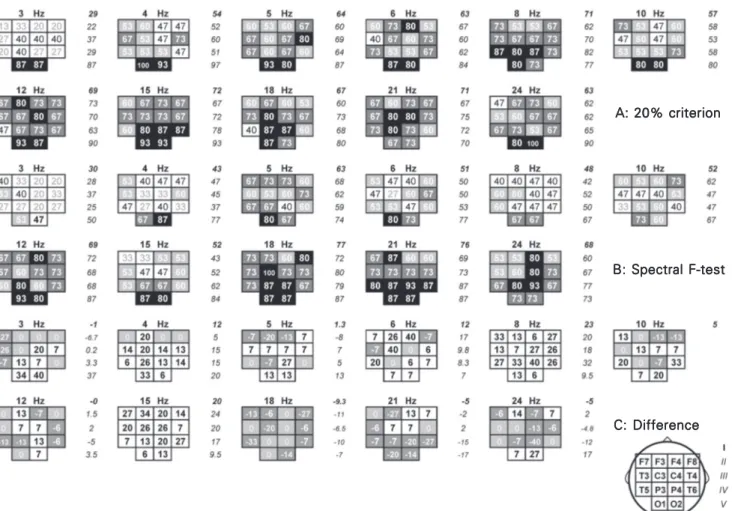
Figure 2. Scalp maps with the percentage of subjects showing a driving response according to the criterion of peak values 20% greater than those of adjacent frequencies (A) and spectral F-test (B) at each of 11 frequencies of intermittent photic stimulation (IPS, Hz) in each lead. Each square cell represents a lead (plotted on each map according to the head scheme in the right lower corner of the figure) with a percentage for the group of 15 subjects at a frequency of IPS given above the corresponding map. To the right of each map - average data for I: 12 leads except O1 and O2; II, III and IV: 4 leads of a corresponding line; V: for O1 and O2 (see the head scheme in the right lower corner of the figure). C, Maps of difference of the percentages between 20% criterion and spectral F-test in each lead.
any region. Therefore, as in our previous communication (3), most of the group data below refer to 14 subjects, excluding the unresponsive subject. In F4, in almost all cases of stimulation, an increase in ampli-tude spectra relative to the background was observed at all the EEG frequencies corre-sponding to those of IPS (Figure 3).
When the mapping of the results of the SFT at all stimulation frequencies for all subjects (Figure 2B) was compared with the 20% criterion maps (Figure 2A), the re-sponses were found to be significant in most cases of the driving peak in the spectrum at the fundamental stimulation frequency
(Fig-ure 2C). For the general group the number of the significant changes in the EEG at all fundamental frequencies of stimulation was 88.8% of the peak responses in the occipital areas and 92.6% in the remaining areas. However, at frequencies of 3 to 15 Hz, in most of the leads (always in the occipital ones), 1 to 6 subjects responded with a spec-tral peak at the stimulation frequency not confirmed by the SFT. On the other hand, there were some areas where significant changes in the EEG at the stimulation fre-quency could be observed in some subjects (1 to 5 in a lead) without being related to the driving spectral peak. Such areas prevailed
A: 20% criterion A: 20% criterion A: 20% criterion A: 20% criterion A: 20% criterion
B: Spectral F-test B: Spectral F-test B: Spectral F-test B: Spectral F-test B: Spectral F-test
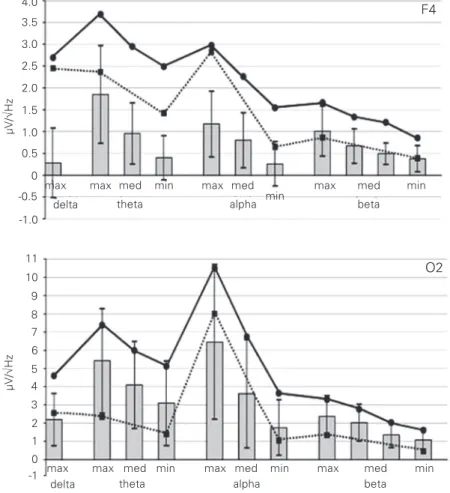
at frequencies of 18 to 21 Hz. At the lower frequencies and at 24 Hz, this phenomenon was never detected in the occipital regions. The profiles of the driving responses ob-tained for the different brain areas proved to have both similar and distinguishing fea-tures in comparison with the occipital reac-tions described in our previous communica-tion (3). For example, this was observed in the right hemisphere where, as mentioned above, the profile in F4 was expected to differ most from that of O2. The shape of the profiles for F4 and O2 (which have different general amplitude levels) can be compared on the basis of the amplitude ratios of the theta, beta and delta maxima to the alpha peak (Figure 3). Both profiles had two maxima in the alpha and theta bands. How-ever, the amplitude ratios between them were different.
In O2, an increased theta maximum (ex-ceeding half the maximum in the alpha band) was observed in 11 of 14 subjects. It was, on average, 70.5 ± 14.6% of the profile’s alpha peak amplitude, with the theta maximum neverexceeding the alpha one. In the resting EEG, the same ratio was 30.8 ± 9.9% (ex-cluding subject T who did not have an alpha peak in the background EEG). An increase in amplitude spectra at the theta maximum (compared to the background) exceeded half of that in the alpha band in 10 subjects. In these cases, it was, on average, 94.7 ± 35.4% of the alpha maximum increase (Figure 3). In the remaining 4 subjects, the profile’s theta maximum was 38.8 ± 10.8% of that of the alpha band, the background ratio was 29.0 ± 11.9%, and the ratio of the maximum ampli-tude increase in the theta band to that of the alpha band was 39.0 ± 11.0%.
In F4, in the same group of 11 subjects who had an increased theta maximum in O2, such maximum was, on average, 120.7 ± 39.9% of that of the alpha maximum, ex-ceeding 100% in 7 cases. In the resting EEG, this ratio was 100.1 ± 36.7% (93.8 ± 31.9% without subject T, see above). An increase in
amplitude spectra (compared to the back-ground) was at the theta maximum, on aver-age, 179.2 ± 112.6% of the alpha maximum increase (Figure 3). In the remaining sub-jects, the profile’s theta maximum was 80.5 ± 25.5% of the alpha one, while the back-ground ratio was 79.7 ± 28.8%, and the ratio of the maximum theta increase to the alpha increase was 67.3 ± 15.5%.
The ratio of the profile beta maximum to the profile alpha maximum was also higher in F4 than in O2. In F4, in 14 subjects it was 52.6 ± 17.9% in the driving profile, 83.2 ± 47.6% (>100% in the same 5 subjects who displayed such prevalence in the theta band)
Figure 3. Group average driving profiles in the right frontal (F4) and occipital (O2) areas. Ordinate: amplitude spectra, in µV/√Hz individual values for each subject being ranged before averaging for each frequency band from maximum to minimum. Abscissa: fre-quency of intermittent photic stimulation and of EEG. Solid line: driving profile; dashed line: initial background; bars: change in amplitude spectra during stimulation in relation to the background.
µV/
√
Hz
4.0
3.5
3.0
2.5
2.0
1.5
1.0
0.5
0
-0.5
-1.0
max max med min max med max med min
delta theta alpha
F4
O2
beta
max max med min max med min max med min
min
µV/
√
Hz
11
10
9 8 7 6
5 4 3
2
0 -1 1
in the amplitude increase in relation to the background, and 36.4 ± 12.1% in the back-ground. In O2 these ratios were 32.5 ± 15.5% in the driving profile, 45.1 ± 33.9% in the amplitude increase, and 18.6 ± 6.1% in the background. Nevertheless, in F4, the profile maximum in the beta band was only 49.2 ± 10.9% of the alpha peak (Figure 3).
In F4, a relatively high amplitude of the driving response to IPS of 3 Hz was also observed, corresponding to 86.0 ± 25.7% of
the alpha peak. This ratio was substantially higher than 42.7 ± 16.7% in O2. However, one can see in Figure 3 that a similar interre-gional ratio occurred in the resting EEG, i.e., 97.9 ± 26.7% and 36.5 ± 18.1%, respec-tively.
The specificity of the ratios between the amplitudes of the driving reaction in differ-ent frequency bands appears to depend on the frequency structure of the background EEG. In F4, similarly to O2 (3), a high level of correlation between profiles and back-ground spectra was observed, with an aver-age correlation coefficient Rdb = 0.75 ± 0.15 (P < 0.001; in O2, Rdb = 0.82 ± 0.13). How-ever, in O2, a decreased value of such a correlation in some subjects was caused pre-dominantly by the appearance of an addi-tional maximum in the theta band (not pres-ent in the background spectrum) and its rela-tive weight in the overall profile. The ratio of the amplitude spectra of this maximum to that of the alpha peak was negatively corre-lated with the values of Rdb (R = -0.77, P < 0.001) (3). In F4, such a decrease in Rdb could depend on a disproportionately in-creased driving response not only in the theta band but also in the beta band. This was reflected on the negative correlation of the values of Rdb with the amplitude spectra at the maxima in both the theta (R = -0.78, P < 0.001) and beta (R = -0.69, P < 0.01) bands. The most pronounced theta driving in the frontal and occipital areas was observed in the same subjects: the theta maxima in these leads correlated in this group with R = 0.75 (P < 0.001).
In the brain areas of the same hemisphere situated between the frontal and occipital poles, an intermediate characteristic of the driving profile form was observed. This was reflected on the lower values of the Pearson correlation coefficient between the profiles of relatively more distant scalp points (Fig-ure 4). The driving profile for O2 correlated with that of P4 (R = 0.80 ± 0.12, P < 0.001), C4 (R = 0.66 ± 0.23, P < 0.01), and F4 (R =
2
1
0
4
3
2
1
0
6
5 4 3
2 1 0
2 4 6 8 10 12 14 16 18 20 22 24 6 5 4 3 2
1 0
2 4 6 8 10 12 14 16 18 20 22 24
12 10 8
6
4 2 0
2 4 6 8 10 12 14 16 18 20 22 24 4
3
2
1
0
2 4 6 8 10 12 14 16 18 20 22 24 2 4 6 8 10 12 14 16 18 20 22 24
2 4 6 8 10 12 14 16 18 20 22 24 2 4 6 8 10 12 14 16 18 20 22 24
Ta F
Tm C
Tp P
O µV/√Hz
Hz 3
2
1
0 3
0.68 ± 0.21, P < 0.01). The profile of F4 correlated with that of C4 (R = 0.94 ± 0.06, P < 0.001) and P4 (R = 0.74 ± 0.23, P < 0.001).
The topographic differences described here in the profile shape occurred mainly due to a general decrease in the relative weight of the alpha activity towards the fron-tal region. However, a less pronounced de-crease in the voltage of the driving reaction was also observed in the other bands (Figure 4). For example, with respect to the 14 sub-jects, the average amplitude of the profile alpha peak in F4 was 3.49 ± 1.44 µV/√Hza or 32.3% of 10.81 ± 3.17 µV/√Hzin O2, in the right hemisphere. In contrast, the profile maximum in the theta band was 3.61 ± 1.38 µV/√Hz or 54.4% of 6.64 ± 2.79 µV/√Hz in O2. With this exception, a certain difference between F4 and O2 was detected in the peak profile frequencies in several cases, thereby contributing to decreasing somewhat the simi-larity between the profiles. From O2 (aver-age alpha frequency 9.57 ± 1.16 Hz) to F4 (9.43 ± 1.45 Hz), the frequency of the profile alpha peak decreased in 2 cases and in-creased in 1 case. In the theta band, there were both an increase and a decrease of the profile peak frequency from O2 (4.86 ± 0.86 Hz) to F4 (4.93 ± 0.73 Hz) - 5 cases each.
In the left hemisphere, the profile shapes and the amplitude ratios of the profile maxima in the different bands were very similar since there was a high interhemispheric similarity between the symmetrical scalp point profiles (Figure 4). Relatively lower average Rs were found between the posterior temporal (R = 0.88 ± 0.08, P < 0.001) and the mid-temporal (R = 0.86 ± 0.13, P < 0.001) leads due to the lower values in some subjects, whereas in the other area, the average R was 0.94 ± 0.05 (P < 0.001).
In the alpha band, the prevalence of the profile peak amplitude in the right hemi-sphere was significant only in the occipital areas (P < 0.05) wherethe average ratio of the right peak amplitude to the left one was 1.12, the right-side prevalence (ratio >1.0) being observed in 10 of 14 subjects. In most cases (88%), the profile peak alpha frequency in symmetrical leads was the same.
In the theta band, the significant right-side prevalence of the profile maximum (P < 0.05) was also observed only in the occipital areas, with an average interhemispheric ra-tio of 1.10 (>1.0 in 9 subjects).
Discussion
The present results show that in the pre-adolescent and pre-adolescent children exam-ined the high responsiveness to the IPS was characteristic for all brain regions. Even in the frontal ones, an increase in amplitude spectra relative to the background was ob-served in the most subjects at all EEG fre-quencies. Such an increase may serve as an additional driving response indicator if we consider that the non-specific orienting re-action to photic stimuli usually produces an amplitude decrease at the adjacent frequen-cies (3,5,30). It may be supposed that the driving reactivity in the age group studied is increased in comparison with that of adults not only in the occipital areas, as it was noted in our previous communication (3) on the basis of literature data (1,2,16), but also in the other areas.
The spectral peak criterion for the detec-tion of the driving response proposed in our previous communication (3) proved to be useful in the topographic study of the phe-nomenon, especially together with the SFT. An application of the latter is very important
aThe unit of the power spectrum is µV2/Hz, as habitually used for the background EEG, and that of the amplitude spectrum
for a statistical evaluation of the reactions to the IPS, and it did confirm the significance of most of the responses obtained, even of the low-amplitude ones in the anterior re-gions.
However, the discordant cases of the spec-tral peak and of statistical criteria are worthy of special consideration. According to the physiological conception of the driving re-sponse, the resonance frequency selectivity is its principal feature. Thus, the detection of changes in the EEG at the IPS frequency by the SFT without a spectral peak may be considered to be a driving response only when there are no changes at the adjacent EEG frequencies. Otherwise, the changes, even when related to the IPS but not selec-tive for its narrow frequency, may be non-specific, such as the EEG desynchronization as part, for example, of the orienting reac-tion and synchronizareac-tion in the habituareac-tion (5,30). This type of EEG desynchronization/ synchronization, in spite of being most pro-nounced in the alpha band, may take place in all other bands (31,32).
In some cases of selective EEG changes detected by the SFT only at the IPS fre-quency, SFT proved to be a more sensitive driving indicator than the spectral peak crite-rion, at least when the latter was taken at the 20% level of excess over the adjacent fre-quencies. Indeed, most cases of SFT indica-tions not accompanied by the spectral peak criterion fall on the anterior areas and on the higher beta frequencies when the driving responses usually are of low amplitude. This needs further investigation.
On the other hand, the orienting reaction during IPS mentioned above may also result in the spectral peak not confirmed by the SFT. In such a case, its effect of non-specific general EEG desynchronization neutralizes the selective driving synchronization, and the latter forms a driving spectral peak with-out significant EEG changes at the stimula-tion frequency (or its harmonics) due to an amplitude decrease at the adjacent
frequen-cies. We described such a case for the alpha band in the previous communication (3). This may partially explain a relative preva-lence of these cases in the occipital areas at the low frequencies of IPS presented at the beginning of stimulation series when the orienting reaction must be most pronounced. Thus, the two criteria used for the driving response detection proved to be quite reli-able, sensitive and mutually complementary instruments in reviewing the estimate of the driving topography.
The construction of an individual driving profile proved to be a quite convenient and informative tool for a detailed assessment of the driving responses and for the quantita-tive comparison of the reactions to different frequencies of IPS in different regions. The profiles for the photic driving induced by stimulation frequencies from 3 to 24 Hz showed that all the main features described for the right occipital area (3) were valid for all the other regions. Their correlation with the background EEG spectra, showing maxi-mum responses at the dominating frequen-cies alpha and theta, further supports the resonance nature of the driving reaction (4,21,27,33-35) discussed in our previous work (3). This correlation also means that in all brain regions, the reactivity to a given IPS frequency is relatively stable since the mag-nitude of the response is usually propor-tional to the background amplitude spectra at the same EEG frequency, regardless of the stimulation times which are different for different IPS frequencies. This makes pro-files maintain their shape in time and princi-pal amplitude proportions between the fre-quency bands characteristic for the back-ground spectrum but on a higher amplitude level. Thus, the profile may be treated as somewhat equivalent to a spectrum (3).
the background spectra, these peaks were not observed in the occipital areas and were less expressed in the other ones. This per-mits us to consider the driving profile to be a more complete representation of an individ-ual’s set of potential oscillators in compari-son with the resting EEG spectrum. In the profile, the manifestation of these oscillators may be seen at a higher synchronization level, presumably closer to the maximum in certain cases, such as those of the alpha band considered in our previous communication (3). For this reason, regarding the complex characteristics of an individual’s EEG, some-times it practically seems less important whether such a maximum in a profile is reached due to the resonance-like driving mechanisms or beyond them (spontane-ously), although the magnitude of the driv-ing response itself in relation to the back-ground level reflects some special individual neurophysiological mechanisms of certain importance for psychophysiological and clinical research and diagnostics. The prob-lem is that this magnitude is dependent on the background state which is difficult to control. The profile must reflect a relatively more standardized functional state of the brain due to external stimulation considered to minimize uncontrolled subjective varia-tions in a current state (39). This demon-strates another advantage of the profile, which was found to be more stable than a resting EEG spectrum in an individual (3). The long-term stability of the frequencies of the indi-vidual driving reactivity in adults has been considered to reflect constitutional features of the EEG (33,35,40).
Such individual stability, together with features differing from those of adults, en-ables us to propose the use of the driving profile in children and adolescents as an indicator of the ontogenesis of the electrical activity of the brain and as an individual characteristic of a developmental stage. The principal peculiarity of the profile during the prepubertal and pubertal periods seemed to
EEG spectra. They may probably reflect some deficiency in the interhemispheric coordina-tion of the funccoordina-tioning of neuronal oscilla-tors of different frequencies (26). This find-ing seems promisfind-ing for the study of the neurophysiological mechanisms of this type of pathology, and may be important in elabo-rating electrophysiological methodologies for diagnostic purposes. The data confirm the position of some authors that the features of the driving reactions to IPS constitute the most reliable EEG indicators for the differ-ent types of headaches (37,38), and show
that the topographic aspect may substan-tially increase the informative value of this methodology. Exploring the topographic characteristics of the driving responses may be very important in EEG studies and for the neurophysiological attributions of regional alterations in the functional state of the brain.
Acknowledgments
The authors are grateful to Dr. D.M. Simpson for his help with part of the soft-ware and for useful discussion.
References
1. Takahashi T (1993). Activation methods. In: Niedermeyer E (Editor),
Electroencephalography: Basic Principles, Clinical Applications, and Related Fields. Williams & Wilkins, Baltimore, MD, USA.
2. Kooi KA, Tucker RP & Marshall RE (1978). Fundamentals of Electro-encephalography. Harper & Row, Hagerstown, MD, USA. 3. Lazarev VV, Simpson DM, Schubsky BM & deAzevedo LC (2001).
Photic driving in the electroencephalogram of children and adoles-cents: harmonic structure and relation to the resting state. Brazilian Journal of Medical and Biological Research, 34: 1573-1584. 4. Walter VJ & Walter WG (1949). The central effects of rhythmic
sensory stimulation. Electroencephalography and Clinical Neuro-physiology, 1: 57-86.
5. Yaguchi K & Iwahara S (1976). Temporal sequence of frequency specific and nonspecific effects of flickering lights upon the occipi-tal electrical activity in man. Brain Research, 107: 27-38.
6. Fox PT & Raichle ME (1984). Stimulus rate dependence of regional cerebral blood flow in human striate cortex, demonstrated by positron emission tomography. Journal of Neurophysiology, 51: 1109-1120.
7. Freedman NL (1963). Bilateral differences in the human occipital EEG with unilateral photic driving. Science, 142: 598-599. 8. Lansing RW & Thomas H (1964). The laterality of photic driving in
normal adults. Electroencephalography and Clinical Neurophysiol-ogy, 16: 290-294.
9. Binnie CD, Wilkins AJ & de Korte RA (1981). Interhemispheric differences in photosensitive epilepsy. II. Intermittent photic stimu-lation. Electroencephalography and Clinical Neurophysiology, 52: 469-472.
10. Hirota T, Yagyu T, Pascual-Marqui RD, Saito N & Kinoshita T (2001). Spatial structure of brain electric fields during intermittent photic stimulation. Neuropsychobiology, 44: 108-112.
11. Fedotchev AI & Bondar AT (1990). Human EEG reactions to the intermittent photic stimulation of different frequency. Uspekhi Fiziologicheskikh Nauk, 21: 97-109 (in Russian).
12. Donker DN (1975). Harmonic composition and topographic distribu-tion of responses to sine wave modulated light (SML), their repro-ducibility and their interhemispheric relationship. Electroencepha-lography and Clinical Neurophysiology, 39: 561-574.
13. Donker DN, Njio L, van Leeuwen WS & Wieneke G (1978).
Inter-hemispheric relationships of responses to sine wave modulated light in normal subjects and patients. Electroencephalography and Clinical Neurophysiology, 44: 479-489.
14. Scheuler W (1983). Clinical significance of increased reaction to photostimulation in the alpha frequency range. EEG-EMG Zeitschrift für Elektroenzephalographie, Elektromyographie und Verwandte Gebiete, 14: 143-153 (in German).
15. Bickford RG (1979). Activation procedures and special electrodes. In: Klass DW & Daly DD (Editors), Current Practice of Clinical Elec-troencephalography. Raven Press, New York.
16. Beydoun A, Schechter SH, Nasreddine W & Drury I (1998). Re-sponses to photic stimulation in patients with occipital spikes.
Electroencephalography and Clinical Neurophysiology, 107: 13-17. 17. Wada Y, Nanbu Y, Jiang ZY, Koshino Y & Hashimoto T (1998).
Interhemispheric EEG coherence in never-medicated patients with paranoid schizophrenia: analysis at rest and during photic stimula-tion. Clinical Electroencephalography, 29: 170-176.
18. Wada Y, Nanbu Y, Kikuchi M, Koshino Y & Hashimoto T (1998). Aberrant functional organization in schizophrenia: analysis of EEG coherence during rest and photic stimulation in drug-naive patients.
Neuropsychobiology, 38: 63-69.
19. Petrenko ET (1988). Electroencephalographic changes in response to the equilibrium test and rhythmic light flashes. Kosmicheskaya Biologiya i Aviakosmicheskaya Meditsina, 22: 21-25 (in Russian). 20. Isaichev SA, Dereviankin VT, Koptelov IuM & Sokolov EN (1999).
Generators of the rhythmic alpha activity in the human EEG. Zhurnal Vysshei Nervnoi Deiatelnosti Imeni I.P. Pavlova, 49: 919-925 (in Russian).
21. Jin Y, Castellanos A, Solis ER & Potkin SG (2000). EEG resonant responses in schizophrenia: a photic driving study with improved harmonic resolution. Schizophrenia Research, 44: 213-220. 22. Wada Y, Takizawa Y & Yamaguchi N (1995). Abnormal photic driving
responses in never-medicated schizophrenia patients. Schizophre-nia Bulletin, 21: 111-115.
23. Nanbu Y, Wada Y, Nakajima M, Futamata H, Hashimoto T & Koshino Y (1997). Topographic analysis of resting EEG and photic driving responses in patients with presenile Alzheimer’s disease. Rinsho Byori, 45: 277-281 (in Japanese).
Chugani HT (1999). Brain activation during intermittent photic stim-ulation: a [15O]-water PET study on photosensitive epilepsy.
Epilepsia, 40 (Suppl 4): 4-17-4-22.
25. Rau R, Raschka C & Koch HJ (2002). Uniform decrease of alpha-global field power induced by intermittent photic stimulation of healthy subjects. Brazilian Journal of Medical and Biological Re-search, 35: 605-611.
26. Lazarev VV, Simpson DM, Schubsky BM & deAzevedo LC (2000). Harmonic structure and topography of EEG driving reaction to inter-mittent photic stimulation in children and adolescents. In: Maurer K & Dierks T (Editors), The Eleventh World Congress. International Society for Brain Electromagnetic Topography. ISBET 2000 Millenium. Abstract Book. Frankfurt, Germany, November 16-19, 2000 (Abstract), 50.
27. Sakamoto H, Inouye T & Shinosaki K (1993). Preservation of alpha rhythm shortly after photic driving. International Journal of Neuro-science, 73: 227-233.
28. Tierra-Criollo CJ, Simpson DM & Infantosi AFC (1998). Detección objetiva de respuestas evocadas en el EEG con la prueba espectral F ponderada [Objective Detection of Evoked Responses in the EEG with the Weighted Spectral F Test]. In: I Congresso Latino-Americano de Ingeniería Biomédica. Vol. 1. Mazatlan, Sinaloa, Mexico, November 11-14, 1998.
29. Infantosi AFC, Lazarev VV & Valencio-de-Campos D (2002). O teste F-espectral na detecção de resposta no EEG durante fotoestimula-ção intermitente. In: XVIII Congresso Brasileiro de Engenharia Biomédica, São José dos Campos, SP, Brazil, September 9-12, 2002.
30. Morrell LK (1966). Some characteristics of stimulus provoked alpha activity. Electroencephalography and Clinical Neurophysiology, 21: 552-561.
31. Petsche H, Rappelsberger P & Rockberger H (1988). Sex differ-ences in ongoing EEG: Probability mapping at rest and during cogni-tive tasks. In: Pfurtscheller G & Lopes da Silva FH (Editors),
Func-tional Brain Imaging. Hans Huber, Toronto, Canada.
32. Lazarev VV (1998). On the intercorrelation of some frequency and amplitude parameters of the human EEG and its functional signifi-cance. Communication I. Multidimensional neurodynamic organiza-tion of funcorganiza-tional states of the brain during intellectual, perceptive and motor activity in normal subjects. International Journal of Psy-chophysiology, 28: 77-98.
33. Fedotchev AI, Bondar AT & Konovalov VF (1990). Stability of reso-nance EEG reactions to flickering light in humans. International Journal of Psychophysiology, 9: 189-193.
34. Basar E, Basar-Eroglu C, Rahn E & Schurmann M (1991). Sensory and cognitive components of brain resonance responses. Acta Oto-Laryngologica (Suppl 491): 25-34.
35. Salansky N, Fedotchev A & Bondar A (1998). Responses of the nervous system to low frequency stimulation and EEG rhythms: clinical implications. Neuroscience and Biobehavioral Reviews, 22: 395-409.
36. Drake Jr ME, Shy KE & Liss L (1989). Quantitation of photic driving in dementia with normal EEG. Clinical Electroencephalography, 20: 153-155.
37. Genco S, de Tommaso M, Prudenzano AM, Savarese M & Puca FM (1994). EEG features in juvenile migraine: topographic analysis of spontaneous and visual evoked brain electrical activity: a compari-son with adult migraine. Cephalalgia, 14: 41-46.
38. Gronseth GS & Greenberg MK (1995). The utility of the electroen-cephalogram in the evaluation of patients presenting with head-ache: a review of the literature. Neurology, 45: 1263-1267. 39. Kaiser J & Gruzelier JH (1996). Timing of puberty and EEG
coher-ence during photic stimulation. International Journal of Psycho-physiology, 21: 135-149.
40. Tyler CW, Apkarian P & Nakayama K (1978). Multiple spatial-fre-quency tuning of electrical responses from human visual cortex.