Modeling habitat suitability of the invasive clam Corbicula fluminea in
a Neotropical shallow lagoon, southern Brazil
T. C. L. Silveira
a*, A. M. S. Gama
b, T. P. Alves
cand N. F. Fontoura
caPrograma de Pós-graduação em Ecologia, Departamento de Ecologia e Zoologia, Centro de Ciências Biológicas – CCB,
Universidade Federal de Santa Catarina – UFSC, Ed. Fritz Muller, CEP 88010-970, Florianópolis, SC, Brazil
bDepartamento de Oceanografia, Fundação Universidade Federal do Rio Grande – FURG, Avenida Itália, Km 8,
Campus Carreiros, CP 474, CEP 96201-900, Rio Grande, RS, Brazil
cLaboratório de Ecologia Aquática, Departamento de Biodiversidade e Ecologia, Pontifícia Universidade Católica do
Rio Grande do Sul – PUCRS, Avenida Ipiranga, 6681, CEP 90619-900, Porto Alegre, RS, Brazil *e-mail: [email protected]
Received: January 29, 2015 – Accepted: June 30, 2015 – Distributed: August 31, 2016
(With 7 figures)
Abstract
This study aimed to model the habitat suitability for an invasive clam Corbicula fluminea in a coastal shallow lagoon
in the southern Neotropical region (–30.22, –50.55). The lagoon (19km2, maximum deep 2.5m) was sampled with an Ekman dredge in an orthogonal matrix comprising 84 points. At each sampling point, were obtained environmental descriptors as depth, organic matter content (OMC), average granulometry (Avgran), and the percentage of sand (Pcsand). Prediction performance of Generalized Linear Models (GLM), Generalized Additive Models (GAM) and Boosted Regression Tree (BRT) were compared. Also, niche overlapping with other native clam species (Castalia martensi, Neocorbicula limosa and Anodontites trapesialis) was examined. A BRT model with 1400 trees was selected
as the best model, with cross-validated correlation of 0.82. The relative contributions of predictors were Pcsand-42.6%, OMC-35.8%, Avgran-10.9% and Depth-10.8%. Were identified that C. fluminea occur mainly in sandy sediments with
few organic matter, in shallow areas nor by the shore. The PCA showed a wide niche overlap with the native clam
species C. martensi, N. limosa and A. trapesialis.
Keywords: habitat suitability, spatial distribution models, model selection, invasive species.
Modelagem da adequabilidade de habitat do bivalve invasor
Corbicula fluminea
em uma lagoa rasa Neotropical
Resumo
O objetivo de deste estudo foi modelar a adequabilidade de habitat do bivalve invasor Corbicula fluminea em uma
lagoa costeira na região Neotropical (–30.22, –50.55). A lagoa (19km2, 2,5 m de profundidade máxima) foi amostrada com uma draga Ekman em uma matriz ortogonal compreendendo 84 pontos. Em cada ponto de amostragem foram obtidos descritores ambientais como a profundidade, teor de matéria orgânica (OMC), granulometria média (Avgran), e a percentagem de areia (Pcsand). O poder preditivo dos métodos Modelos Lineares Generalizados (GLM), Modelos Aditivos Generalizados (GAM) e Boosted Regression Trees (BRT) foram comparados. Além disso, a sobreposição de nicho com espécies de moluscos nativos (Castalia martensi, Neocorbicula limosa e Anodontites trapesialis) foi
examinada. Um modelo BRT com 1.400 árvores foi selecionado como o melhor modelo, com correlação da validação cruzada de 0,82. As contribuições relativas dos preditores foram Pcsand-42,6%, OMC-35,8%, Avgran-10,9% e profundidade-10,8%. Foi demonstrado que C. fluminea está associada a sedimentos arenosos com pouca matéria orgânica, em áreas rasas próximo às margens. A PCA mostrou uma ampla sobreposição de nicho com as espécies de
moluscos nativos C. martensi, N. limosa e A. trapesialis.
Palavras-chave: adequabilidade de habitat, modelos de distribuição espacial, seleção de modelo, espécie invasora.
1. Introduction
Habitat suitability models (HSMs) use environmental variables to predict presence or abundance of a given species in any area of interest, acting as a mathematical
tool to depict the multidimensional niche of a species sensu
Hutchinson (1957). HSMs are useful in conservation, wildlife
predict scenarios of exotic species invasions (Guisan and
Thuiller, 2005; Frankling and Miller, 2009).
Introduction of exotic species in freshwater ecosystems
threatens biodiversity, change ecosystem natural cycles and cause the extinction on native biota (Lodge et al., 1998).
In the past 30 years the Neotropical region suffered the introduction of at least two mussel species, causing negative
environmental and economic impacts (Darrigran, 2002).
One of these species is Corbicula fluminea (Müller, 1774).
Corbicula fluminea is an Asiatic edible clam species
well known for the invasive success (Cohen et al., 1984;
Cataldo and Boltovskoy, 1998). The introduction of
C. fluminea in Brazil is reported since 1970 (Veitenheimer-Mendes, 1981), and the species is now widespread in
several Brazilian freshwaters basins (Rodrigues et al.,
2007). The species has an aggressive invasive behavior, presenting physiological, environmental and behavioral adaptations to live both in lotic (Britton and Morton, 1982; Way et al., 1990) and lentic environments (Cenzano and Würdig, 2006), competing with native clam species (Gardner Junior et al., 1976; Phelps, 1994).
Large colonies of C. fluminea could increase the water
transparency by filtration, changing algae and macrophyte production and influencing all the ecosystem dynamics
(Phelps, 1994; Sousa et al., 2008). Also, the invasive
feature of C. fluminea is enhanced by flotation strategies to disperse, a behavior triggered by the water flowing
stimuli (Prezant and Chalermwat, 1984).
According to McMahon (1981), in environments with lentic dynamics, C. fluminea is restricted to shallow and oxygenated margins. Nevertheless, although several
environmental drivers for C. fluminea presence or abundance have been described in the literature, studies in order to
fit HSMs for the species are still scarce. In this study, we
aimed to select a spatial modeling approach capable to
identify the ecological relationships of C. fluminea with
environmental predictors and to produce a map of habitat suitability. In addition, the niche overlapping with native
clam species was also investigated.
2. Material and Methods
2.1. Study area
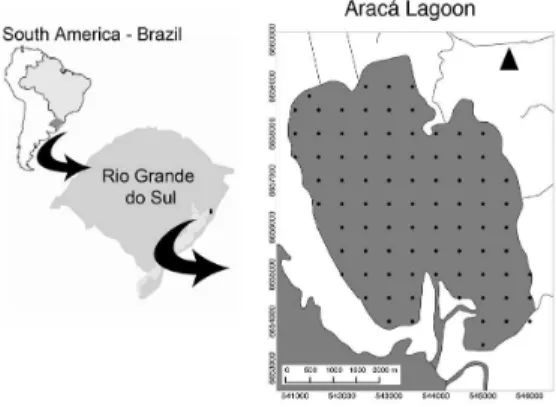
The study was carried out in Araçá Lagoon (southern Brazil; –30.22, –50.55). The lagoon has a surface area of 19 km2, maximum deeps of 2.5m, and receives the drainages of the Capivari River in the northern boundary. In the
southern limit, the lagoon is drained to the Patos Lagoon, a
large coastal system 250km long and 60km wide (Figure 1).
When south-southeast winds are blowing the water flow can be inverted, and strong currents flow from the Patos
Lagoon. These winds, that modulate current systems, leads
to a deltaic formation in both lagoon extremes: the northern delta build from sediments (mud) from the Capivari River, and the southern delta build from sand deposition carried out with strong currents from the Patos Lagoon.
The region has a hot summer with mean temperatures of 29.3 °C in January and winter with temperatures reaching
an average of 10.9 °C in June/July. Precipitation is well distributed during the year, ranging from a maximum of 156mm in September to a minimum of 86mm in November.
The predominant wind regime is northeast with an average
speed of 5m/s, followed by Southwest, with average speeds of 8m/s during the passage of cold fronts (Schwarzbold
and Schäfer, 1984).
2.2. Sampling methods
The sampling design comprised a set of 84 points distributed all over the Araçá Lagoon in a 500m × 500m
Cartesian matrix (Figure 1). Typical position error
was around 30m (GPS error plus boat displacement). Samplings were performed from February 2002 to April 2003. Each sampling site was sampled five times with an Ekman dredge (sampling area: 225 cm2), four subsamples for invertebrates and one for sediment analysis. Sampled
individuals were washed in sieve with mesh size 0.80 mm,
then transferred to labeled plastic bags, kept chilled and transported to the laboratory where they remained frozen (–18 °C) until processing. Other clam species were also
sorted and counted. Species’ abundance comprised the
sum of four subsamples (900 cm2) at each point. Depth (m) was measured with a manual probe corrected by the annual mean (2001-2003) of the nearby Palmares River scale. Sediment sample was transported to the laboratory chilled on ice and stored at –18 °C until analysis. Sediment subsamples were dried and classified through sieves with mesh size of 2000 μm; 1000 μm; 500 μm; 250 μm; 125 μm and 63 μm. The average granulometry (Avgran; μm) was calculated as a weighted average concerning the amount of sediment retained on each sieve. Percentage of sand (Pcsand; %) at each sampling point
was estimated by dividing the sediment retained above
the 63μm sieve by the total dry sample weight (×100). To determine organic matter content (OMC; %) 50 gr of dried sediment was burned through 6 hours in oven furnace at 550 °C, and the OMC determined by weight difference after the carbon oxidation.
Figure 1. Araçá Lagoon, southern Brazil. The black dots
2.3. Statistical analysis
In order to select the best modeling method we evaluated the abundance pattern of C. fluminea with three modeling
approaches: Generalized Linear Models (GLM), Generalized Additive Models (GAM) and Boosted Regression Trees (BRT). Outliers were not excluded in order to compare
the techniques.
We fitted the GLM in R software (R Development
Core Team, 2014) with the package “stats” assuming the
Poisson distribution. The procedure fitted the GLM models through optimization of maximum likelihood estimated
by an iteratively reweighted least-squares mechanism.
The GAM fitting was carried out with the functions “mgcv”
library (Wood, 2001). As the first trials to fit the GAM model, we explored the predictors’ behavior by running the model with a plate regression splines smoothing to
check residuals. After analysis, we identified two distinct responses of C. fluminea abundance in relation to Depth. To handle with these responses, we choose the cubic regression splines smoother. For the remaining predictors
(OMC, Avgran and Pcsand) the thin plate regression splines
smoothing were applied (Wood, 2003).
The BRT method consists of a combination of the two algorithms: regression trees (or decision trees) and boosting. Regression trees were first described by Breiman et al.
(1984), followed by De’ath and Fabricius (2000) and
Hastie et al. (2005). The regression tree is created by
several data splitting, aiming the partition of response
into homogeneous groups (De’ath and Fabricius, 2000).
The Boosting process consists in merging results from
multiple models or regression trees based on the general
principle that finding many rough rules of thumb can be easier than finding a single highly accurate prediction rule
(Schapire, 2003). Boosting is a numerical optimization
method that aims to minimize the loss function by adding
at each step a new tree that best reduces the loss criteria (Elith et al., 2008). The loss function in BRT modeling is a
measure that represents the loss in predictive performance due to a suboptimal model. In this way, thousands of tree models are created and the BRT model works as a linear combination of many trees that can be thought as a regression
model where each term is a tree (Elith et al., 2008).
The BRT models were evaluated by using a ten-fold cross-validation to detect the optimal number of trees to
use in the model and to subsequently assess the predictive
performance (Hastie et al., 2005) and choose the model
with the best cross-validation result. We compared BRT models by setting a fixed learning rate of 0.01 and exploring two different tree complexities, 1 (BRT1) and 2 (BRT2). After running all models, we used the lower Root Mean Squared Error (RMSE) as criteria to select the best modeling technique among GLM, GAM and BRT. The selected model
was used to predict the habitat suitability to the whole
lake area. To generate a prediction map we interpolated
the predictors obtained at each sampling point: Depth,
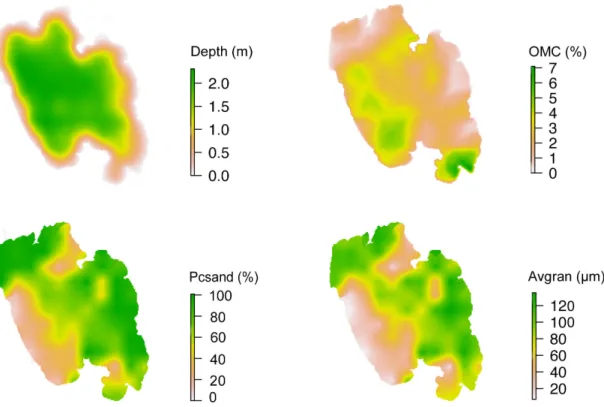
OMC, Avgran and Pcsand by ordinary Kriging (Figure 2). Since the interpolation introduce new bias in the prediction
map, a correcting empirical model (GAM) was fitted with
C. fluminea observed densities as the response variable and the estimated densities as predictors.
Aiming to visualize the potential niche overlap among clam species we ran a Principal Components Analysis
(PCA) using the abundance of the invasive C. fluminea
and the native clam species Castalia martensi Thewing, 1891, Neocorbicula limosa (Maton, 1981) and Anodontites
trapesialis (Lamarck, 1819) in relation to the environmental
predictors Depth, OMC, Avgran and Pcsand.
We carried out GLM, GAM, BRT and PCA under the RStudio 0.98.501 software (RStudio, 2012), an integrated development environment for R software 3.0.3
(R Development Core Team, 2014). We ran the GLM with
the basic package included in R software. We ran the GAM
models with the ‘mgcv’ library (Wood, 2001). To fit the BRT
models we used the ‘gbm’ library from Ridgeway (2012) and functions proposed by Elith et al. (2008). We ran the
PCA using the package “ade4” (Dray and Dufour, 2007). The interpolations were performed with the package GSTAT (Pebesma, 2004) included in the GIS software
IDRISI Andes 15.0 (Clark Labs). The prediction map and
the map processing were performed in RStudio with the functions of package “raster” (Hijmans and Etten, 2012).
3. Results
The abundance of C. fluminea averaged 2.96 individuals
by sampling site (33 ind.m–2), ranging from a minimum of 0 to a maximum of 63 (700 ind.m–2) and was absent roughly half (38) of the sampling points (84). The calculated RMSE for each method was 6.87 for GLM, 2.99 for GAM, BRT1 for 2.17, and BRT2 for 1.73. Figure 3 shows the dissimilarities between models concerning the residual
variances. The GLM model had residual dispersion and was discarded as possible candidate model. GAM achieved
better results concerning residual variances when compared
with GLM; however, the BRT models with tree complexities of 1 and 2 steps presented the best overall performance.
Among them, we choose the boosted regression tree model
with tree complexity of 2 (BRT2), which achieved 0.82
in the cross-validation correlation, being chosen to model
C. fluminea distribution.
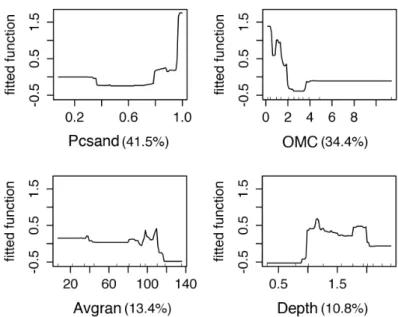
Figure 4 shows the fitted functions to C. fluminea in relation
to each environmental predictor of the BRT model with a tree size of 2. Pcsand had an average relative contribution of 42.6%, followed by OMC (35.8%), Avgran (10.9%) and Depth (10.8%). As a general pattern, C. fluminea occurs
in sites where the sediment has high values of Pcsand and
with low OMC, with increased prevalence in deeps in the
range from 1.0 m to ~1.5m. Figure 5 shows the predicted abundance map to the whole lagoon area. According to our results, C. fluminea presented low abundance in the
northeast-southwest lagoon axis. Increased abundance
match with sandy shores by the eastern and northwestern
lake limits (Figures 2, 5).
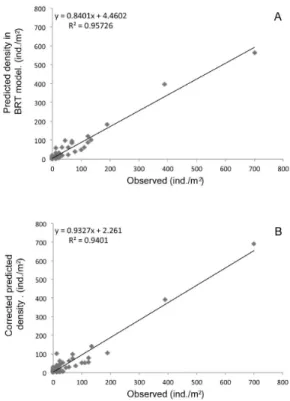
Figure 6A shows scatterplots of observed abundances
abundance of C. fluminea against the data values of the prediction map after the correction of a GAM empirical filter (R2=0.940) suggesting good model performance even after the bias induced from predictors interpolation
to the whole lagoon area.
Three other mussel species were captured during the sampling program: C. martensi (n=2), N. limosa (n=11) and A. trapesialis (n=24). In order to discriminate potential niche overlap in relation to the environmental variables,
a PCA was performed (Figure 7). The first axis explained
76% of the total variance and was positively related to OMC (0.52) and Deep (0.38) and negatively with Pcsand (–0.54) and Avgran (–0.54). The second axis explained additional 18% of the total variance and was positively related to all parameters (Depth, 0.90; Avgran, 0.37; Pcsand, 0.30; OMC, 0.06).
4. Discussion
Modeling habitat suitability and distributional patterns are increasing goals in the ecological literature (Frankling and Miller, 2009). Despite the intense effort to map and
organize the occurrences of aquatic biota in databases, the challenge is related to the unavailability of detailed environmental layers, especially for aquatic environments in small scales. However, successful examples of inference concerning distributional patterns with relative few predictors are already described for freshwater fish (Alves
and Fontoura, 2009; Barradas et al., 2012) by using LOGIT
functions, showing that satisfactory predictions could be achieved with relatively few key environmental predictors.
In the present work, the BRT method proved to be efficient to predict the habitat suitability of C. fluminea
in the Araçá Lagoon with few environmental variables.
Figure 2. Environmental descriptors of the Araçá Lagoon, southern Brazil: depth, organic matter content (OMC), percentage
of sand (Pcsand) and average granulometry (Avgran). Interpolated values by ordinary Kriging from an orthogonal matrix comprising 84 points 500m apart.
Figure 3. Comparative performance of the GLM, GAM, BRT1
The efficiency came from the ability to handle with different types of predictor and extreme outliers. According Elith et al.
(2008), the advantage mainly comes from fitting multiple trees that overcome the drawback of one single solution that could have a relatively poor predictive performance. The BRT produces hundreds or thousands of decision trees, and the final solution is not a consensus, but the sum of solutions from each partial tree developed from a subset
of data. The BRT method is also flexible because it could use different types of predictors and work with missing
values, can handle with outliers and non-linear responses,
and do not need data transformation (Moisen and Frescino, 2002; Friedman and Meulman, 2003; Leathwick et al., 2006; De’ath, 2007; Elith et al., 2008; Frankling and Miller, 2009). These attributes make the methodology very robust
for prediction based in a specific data set, as for weather
Figure 4. Fitted functions to each predictor in the BRT2 model to estimate Corbicula fluminea abundance in Araçá Lagoon,
southern Brazil in relation to depth, organic matter content (OMC), percentage of sand (Pcsand) and average granulometry (Avgran). The number in parentheses shows the relative contribution of the predictor.
forecast, but imply additional obstacles for comparison
purpose as no one can handle, or print, the enormous set
of decision trees that comprise the final solution. Also, the BRT models are Machine Learning methods and lack p values, coefficients and degrees of freedom, becoming
hard to compare with traditional modeling approaches
derived from regression. In our case, we overcame this using a general measure of accuracy, RMSE, to compare
the models.
We found differences between the predicted values from the BRT model and the predicted values from the interpolated predictors. The majority of HSM studies use predictors’ layers ready to use, extracting the information to fit models from those layers. Here we fitted models with
real observations, generating interpolated layers data in order
to feed the prediction model. As we detected differences
between observed data and the interpolated predictors, resulting in bias concerning the descriptor maps, this was
corrected trough a GAM empirical function. In this case,
two nested methodologies gave rise to more accurate predictions, resulting in sharp distributional patterns as shown in Figure 6.
Considering the selected environmental predictors
in the present study, the percentage of sand (Pcsand) was the predictor with greater influence on C. fluminea
distribution (Figure 4) followed by the sedimentary organic
matter content (OMC). The OMC had a negative effect on the habitat suitability for C. fluminea, a pattern already described by Britton and Morton (1982), Cohen et al.
(1984), Mansur et al. (1994) and Cataldo et al. (2001). Areas with low organic matter content, considering lentic
conditions, could be the product of increased hydrological dynamics, with low deposition of fine particles, limnological features that emulate lotic environments. The occurrences of C. fluminea at those locations can be understood as a
consequence of their primary life history, associated with
lotic environments in Asia.
According to our findings, C. fluminea prefers habitats
where sand is predominant and average grain size range
between 80-140 μ, in agreement with Cataldo et al.
(2001). Shirmer (1996) detected high mortality in muddy
habitats, and this information could explain the preference of C. fluminea for sandy environments with low amounts of organic matter. The preference of C. fluminea for
sandy habitats was described by Cenzano and Würdig
(2006) and Duarte and Diefenbach (1994). The sediment
characteristics describe the amount of energy transferred
to the bottom: larger sand grains indicate habitats with increased water dynamics, and smaller grains indicate
depositional habitats. As described for Anodonta anatina
(Englund and Heino, 1996), the species could be favored
by flowing water currents due to energy savings related to filtering movements.
The wind is a key factor that determines the shape
and the hydrodynamics in coastal laggons (Schwarzbold
and Schäfer, 1984), by disturbing the benthic habitats, this influence loses its power as increases the depth. In the central area of the lagoon, with larger deeps and deposition of fine
Figure 6. Comparative relationship between observed abundance of Corbicula fluminea in Araçá Lagoon, southern Brazil, and predicted values estimated by (A) BRT model adjusted from measured environmental descriptors and (B) interpolated predictors from ordinary Kriging after empirical GAM correction.
Figure 7. Principal components analysis (PCA) considering
sediments, the species showed low densities. According to our model, C. fluminea occurrences tend to be higher
in depths ranging from 1.0m to ~1.5m, avoiding deeper
areas with depositional patterns, where wave energy is not strong enough to suspend clay, silt and organic matter.
We observed a niche overlapping of C. fluminea
with native clam species: C. martensi, N. limosa and
A. trapesialis. The PCA (Figure 7) showed occurrences in the same parameters range, once C. fluminea occurs in all environmental range conditions occupied by native species, a pattern already described by Lercari and Bergamino (2011).
As known as an aggressive invasive species, occurring in high abundances and with efficient dispersion capabilities
(Cataldo and Boltovskoy, 1998), this species has dispersion advantages over N. limosa, with no free larval stage and juveniles immediately adopting the benthic phase, what limits dispersion and determines an aggregate spatial distribution (Parodiz and Hennings, 1965).
According to our results, we selected an adequate
model to describe the habitat suitability of C. fluminea
in a shallow coastal lagoon in southern Brazil. The clam
C. fluminea preferred sandy habitats, showing coarser granulometry, and reduced amounts of organic matter in
the sediment. Also we described that C. fluminea has a wide
range of habitat suitability when compared to the native clam species. In a broad sense, the invasive C. fluminea
represents a threat to native clam species in a dimension still
not measured in southern coastal lagoons. Unfortunately, historical demographic data of native clams in coastal lagoons of southern Brazil are not widely available, and a feasible abundance reduction of native clams, in the same
way that C. fluminea became the dominant clam species, is not documented.
Acknowledgements
We wish to thank Jane Elith by the comments and the help with the functions of ‘gbm’ package. We also want to acknowledge Fundação de Amparo à Pesquisa do Rio Grande do Sul (FAPERGS) for the grant (no. 01/0328.0) for the sampling campaigns and Conselho Nacional de Desenvolvimento Científico e Tecnológico (CNPq) for the fellowships to T.C.L.S. (no. 140440/2011-9), T.P.A. (no. 140389/2011-3), and N.F.F. (no. 307485/2014-5).
References
ALVES, T.P. and FONTOURA, N.F., 2009. Statistical distribution models for migratory fish in Jacuí basin, South Brazil. Neotropical Ichthyology, vol. 7, no. 7, pp. 647-658. http://dx.doi.org/10.1590/ S1679-62252009000400014.
BARRADAS, J.R.S., SILVA, L.G., HARVEY, B.C. and FONTOURA, N.F., 2012. Estimating migratory fish distribution from altitude and basin area: a case study in a large Neotropical river. Freshwater Biology, vol. 57, no. 11, pp. 2297-2305. http:// dx.doi.org/10.1111/fwb.12003.
BREIMAN, L., FRIEDMAN, J.H., OLSHEN, R.A. and STONE, C.J., 1984. Classification and regression trees. Monterey: Wadsworth and Brooks.
BRITTON, J.C., and MORTON, B., 1982. Dissection guide, field and laboratory manual for the introduced bivalve Corbicula fluminea.Malacological Review, no. 3, pp. 1-81.
CATALDO, D. and BOLTOVSKOY, D., 1998. Population dynamics of Corbicula fluminea (Bivalvia) in the Paraná river delta (Argentina). Hydrobiologia, vol. 380, no. 1-3, pp. 153-163. http://dx.doi.org/10.1023/A:1003428728693.
CATALDO, D., COLOMBO, J.C., BOLTOVSKOY, D., BILOS, C. and LANDONI, P., 2001. Environmental toxicity assessment in the Paraná river delta (Argentina): simultaneous evaluation of selected pollutants and mortality rates of Corbicula fluminea (Bivalvia) early juveniles. Environmental Pollution, vol. 112, no. 3, pp. 379-389. http://dx.doi.org/10.1016/S0269-7491(00)00145-7. PMid:11291444.
CENZANO, C.S.S. and WÜRDIG, N.L., 2006. Spatial and temporal variations of the benthic macrofauna in different habitats of a lagoon of the northern coastal system of Rio Grande do Sul state, Brazil. Acta Limnologica Brasiliensia, no. 18, pp. 153-163. COHEN, R.R.H., DRESLER, P.V., PHILLIPS, E.J.P. and CORY, R.L., 1984. The effect of the Asiatic clam, Corbicula fluminea, on phytoplankton of the Potomac River, Maryland. Limnology and Oceanography, vol. 29, no. 1, pp. 170-180. http://dx.doi. org/10.4319/lo.1984.29.1.0170.
DARRIGRAN, G., 2002. Potential impact of filter-feeding invaders on temperate inland freshwater environments. Biological Invasions, vol. 4, no. 4, pp. 145-156. http://dx.doi. org/10.1023/A:1020521811416.
DE’ATH, G. and FABRICIUS, K.E., 2000. Classification and regression trees: a powerful yet simple technique for ecological data analysis. Ecology, vol. 81, no. 11, pp. 3178-3192. http:// dx.doi.org/10.1890/0012-9658(2000)081[3178:CARTAP]2.0.CO;2. DE’ATH, G., 2007. Boosted trees for ecological modelling and prediction. Ecology, vol. 88, no. 1, pp. 243-251. http://dx.doi. org/10.1890/0012-9658(2007)88[243:BTFEMA]2.0.CO;2. PMid:17489472.
DRAY, S., and DUFOUR, A.B., 2007. The ade4 package: implementing the duality diagram for ecologists. Journal of Statistic Software, no. 22, pp. 1-20.
DUARTE, M.M. and DIEFENBACH, C.O., 1994. Microdistribution and abundance of freshwater mussels (Mollusca: Unioncea & Corbiculacea) in Suzana Lake, southern Brazil. Studies on Neotropical Fauna and Environment, no. 4, pp. 149-155. ELITH, J., LEATHWICK, J.R. and HASTIE, T., 2008. A working guide to boosted regression trees. Journal of Animal Ecology, vol. 77, no. 4, pp. 802-813. http://dx.doi.org/10.1111/j.1365-2656.2008.01390.x. PMid:18397250.
ENGLUND, V.P.M. and HEINO, M.P., 1996. Valve movement of the freshwater mussel Anodonta anatina: a reciprocal transplant experiment between lake and river. Hydrobiologia, vol. 328, no. 1, pp. 49-56. http://dx.doi.org/10.1007/BF00016899.
FRANKLING, J. and MILLER, J.A., 2009. Mapping species distributions: spatial inference and prediction. Cambridge: Cambridge University Press.
Medicine, vol. 22, no. 9, pp. 1365-1381. http://dx.doi.org/10.1002/ sim.1501. PMid:12704603.
GARDNER JUNIOR, J.A., WOODALL JUNIOR, W.R., STAATS JUNIOR, A.A. and NAPOLI, J.F., 1976. The Invasion of the Asiatic Clam Corbicula manilensis in the Altamaha River Georgia US. The Nautilus, vol. 3, no. 90, pp. 117-125.
GUISAN, A. and THUILLER, W., 2005. Predicting species distribution: offering more than simple habitat models. Ecology Letters, vol. 8, no. 8, pp. 993-1009. http://dx.doi.org/10.1111/j.1461-0248.2005.00792.x.
HASTIE, T., TIBSHIRANI, R. and FRIEDMAN, J.H., 2005. The elements of statistical learning: data mining, inference, and prediction. New York: Springer.
HIJMANS, R.J., and ETTEN, J.V.A.N., 2012. Raster: geographic analysis and modeling with raster data. R package version 2.0-12. Vienna: Cran R Project.
HUTCHINSON, G.E., 1957. Concluding remarks. Cold Spring Harbor Symposia on Quantitative Biology, vol. 22, no. 0, pp. 415-427. http://dx.doi.org/10.1101/SQB.1957.022.01.039. LEATHWICK, J.R., ELITH, J., FRANCIS, M.P., HASTIE, T. and TAYLOR, P., 2006. Variation in demersal fish species richness in the oceans surrounding New Zealand: an analysis using boosted regression trees. Marine Ecology Progress Series, vol. 321, pp. 267-281. http://dx.doi.org/10.3354/meps321267.
LERCARI, D. and BERGAMINO, L., 2011. Impacts of two invasive mollusks, Rapana venosa (Gastropoda) and Corbicula fluminea (Bivalvia), on the food web structure of the Río de la Plata estuary and near shore oceanic ecosystem. Biological Invasions, vol. 13, no. 9, pp. 2053-2061. http://dx.doi.org/10.1007/ s10530-011-0023-x.
LODGE, D., STEIN, R., BROWN, K., COVICH, A.P., BRONMARK, C., GARVEY, J.E. and KLOSIEWSKT, S.P., 1998. Predicting impact of freshwater exotic species on native biodiversity: challenges in spatial scaling. Australian Journal of Ecology, vol. 23, no. 1, pp. 53-67. http://dx.doi.org/10.1111/j.1442-9993.1998.tb00705.x. MANSUR, M.C.D., VALER, R.M. and AIRES, N.C.M., 1994. Distribuição e preferências ambientais dos moluscos bivalves do açude do Parque de Proteção Ambiental da COPESUL, Município de Triúnfo, Rio Grande do Sul. Biociencias, vol. 1, no. 2, pp. 27-45. MCMAHON, R.F., 1981. The occurrence and spread of the introduced Asiatic freshwater clam, Corbicula fluminea (Müller), in north America: 1924-1982. The Nautilus, no. 96, pp. 134-141. MOISEN, G. and FRESCINO, T., 2002. Comparing five modeling techniques for predicting forest characteristics. Ecological Modelling, vol. 157, no. 2-3, pp. 209-225. http://dx.doi.org/10.1016/ S0304-3800(02)00197-7.
PARODIZ, J.J. and HENNINGS, L., 1965. The Neocorbicula (Mollusca, Pelecypoda) of the Paraná-Uruguay, South America. Annals of the Carnegie Museum, vol. 3, no. 38, pp. 69-96. PEBESMA, E.J., 2004. Multivariable geostatistics in S: the gstat package. Computers & Geosciences, vol. 30, no. 7, pp. 683-691. http://dx.doi.org/10.1016/j.cageo.2004.03.012.
PHELPS, H.L., 1994. The Asiatic clam (Corbicula fluminea) invasion and system-level ecological change in the Potomac River estuary near Washington, DC. Estuaries and Coasts, vol. 17, no. 3, pp. 614-621. http://dx.doi.org/10.2307/1352409.
PREZANT, R.S. and CHALERMWAT, K., 1984. Flotation of the bivalve Corbicula fluminea as a means of dispersal. Science, vol. 225, no. 4669, pp. 1491-1493. http://dx.doi.org/10.1126/ science.225.4669.1491. PMid:17770078.
R DEVELOPMENT CORE TEAM, 2014 [viewed 2 December 2014]. R: a language and environment for statistical computing. Vienna: R Foundation for Statistical Computing. Available from: http://www.R-project.org/.
RIDGEWAY, G., 2012 [viewed 2 December 2014]. GBM: Generalized Boosted Regression Models: version 1.6-3.2. Vienna: Cran R Project. Available from: http://CRAN.R-project.org/package. RODRIGUES, J., PIRES-JUNIOR, O., COUTINHO, M.F. and MARTINS-SILVA, M.J., 2007. First occurrence of the Asian Clam Corbicula fluminea (Bivalvia: Corbiculidae) in the Paranoá Lake, Brasília, Brazil. Brazilian Journal of Biology = Revista Brasileira de Biologia, vol. 67, no. 4, pp. 789-790. http://dx.doi. org/10.1590/S1519-69842007000400032.
RSTUDIO, 2012 [viewed 2 December 2014]. RStudio: integrated development environment for R (Version 0.96.122). Boston: RStudio. Available from: http://www.rstudio.org/.
SCHAPIRE, R.E., 2003. The boosting approach to machine learning: an overview. In: D.D. DENISON, M.H. HANSEN, M.B. HOLMES, B. YU, eds. MSRI Workshop on nonlinear estimation and classification. Heidelberg: Springer.
SCHWARZBOLD, A. and SCHAFER, A., 1984. Gênese e morfologia das lagoas costeiras do Rio Grande do Sul - Brasil. Amazoniana, no. 10, pp. 87-104.
SHIRMER, C.L., 1996. Aspectos da Ecologia e Biologia de Corbicula fluminea e Neocorbicula limosa na Lagoa Suzana. Porto Alegre: Universidade Federal do Rio Grande do Sul. Master’s dissertation in Ecology.
SOUSA, R., ANTUNES, C. and GUILHERMINO, L., 2008. Ecology of the invasive Asian clam Corbicula fluminea (Müller, 1774) in aquatic ecosystems: an overview. Annales de Limnologie - International. Journal of Limnology, vol. 44, no. 2, pp. 85-94. http://dx.doi.org/10.1051/limn:2008017.
VEITENHEIMER-MENDES, I.L., 1981. Corbicula manilensis (Philippi,1844), molusco asiático na bacia do Jacuí e do Guaíba, Rio Grande do Sul, Brasil. Iheringia Série Zoologia, no. 70, pp. 63-74. WAY, C., HORNBACH, D., MILLER-WAY, C., PAYNE, B. and MILLER, A., 1990. Dynamics of filter feeding in Corbicula fluminea (Bivalvia: Corbiculidae). Journal of Zoology, no. 68, pp. 115-120.
WOOD, S.N., 2001. MGCV: GAMs and generalized ridge regression for R. R News, vol. 2, no. 1, pp. 20-25.