Fisioter. Mov., Curitiba, v. 30, n. 2, p. 319-328, Apr./June 2017 Licenciado sob uma Licença Creative Commons DOI: http://dx.doi.org/10.1590/1980-5918.030.002.AO12
[T]
Balance and postural control in basketball players
Equilíbrio e controle postural em atletas de basquetebol
Murilo Curtolo, Helga Tatiana Tucci, Tayla P. Souza, Geiseane A. Gonçalves, Ana C. Lucato, Liu C. Yi*
Universidade Federal de São Paulo (UNIFESP), Santos, SP, Brazil
[R]
Abstract
Introduction: Basketball is one of the most popular sports involving gestures and movements that require single-leg based support. Dorsiflexion range of motion (DROM), balance and postural control may influence the performance of this sport. Objective: To compare and correlate measures of balance, postural control and ankle DROM between amateur basketball athletes and non-athletes. Methods: Cross-sectional study, com -posed by 122 subjects allocated into one control group (CG = 61) and one basketball group (BG = 61). These groups were subdivided into two other groups by age: 12-14 years and 15-18 years. The participants were all tested for postural balance with the Star Excursion Balance Test (SEBT), postural control with the Step-down test and DROM with the Weight-bearing lunge test (WBLT). Between-groups differences were compared using repeated-measures multivariate analysis of variance. Normalized reaching distances were analyzed and cor -related with the WBLT and Step-down test. Results: There was no difference in the scores of WBLT (P = .488) and Step-down test (P =. 916) between the groups. Scores for the anterior reach (P = .001) and total score of SEBT (P = .030) were higher in BG. The values for the posterolateral (P = .001) and posteromedial reach (P = .001) of SEBT were higher in BG at the age of 15-18. The correlation between the anterior reach of the SEBT and WBLT was significant in BG between 12-14 years (r = 0.578, P = .008), and in the CG between 15-18 years (r = 0.608, P=.001). Conclusion: The balance was better in the BG, although adolescents between 15-18 years have better balance control for the posteromedial and posterolateral reaches of the SEBT.
Keywords: Adolescent. Postural Balance. Proprioception. Ankle.
* MC: MS, email: [email protected] HTT: PhD, email: [email protected] TPS: MS, email: [email protected]
320
Resumo
Introdução: O basquetebol é um dos esportes mais praticados na atualidade, o qual envolve gestos e
movimen-tos que exigem apoio unipodal. Amplitude de movimento de dorsiflexão (ADMD), equilíbrio e controle postural podem influenciar o desempenho deste esporte. Objetivo: Comparar e correlacionar medidas de equilíbrio, controle postural e ADMD de tornozelo entre atletas de basquetebol amadores e não-atletas. Métodos:
Trata-se de um estudo transversal, composto por 122 participantes. Estes foram distribuídos em grupo controle (GC = 61) e grupo basquete (GB = 61). Cada grupo foi subdivido em outros dois, de acordo com a idade: 12-14 e 15-18 anos. Todos foram avaliados para equilíbrio postural com Star Excursion Balance Test (SEBT), controle postur
-al com Step-down teste e ADMD foi testada com Weight-bearing lunge test (WBLT). As diferenças entre os gru
-pos foram comparadas pelo teste de medidas repetidas e análise de variância multivariada. Distâncias normal
-izadas dos alcances no SEBT foram analisadas e correlacionados com o WBLT e Step-down test. Resultados:
Não houve diferença entre os grupos nos escores do WBLT (P = .488) e Step-down test (P = .916). A pontuação para alcance anterior (P = .001) e escore total de SEBT (P = .030) foram maiores no GB. Os valores para alcance posterolateral (P = .001) e posteromedial (P = .001) do SEBT foram maiores no GB de 15-18 anos. A correlação entre distância anterior do SEBT e WBLT foi significativa no GB de 12-14 anos (r = 0.578, P = .008) e no GC de 15-18 anos (r = 0.608, P = .001). Conclusão: O equilíbrio foi melhor no GB, embora adolescentes de 15-18 anos possuam melhor controle de equilíbrio para alcances posteromedial e posterolateral do SEBT.
Palavras-chave: Adolescente. Equilíbrio Postural. Propriocepção. Tornozelo.
Introduction
Basketball is one of the most popular sports
among high school students, which includes chang
-ing direction, jump-ing and runn-ing, promot-ing a great deal of overload in the lower limbs (LL) (1). The in
-fluence of balance and neuromuscular control with overload seems related to injuries in the structures involved, such as ligaments and articular capsule, which may put an early end to the athlete’s career (2).
Ankle sprain is the most frequent injury in bas
-ketball. Fong et al. (3) reported that ankle sprain was the main type of injury in athletes in 33 out of the 43 sports investigated in their study, which included basketball, volleyball and team handball. The loss of afferent signals from the joint that suffers from joint functional instability is due to damage to the joint capsule and ligaments, producing delayed and dimin
-ished reflex responses of the ankle evertor muscles (4).After injury, these muscles would not be able to respond with an activation time suitable to any unex
-pected disturbance, making the ankle joint vulnerable to repeated inversion injuries (5, 6, 7, 8, 9).
Therefore, the development of effective strategies for the prevention of injuries to the lower limbs can
result in a major reduction in expenses on rehabilita
-tion. Thus, one of the main objectives of the evalu
-ations of postural balance in LL is the guidance on treatment and sports training, aiming to prevent LL injuries (8). Research related to prevention is based on the identification of the causes and risk factors, but there is a lack of the information related to court sports (10).
Until date, only the study by Hoch et al. (11) corre
-lated the measures of balance and ankle dorsiflexion range of motion (DROM) in healthy non-athletes, not
-ing the need to verify if such correlations would also be found in basketball players, who constantly suffer from injuries such as ankle sprains, compromising postural balance.
Given the above, studies intended to investigate the causes and risk factors that may withdraw bas
-ketball players from their activities are important to further clarify this issue, contributing to help and design specific rehabilitation exercise and prevention programs. Therefore, the aims of this study were: (1) to compare the measures of balance, postural con
321 To promote up right balance during the test, the op
-posite limb was positioned at approximately one foot length behind the test foot in a comfortable tandem stance and subjects placed their hands on the wall. While maintaining this position, subjects were in
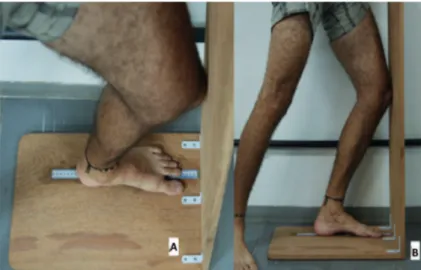
-structed to perform a lunge, in which the knee was flexed with the goal of making contact between the anterior knee and the wall of the wooden structure while keeping the heel firmly planted on the floor (Figure 1) (11). When subjects were not able to maintain heel and knee contact, the test foot was progressed away from the wall and the subjects re
-peated the modified lunge (15). Subjects were pro
-gressed in 1 cm increments until the first lunge in which the heel and knee contact could be maintained. Maximum lunge distance on the WBLT was measured to the nearest 0.5 cm by a tape measure secured to the floor. Previous research indicates that every 1 cm away from the wall is equivalent to approximately 3.6º of ankle dorsiflexion. Maximum lunge distance was defined as the distance of the second toe from the wall, based on the furthest distance the foot could be placed without the heel lifting from the ground while the knee was able to touch the wall (15).The
same investigator administered the WBLT across all subjects (Figure 2).
Star excursion balance test (SEBT)
Each subject also completed a modified SEBT modeled, following the method described by Plisky et al. (16) and used by Filipa et al. (17) Subjects re
-ceived verbal instruction and visual demonstration of the SEBT from the same examiner. The subjects stood on the dominant lower extremity, with the most distal aspect of their great toe on the center of the grid. The subjects were then asked to reach
in the anterior, posteromedial and posterolateral
direction, while maintaining their single-limb stance (Figure 1). Six practice trials were performed on each limb for each of the 3 reach directions prior to official testing (18).On the seventh trial, the ex
-aminer visually recorded the most distal location of the reach foot as it contacted the grid in the 3 directions. The trial was discarded and the subject repeated the testing trial if (1) the subject was un
-able to maintain single-limb stance, (2) the heel of the stance foot did not remain in contact with the floor, (3) weight was shifted on to the reach foot in Methods
One hundred and twenty two male adolescents between 12 and 18 years of age were evaluated. The subjects were divided into two groups: Control Group (CG = 61) and Basketball Group (BG = 61). Subjects’ demographic characteristics are shown in Table 1. The groups were subdivided into two other groups: the Control Group 12-14 years (CG 12-14 = 30) and Control Group 15-18 years (CG 15-18 = 31), composed of non-athletes; Basketball Group 12 to 14 years (BG 12-14 = 31) and Basketball Group 15-18 years (BG 15-18 = 30), composed of amateur basketball players. This division was made for the dif
-ferences found in the maturation of the sensorimotor system in children and adolescents (12, 13).
Using the variable SEBT Final Score as the main variable of the study, compared between the four groups, the ANOVA test was used to calculate the
sample sizeneeded for the experiment. Considering
an 83% power, a 5% significance level, and based on previous studies, a difference of ten units on aver
-age for the SEBT final score and four units between groups, a sample size of thirty subjects in each group was set (14).
Inclusion criteria for basketball group were ama
-teur basketball practicing subjects, training with a frequency greater than or equal to two times per week and, for the control group, only subjects who practiced physical activities less frequently than twice a week were included. We excluded all subjects with a history of lower limb injury in the past six months, self-reported disability in foot and ankle, surgery or balance disorder history and lower limb discrepancy greater than 1.25 cm. All volunteers agreed to sign the term of assent and their parents accepted signing the consent form. This study received approval from the Research Ethics Committee under number 19627.
Weight-bearing lunge test (WBLT)
To perform the WBLT, an "L-shaped" wooden struc
-ture was built, using the knee-to-wall principle de
322
first the dominant and then the non-dominant. The subject’s limb length measures, from the most distal end of the anterior superior iliac spine to the most distal end of the lateral malleolus on each limb, were taken and recorded.
any of the 3 directions, or (4) their each foot did not return to the starting position prior to reaching in another direction. The process was then repeated while standing on the non-dominant lower extrem
-ity. The order of limb testing was always the same:
Figure 1 - Star excursion balance test reaches - A: Posterolateral. B: Anterior. C: Posteromedial
Figure 2 - A: Weight-bearing lunge test (view from above). B: Weight-bearing lunge test (view from the side)
Step-down test
The Step-down test was performed using a standardized protocol described by Piva et al. (19) First (1) the patient was asked to stand in single-limb support with the hands on the waist, the knee straight, and the foot positioned close to the edge
323 three tests were correlated taking into consideration Pearson’s correlation coefficient (r), considering r > 0.3 as a weak correlation, r > 0.5 as a moderate correlation and r > 0.7 as an excellent correlation.
Statistical Analysis
To compare the basketball and control groups re
-garding the variables weight, height and Body Mass Index (BMI), considering age as an independent vari
-able, we used the analysis of variance (ANOVA) with two factors.
In order to compare the variables between the groups, we used the ANOVA with repeated measures. After the analysis, the Bonferroni post-hoc test was performed for interactions with a significance level lower than or equal to 5% (p ≤.05). The correlations between the variables in each group were calculated using the Pearson correlation coefficient, considering only moderate correlations with r > 0.5. The signifi
-cance level adopted was 5% (p ≤.05).
Results
The results of the anthropometric data analysis showed that the weight (P = .03), height (P = .009) and lower limb length (P = .001) in the BG were higher than in the CG. Regarding the BMI variable
(P = 0.533), the groups did not differ. The data are
shown in Table 1.
The results showed no differences between the groups BG and CG for the Weight-bearing lunge test (P = .488) and Step-down test (P = .916). The basket
-ball group presented higher values than the control group for the anterior reach of SEBT (P = .001) and the SEBT final score (P = .030), independently of side dominance and age. The non-dominant side showed
higher values than the dominant side for anterior
reach of SEBT (P = .018). In both groups, the reach of the SEBT PM and PL are higher at the age of 15-18 years, compared with the ages 12-14 and, in BG these values are higher at the age 15-18 when compared with CG. The data are presented in Table 2.
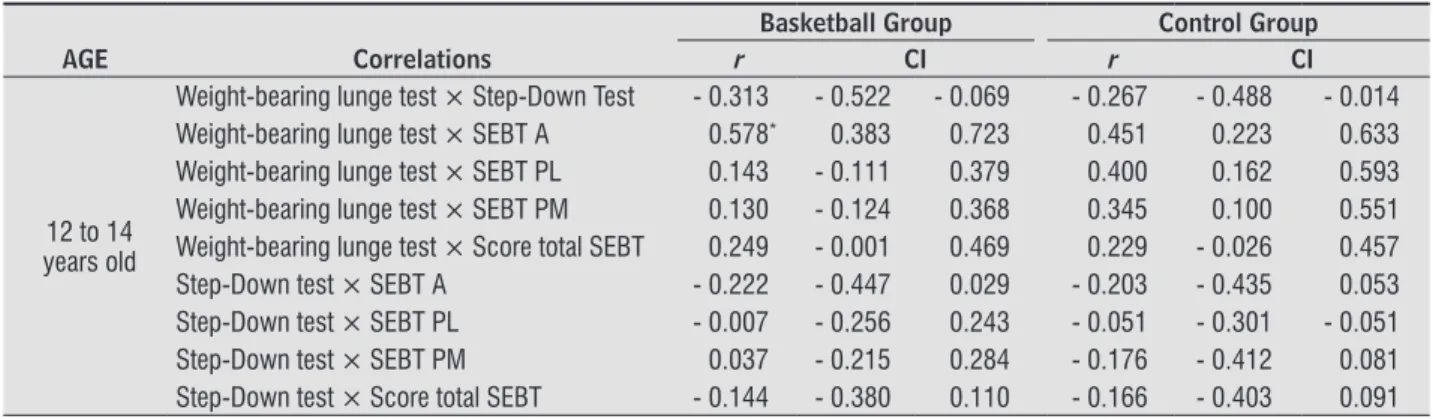
Table 3 shows that there was a moderate cor
-relation between the variables anterior reach and Weight-bearing lunge test in the BG for the age groups 12-14 years old (r = 0.578, P = .008) and in the CG for the group 15-18 years old (r = 0.608, P = .001). 3.5 meters of distance from the step to record the
movement. The examiner faces the subject and scores the test based on 5 criteria: (1) Arm strategy: If the subject used an arm strategy in an attempt to recover balance, 1 point is added. (2) Torso movement: If the torso leaned to any side, 1 point is added. (3) Pelvis plane: If pelvis rotated or elevated one side compared with the other, 1 point is added. (4) Knee position: If the knee deviates medially and the tibial tuberosity crosses an imaginary vertical line over the second toe, add 1 point or, if the knee deviates medially and the tibial tuberosity crosses an imaginary vertical line over the medial border of the foot, 2 points are added. (5) Maintain steady unilateral stance: If the subjects stepped down on the non-tested side, or if the subject's tested limb became unsteady (i.e. wa
-vered from side to side on the tested side), add 1 point (19).
The evaluations were conducted by three senior physiotherapists, each responsible for one assess
-ment, to avoid potential interference with the results. The evaluators were trained and had prior knowledge of the tests, which were performed in random order according to the order of arrival of the volunteers. All tests were performed in both lower limbs, always starting with the dominant limb.
The LL dominance was determined by asking the participant to kick a ball thrown in his direction by the evaluator. The lower limb that performed the kick was considered the dominant limb (20).
Data Analysis
One single attempt to WBLT was used, using a single measure to analyze the results. The SEBT composite score was calculated by dividing the sum of the maximum reach distance in the anterior (A), posteromedial (PM), and posterolateral (PL) direc
-tions by 3 times the limb length (LL) of the individual, then multiplied by 100 {[(ANT + PM + PL) / (LL x 3)] x 100}. The data analysis of the step-down test was done if any of the criteria repeated in either five attempts, and only one was deemed an error. A total score of 0 or 1 is classified as good quality of move
-ment, a total score of 2 or 3 is classified as medium quality, and a total score of 4 or higher is classified as poor quality of movement (20).
For all tests, the dominant and non-dominant
324
Table 1 - Participant characteristics
Control Group (n = 61) Basketball Group (n=61) P Value
Age, y 14.39 ± 1.75 14.36 ± 1.74 Paired
Height, m 1.66 ± .12 1.80 ± .15 .009*
Weight, kg 60.82 ± 13.92 72.10 ± 18.16 .003*
BMI, kg/m2 21.52 ± 3.23 21.85 ± 3.18 .533
LL (cm) 89.99 ± 6.45 95.31 ± 9.43 .001*
Note: m, meters; kg, kilogram: BMI, Body Mass Index; LL, Limb Length; cm, centimeters. Source: Research data.
Table 2 - Comparation between groups
Groups
BG 12-14 BG 15-18 CG 12-14 CG 15-18
Dominant Non Dominant Dominant Non Dominant Dominant Non Dominant Dominant Non Dominant WBLT 13.42 ±2.96
13.05 ±
2.77
11.73 ±
3.61
11.95 ±
3.60
12.87 ±
3.22
13.12 ±
3,24
12.73 ±
4.27
13.23 ±
4.67 Step-down
Test 3.81 ±.87 4.00 ± 1.13 4.00 ± 1.08 3.97 ± 1.16 4.07 ±.94 4.23 +.77 3.84 ±.82 3.71 ± 1.10
SEBT Ant 58.56 ± 5.46*
60.77 ±
6.39†
66.62 ±
6.03‡
67.65 ±
5.56§
52.72 ±
6.63*
54.55 ±
6.37†
58.95 ±
4.94‡
61.58 ±
5.03§
SEBT PL 74.34 9.95± 72.26 9.61± 87.77 12.9║± 87.17 7.79║± 78.83 11.10± 70.67 13.03± 77.79 11.27±║ ±75.29 10.60║
SEBT PM 80.23 ±
7,41
82.81 ±
7.56
93.25 ±
7.87#
92.87 ±
13.24#
76.00 ±
8.90
77.92 ±
10.05
81.92 ±
9.25#
83.24 ±
9.55# Score inal
SBET
80.10 ±
6.52**
81.18 ±
7.26**
80.48 ±
7.47††
81.49 ±
6.91††
78.50 ±
7.00**
78.68 ±
7.86**
77.60 ±
6.45††
78.10 ±
7.07††
Note: CG, Control Group; BG, Basketball Group; WBLT, Weight-bearing lunge test; SEBT, Star Excursion Balance Test A, anterior; PL, pos-terolateral; PM, posteromedial; *, Statistically signiicant difference from the dominant side for anterior reach of the SEBT between BG 12-14
GB and GC 12-14; †, Statistically signiicant difference from the non-dominant side for anterior reach of the SEBT between BG 12-14 and CG
12-14; ‡ , statistically signiicant difference between the dominant side for anterior reach of the SEBT between 15-18 BG and CG 15-18; §, statistically signiicant difference between the non-dominant side for anterior reach of the SEBT between BG 15-18 and CG 15-18; ║and #, statistically signiicant difference for the variable PL and PM of the SEBT, respectively, between the BG 15-18 and CG 15-18 for the dominant
and non-dominant sides; **, Statistically signiicant difference for the variable inal score of SEBT, between BG 12-14 and CG 12-14, for the
dominant and non-dominant sides; ††, Difference statistically signiicant for the variable inal score of SBET, between BG the 15-18 and CC 15-18 for the dominant and non-dominant sides.
Source: Research data.
Table 3 - Pearson’s correlation coefficient for basketball and control groups according to age
Basketball Group Control Group
AGE Correlations r CI r CI
12 to 14 years old
Weight-bearing lunge test × Step-Down Test - 0.313 - 0.522 - 0.069 - 0.267 - 0.488 - 0.014
Weight-bearing lunge test × SEBT A 0.578* 0.383 0.723 0.451 0.223 0.633
Weight-bearing lunge test × SEBT PL 0.143 - 0.111 0.379 0.400 0.162 0.593
Weight-bearing lunge test × SEBT PM 0.130 - 0.124 0.368 0.345 0.100 0.551
Weight-bearing lunge test × Score total SEBT 0.249 - 0.001 0.469 0.229 - 0.026 0.457
Step-Down test × SEBT A - 0.222 - 0.447 0.029 - 0.203 - 0.435 0.053
Step-Down test × SEBT PL - 0.007 - 0.256 0.243 - 0.051 - 0.301 - 0.051
Step-Down test × SEBT PM 0.037 - 0.215 0.284 - 0.176 - 0.412 0.081
Step-Down test × Score total SEBT - 0.144 - 0.380 0.110 - 0.166 - 0.403 0.091
325
Table 3 - Pearson’s correlation coefficient for basketball and control groups according to age
Basketball Group Control Group
AGE Correlations r CI r CI
15 to 18 years old
Weight-bearing lunge test × Step-Down Test - 0.167 - 0.404 0.090 - 0.419 - 0.606 - 0.190
Weight-bearing lunge test × SEBT A 0.228 - 0.027 0.456 0.608† 0.422 0.745
Weight-bearing lunge test × SEBT PL 0.001 - 0.254 0.254 0.168 - 0.085 0.401
Weight-bearing lunge test × SEBT PM - 0.032 - 0.283 0.224 0.347 0.107 0.549
Weight-bearing lunge test × Score total SEBT 0.181 - 0.076 0.416 0.096 - 0.157 0.338
Step-Down test × SEBT A - 0.026 - 0.278 0.229 - 0.295 - 0.507 - 0.048
Step-Down test × SEBT PL - 0.129 -0.371 0.129 0.058 - 0.195 0.303
Step-Down test × SEBT PM - 0.075 -0.323 0.183 - 0.081 - 0.324 0.173
Step-Down test × Score total SEBT - 0.327 -0.536 -0.079 0.099 - 0.154 0.341
Note: SEBT: Star excursion balance test; A: Anterior; PL: posterolateral; PM: posteromedial; *P value = .008; †P value= .001.
Source: Research data.
(Conclusion)
Discussion
Our study compared and correlated reach mea
-sures on the SEBT, the Step-down test and the Weight-bearing lunge test between amateur basketball play
-ers and non-athletes. We observed that there was no difference between the groups BG and CG for Weight-bearing lunge test and Step-down test. On the other hand, the SEBT final score was higher for the BG when compared with the CG, regardless of the side of dominance and age. This result demon
-strates that the BG has a better balance during the SEBT when compared with the CG, which confirms that basketball athletes have a better neuromuscu
-lar control than non-athletes. This is justified by the fact that this group performs an activity that requires changing directions, jumping and running (21, 22).
The non-dominant side showed higher values than
the dominant side, regardless of group and age, for
the SEBT anterior reach. This result may have been obtained by a learning effect, since all SEBT evalu
-ations were performed initially with the dominant leg to standardize the evaluation. One of the possible explanations is that the majority of jumping move
-ments performed during the throws occur in one foot on the contralateral leg to the dominant upper limb, thus providing a better neuromuscular control in the non-dominant leg (23). The prevalent use of one of the lower limbs may be related to the type of task being performed, either holding, kicking or maintain
-ing the stand-ing posture (24, 25). This implies that there are different behaviors between the dominant and non-dominant limbs when performing motor actions (26).
In sports and physical activities, the athlete should
have a single-leg support base for gestures and
move-ments that occur. Given this situation, the use of tests with single-leg support with the objective of measur
-ing postural stability becomes important and justi
-fied, either at the clinic or in the sports research area (27).
Besides the functional applicability of such tests, there is also a reduction in the number of peripheral sensory sources and muscular strategies that com
-pensate for peripheral deficiencies (4).In a clinical scenario, the convenience of clinical tests when com
-paring or examining bilateral differences in cases of unilateral orthopedic injury contributes further to the applicability of the single-leg tests to determine the capacity of postural control.
Our results also showed a significant difference in the SEBT posterolateral and posteromedial reaches between the age groups 12-14 and 15-18, supporting the difference in the maturation of the SSM found in the literature. A possible explanation may be the fact that the sensory system develops at different rates in children and teenagers (12, 13).In the literature,
studies have reported that the somatosensory func
-tion matures between 3-4 years old (28 -30), but oth
-er authors report between 9-12 years old. For vision (31), maturing time also varies according to the lit
326
like the Weight-bearing lunge test, or laboratory mea
-sures like three-dimensional motion analysis.
Conclusion
The study showed that the balance is better in individuals who practice basketball when compared to people who do not practice this sport. Older teens have a better balance control of the SEBT posterome
-dial and posterolateral reach.
Acknowledgements
The authors thank CAPES (Coordination for the
Improvement of Higher Education Personnel) for the financial support that enabled the development of this study and Felipe Filomeno for allowing data collection at Club Athletico Paulistano.
References
1. NFHS ASSOCIATIONS. 2011-2012 High school athlet -ics participation survey [cited 2013 Mar 27]. Available from: http://www.nfhs.org/content.aspx?id=3282. 2. Hoang QB, Mortazavi M. Pediatric overuse injuries in
sports. Adv Pediatr. 2012;59(1):359-83.
3. Fong DT, Hong Y, Chan LK, Yung PS, Chan KM. A sys -tematic review on ankle injury and ankle sprain in sports. Sports Med. 2007;37(1):73-94.
4. Riemann BL, Lephart SM. The Sensorimotor System, Part I: The Physiologic Basis of Functional Joint Stabil -ity. J Athl Train.2002;37(1):71-9.
5. Delahunt E. Peroneal reflex contribution to the de -velopment of functional instability of the ankle joint. Phys Ther Sport. 2007;8(2):98-104.
6. Hoch MC, McKeon PO. Peroneal reaction time and an -kle sprain risk in healthy adults: a critically appraised topic. J Sport Rehabil. 2011;20(4):505-11.
7. Holmes A, Delahunt E. Treatment of common deficits associated with chronic ankle instability. Sports Med. 2009;39(3):207-24.
Previous studies agree that vestibular function has a slower development among the three sensory systems, and its maturing time varies. Some research -ers reported that it is developed at the age of seven
(34),while others reported that it is fully developed at 15 -16 (28, 30, 35).Thus, the maturation time of the
three sensory systems for balance remains uncertain. According to the above mentioned, postural con
-trol is under development in the two age groups analyzed in this study but, due to the fact that the basketball group performs an activity that requires more of that system, it presents a better performance when compared to the control group.
Our study found correlation between the Weight-bearing lunge test and the SEBT anterior reach dis
-tance in the BG at the ages of 12-14 and in the CG at the ages of 15-18. This shows that, the higher the ankle dorsiflexion in closed kinetic chain, the better the performance on the SEBT anterior reach. Previous studies using goniometry as an assessment for the ankle dorsiflexion, and not Weight-bearing lunge test, had demonstrated that ankle ROM is not related to the SEBT (36).Ours and Hoch et al.’s findings (11) contradict these studies, because the correlation be
-tween the SEBT and goniometry is not appropriate, since the latter is performed in an open kinetic chain, while SEBT in a closed kinetic chain.
Therefore, our results provide evidence that me
-chanical deficiencies in ankle function are probably related to changes in the functional movement pat
-terns and may influence the occurrence of injuries in basketball. Furthermore, there is evidence that the dorsiflexion ROM is an important factor in the landing mechanisms and in the functional movement patterns (37), making its evaluation extremely important.
Limitations of the Study
The kinematic analysis in our study was made observing movements in the sagittal plane only. There are combinations of multiplanar movements that may occur during the three SEBT reaches which could not be quantified in this study. Rotations of the hip and trunk may have influenced the test.
327
19. Piva SR, Fitzgerald K, Irrgang JJ, Jones S, Hando BR, Browder DA, et al. Reliability of measures of im -pairments associated with patellafemoral pain syn -drome. BMC Musculoskelet Disord. 2006;7:33.
20. Harput G, Soylu AR, Ertan H, Ergun N. Activation of selected ankle muscles during exercises performed on rigid and compliant balance platforms. J Orthop Sports Phys Ther. 2013;43(8):555-9.
21. Bressel E, Yonker JC, Kras J, Heath EM. Comparison of static and dynamic balance in female collegiate soc -cer, basketball, and gymnastics athletes. J Athl Train. 2007;42(1):42-6.
22. Gerbino PG, Griffin ED, Zurakowski D. Comparison of standing balance between female collegiate dancers and soccer players. Gait Posture. 2006;26(4):501-7. 23. Marchetti, PH. Investigações sobre o controle motor
e postural nas assimetrias em membros inferiores [dissertation]. São Paulo: Universidade de São Paulo; 2009. Portuguese.
24. Gabbard C, Hart S. A question of foot dominance. J Gen Psychol. 1996;123(4):289-96.
25. Maupas E, Paysant J, Martinet N, André J. Asymmetric leg activity in healthy subjects during walking, de -tected by electrogoniometry. Clin Biomech (Bristol, Avon). 1999;14(6):403-11.
26. Zverev YP. Spatial parameters of walking gait and foot -edness. Ann Hum Biol. 2006;33(2):161-76.
27. Riemann BL, Schmitz R. The relationship between various modes of single leg postural control assess -ment. Int J Sports Phys Ther. 2012;7(3):257-66. 28. Cumberworth VL, Patel NN, Rogers W, Kenyon GS. The
maturation of balance in children. J Laryngol Otol. 2007;121(5):449-54.
29. Hirabayashi S, Iwasaki Y. Developmental perspective of sensory organization on postural control. Brain Dev. 1995;17(2):111-3.
30. Steindl R, Kunz K, Schrott-Fischer A, Scholtz AW. Effect of age and sex on maturation of sensory sys -tems and balance control. Dev Med Child Neurol. 2006;48(6):477-82.
31. Riach CL, Hayes KC. Maturation of postural sway in young children. Dev Med Child Neurol.
1987;29(5):650-8. 8. Vaes P, Duquet W, van Gheluwe B. Peroneal reaction
times and eversion motor response in healthy and unstable ankles. J Athl Train. 2002;37(4):475-80. 9. Vicenzino B, Branjerdporn M, Teys P, Jordan K. Initial
changes in posterior talar glide and dorsiflexion of the ankle after mobilization with movement in individuals with recurrent ankle sprain. J Orthop Sports PhysTher. 2006;36(7):464-71.
10. Gabbe BJ, Finch CF, Wajswelner H, Bennell KL. Pre -dictors of lower extremity injuries at the commu -nity level of Australian football. Clin J Sport Med. 2004;14(2):56-63.
11. Hoch MC, Staton GS, McKeon PO. Dorsiflexion range of motion significantly influences dynamic balance. J Sci Med Sport. 2011;14(1):90-2.
12. Woollacott MH, Shumway-Cook A. Changes in posture control across the life span – a systems approach. Phys Ther. 1990;70(12):799-807.
13. Woollacott MH, Shumway-Cook A. Maturation of feed -back control of posture and equilibrium. In: Fedrizzi E, Avanzini G, Crenna P, editors. Motor development in children. London: John Libbey & Co.; 1994. 14. R Development Core Team. R: a language and
environ-ment for statistical computing. Vienna: R Foundation for Statistical Computing. [cited 2012 Nov 1]. Avail -able from: http://tinyurl.com/ne2wkgm.
15. Bennell KL, Talbot RC, Wajswelner H, Techovanich W, Kelly DH, Hall AJ. Intra-rater and inter-rater reli -ability of a weight-bearing lunge measure of ankle dorsiflexion. Aust J Physiother. 1998;44(3):175-80. 16. Plisky PJ, Gorman PP, Butler RJ, Kiesel KB, Underwood
FB, Elkins B. The reliability of an instrumented device for measuring components of the star excursion bal -ance test. N Am J Sports PhysTher. 2009;4(2):92-9. 17. Filipa A, Byrnes R, Paterno MV, Myer GD, Hewett TE.
Neuromuscular training improves performance on the star excursion balance test in young female ath -letes. J Orthop Sports PhysTher. 2010;40(9):551-8. 18. Kinzey SJ, Armstrong CW. The reliability of the
328
36. Gribble PA, Hertel J. Considerations for normalizing measures of the Star Excursion Balance Test. Meas Phys Educ Exer Sci. 2003;7(2):89-100.
37. Fong CM, Blackburn JT, Norcross MF, McGrath M, Padua DA. Ankle-dorsiflexion range of motion and landing biomechanics. J Athl Train. 2011;46(1):5-10.
Received in 05/23/2014 Recebido em 23/05/2014
Approved in 07/28/2016 Aprovado em 28/07/2016 32. Cherng RJ, Chen JJ, Su FC. Vestibular system in per
-formance of standing balance of children and young adults under altered sensory conditions. Percept Mot Skills. 2001;92(3 Pt 2):1167-79.
33. Cherng RJ, Lee HY, Su FC. Frequency spectral charac -teristics of standing balance in children and young adults. Med Eng Phys. 2003;25(6):509-15.
34. Shumway-Cook A, Woollacott MH. Development of postural control. In: Shumway-Cook A, Woollacott MH, editors. Motor control translating research into clini -cal practice. 3rd ed. Philadelphia: Lippincott Williams and Wilkins; 2007.