Quim. Nova, Vol. 33, No. 2, 377-383, 2010
Artigo
*e-mail: [email protected]
LOSARTAN POTASSIUM DISSOLUTION TEST FOR DRUG RELEASE EVALUATION IN PHARMACEUTICAL CAPSULES USING HPLC AND UV SPECTROPHOTOMETRY
Rudy Bonilio*, Taciane Ferreira Mendonça, Gislaine Ribeiro Pereira e Magali Benjamim de Araújo
Departamento de Farmácia, Universidade Federal de Alfenas, Rua Gabriel Monteiro da Silva, 700, 37130-000 Alfenas - MG, Brasil César Ricardo Teixeira Tarley
Departamento de Ciências Exatas, Universidade Federal de Alfenas, Rua Gabriel Monteiro da Silva, 700, 37130-000 Alfenas - MG, Brasil
Recebido em 15/4/09; aceito em 27/7/09; publicado na web em 11/1/10
This work describes the development and validation of a dissolution test for 50 mg losartan potassium capsules using HPLC and UV spectrophotometry. A 24 full factorial design was carried out to optimize dissolution conditions and potassium phosphate buffer, pH 6.8 as dissolution medium, basket as apparatus at the stirring speed of 50 rpm and time of 30 min were considered adequate. Both dissolution procedure and analytical methods were validated and a statistical analysis showed that there are no signiicant differences between HPLC and spectrophotometry. Since there is no oficial monograph, this dissolution test could be applied for quality control routine.
Keywords: losartan potassium; full factorial design; dissolution.
INTRODUCTION
The quality assurance of pharmaceutical products is a wide-ranging concept covering all matters that individually or collectively inluen-ce the quality of a product. In this sense, the importaninluen-ce of in vitro dissolution tests for immediate release solid oral dosage forms, such as tablets and capsules must be highlighted, since they are essential to evaluate the lot-to-lot quality of a drug product, to guide development of new formulations and to ensure continuing product quality and performance after certain changes, such as changes in the formulation, the manufacturing process, the site of manufacture, and the scale-up of the manufacturing process.1 Although immediate release solid dosage
forms are routinely subjected to tests such as content uniformity, weight, hardness, friability and disintegration, the test that is most often associa-ted with the assessment of in vivo performance is the dissolution test.2
Therefore, undoubtedly, there is a real need to develop dissolution tests for pharmaceutical products to assure the quality and to attend the regulatory demands.
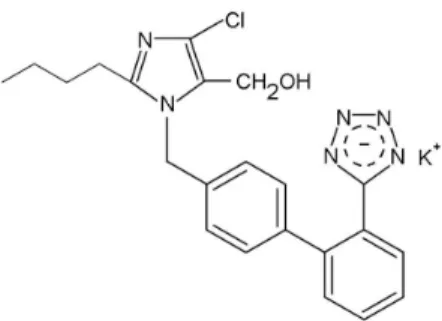
Losartan potassium (Figure 1), 2-butyl-4-chloro-1-[p-(o-1H -tetra-zol-5-ylphenyl)benzyl] imidazole-5-methanol monopotassium salt,3
was the irst of a new class of orally active, non-peptide angiotensin II receptor (type AT1) antagonist for the treatment of hypertension. Losartan has been demonstrated to be superior to previous peptide receptor antagonists and angiotensin converting enzyme (ACE) inhi-bitors because of its enhanced speciicity, selectivity and tolerability.4,5
Losartan potassium has a molecular weight of 461; a pKa value of 4.9; an aqueous solubility of 3.3 mg mL-1 at pH 7.8 6 and exhibits highly
variable and low oral bioavaiability (approximately 33%).7,8 Losartan
is, therefore, considered class 3 in the biopharmaceutics classiication system, because it has high solubility and low permeability.
Several analytical methods have been applied to the analysis of lo-sartan potassium in biological luids using high performance liquid chro-matography technique (HPLC).9-13 For applications in pharmaceutical
products there are methods that make use of HPLC,14-22 high performance
thin layer chromatography (HPTLC),23,24 capillary electrophoresis (CE),
capillary electrochromatography (CEC)25 and spectrophotometry.26-28
Recently, the literature presents the employment of the HPLC for bioe-quivalence studies of tablets containing losartan potassium.29,30
At the best of our knowledge, there is no dissolution tests descri-bed in literature for losartan potassium in pharmaceutical capsules and not any pharmacopoeia described an oficial method. The aim of this work is to establish conditions for a dissolution test for losartan potassium capsules using a multivariate approach, to validate the test and quantitation methods, to evaluate three different commercial products and to compare HPLC and spectrophotometric methods.
The multivariate experimental design provides a reduction in the number of required experiments, is faster to implement and more cost-effective than traditional univariate approaches. Therefore, afull factorial design was found to be suitable for the purpose of this work.
EXPERIMENTAL Chemical and reagents
All reagents were of analytical grade. Potassium dihydrogenphos-phate (KH2PO4), phosphoric acid, sodium hydroxide, HPLC grade acetonitrile and hydrochloride acid were purchased from Vetec® (Rio
de Janeiro, Brazil). 98.90% purity losartan potassium salt was sup-plied by IPCA laboratories limited® (Athal, Indian). 50 mg losartan
potassium salt in capsules were supplied by three local drugstores from three different Brazilian manufactures, codiied as A, B and C. The placebo mixture used in accuracy and selectivity studies contai-ning pharmaceutical grade excipients (magnesium stearate, aerosil, sodium dodecyl sulfate, talc, starch and microcel MC-102 1) were obtained from the same local drugstores (A, B and C).
Instrumentation
Dissolution tests were performed in an Electrolab® TDT-08 L
multi bath (n=8) dissolution test system (Mumbai, India), in accor-dance with The United States Pharmacopoeia (USP) general method.3
UV visible spectrophotometer used was a Shimadzu® model
1601 (Kyoto, Japan), connected to a computer loaded with Shimadzu UVPC version 3.9 software.
The HPLC equipment used was a Shimadzu® series LC-10A
(Kyoto, Japan), consisting of a LC AVP pump, a CLASS-VP 5.02 integration system, a DGU-14 A degasser, a 7725i manual injec-tor with a 20 μL loop, (Rheodyne®, California, United States), a
SPD-10AVP integrated UV detector, a FCV-10ALVP valve, a CTO-10AVP column oven and a SCL-10 AVP controller. A Nucleosil RP8 analytical column, 5 μm particle size, 125 × 4.6 mm i.d. (Macherey Nagel®, Düren, Germany) with a guard column (20 × 4.6 mm i.d.)
was used in this study.
The following equipments were also used: digital pHmeter PA 200 (Marconi® S.A., Piracicaba, Brazil); ultrasonic Bath model
USC2800A (Unique®, São Paulo, Brazil); analytical balance model
410 (Kern®, Kern, Germany); reverse osmosis water puriier OS 10
LTH (Gehaka®, São Paulo, Brazil); vacuum iltration system
(Mil-lipore®, Bedford, United States) and disintegrator model 299-6 (Nova
Ética®, São Paulo, Brazil).
Solutions
All dissolution media used in this study (water and phosphate buffer, pH 6.8) were degassed at 41 °C in ultrasonic bath for 30 min prior to use.
A buffer potassium phosphate at pH 6.8 was prepared by adding 13.6 g of potassium dihydrogenphosphate and 224 mL of 0.2 mol L-1 sodium hydroxide in 2.0 L of water. The pH value was checked
with the pHmeter.
The stock solutions of losartan potassium were prepared in a 50 mL volumetric lask by dissolving an accurately weighed amount (27.8 mg) of losartan potassium standard (98.90% purity) in potas-sium phosphate buffer or puriied water depending on the dissolution medium used. This solution was iltered in a quantitative Vetec ilter paper. Working standard solutions were prepared immediately before use, by appropriate dilutions of the corresponding stock solutions of losartan potassium with potassium phosphate buffer or puriied water. Placebo solutions were prepared by dissolving an amount accu-rately weighed of placebo mixture (containing the same amount of the products A, B and C) in potassium phosphate buffer.
Sample solutions were prepared by putting one capsule in each vessel containing the dissolution medium (900 mL) at the temperature of 37 ± 0.5 °C. Samples were collected at the end of the speciied time and iltered in a quantitative Vetec ilter paper. For the HPLC analysis, samples were directly injected into the HPLC system. In the spectro-photometric analysis, 2.5 mL of the samples were transferred into a 25 mL volumetric lask, later completed with dissolution medium.
To avoid interference from the capsule shell in the spectropho-tometric quantitation, blank solutions were prepared by dissolving capsule shells of each brand (A, B and C) into the same medium and performed the dissolution test in the same manner as the samples. Any absorbance obtained from the blank solutions was subtracted from the absorbance of the sample solutions.
Spectrophotometric measurements
Spectra of losartan potassium standard were built in the range from 400 to 200 nm using 1 cm quartz cuvettes in the fast scan speed,
2.0 nm data interval and 2 nm bandwidth. The percentage of drug release (DR%) was assayed at the wavelength of 205 nm.
HPLC analytical procedure
The volume of injection was twenty microliters. All solutions were iltered through a 0.45 μm millex-LCR ilter before the injection in the column. The low rate was set at 1.00 mL min-1 with a mobile
phase of potassium phosphate buffer (pH 6.2; 58 mmol L-1) –
ace-tonitrile (65:35, v/v). The mobile phase was iltered under vacuum through 0.45 μm modiied hydrophillic PTFE membrane and degassed ultrasonically for 30 min prior to use. The column temperature was maintained at 35 °C. Peak areas were taken as analytical signal, with detection at 254 nm.
Sink conditions
In order to establish sinkconditions, the solubility of the drug was tested using 100 mg of losartan potassium in 300 mL of 0.1 mol L-1 HCl, 0.01 mol L-1 HCl, phosphate buffer, pH 6.8 and water.
Dissolution experiments based on factorial design of each factor
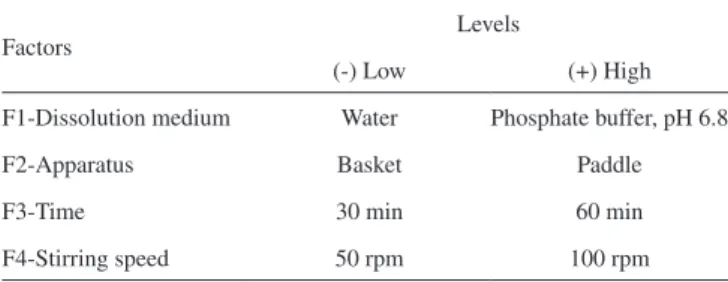
In order to evaluate the signiicance of each factor in the dissolu-tion condidissolu-tions, a 24 full factorial design was performed in duplicate
in a total of 16 experiments for each sample (A, B and C). The follo-wing parameters were investigated: dissolution medium (water and potassium phosphate buffer, pH 6.8); apparatus (basket and paddle); stirring time (30 and 60 min) and stirring speed (50 and 100 rpm). These factors and their levels are listed in Table 1.
The main effects of each studied factor and the variance of each experiment were calculated according to literature31 and the standard
variance (Sp2) of the factors was calculated via Equation 1:
(1)
where n is the number of times that the assay was repeated and s2 is
the variance obtained in each assay. After that, the variance of the effects was obtained from Equation 2:
(2)
where n is the number of assays with low (8) and high (8) levels. The error of the effects was obtained by extracting the root of the variance. By multiplying the error by the critical tn-1with 16 degree of freedom (2.120)31 for a conidence interval of 95%, it was obtained
the estimated error for each product.
Table 1. Factors and levels employed in the building of the 24 full factorial design
Factors Levels
(-) Low (+) High
F1-Dissolution medium Water Phosphate buffer, pH 6.8
F2-Apparatus Basket Paddle
F3-Time 30 min 60 min
Method validation
Selectivity
For determination of selectivity, the placebo samples and empty capsules of each product (A, B and C, respectively) were transferred to separate vessels (n =6) containing 900 mL of dissolution medium at 37 ± 0.5 °C and stirred for 60 min at 150 rpm using basket as appa-ratus. Aliquots were collected and the interference of empty capsules and placebo mixture of each formulation was evaluated by HPLC and spectrophotometry. This procedure was made according to literature.32
Linearity
Linearity was evaluated according to the ICH guidelines,33 by the
analysis of standard solutions in the inal concentrations of 30.0, 40.0, 50.0, 60.0 and 70.0 mg L-1 of losartan potassium in phosphate buffer
pH=6.8 using HPLC detection. The calibration curve using spectrophoto-metry was obtained in the inal concentrations of 3.0, 4.0, 5.0, 6.0 and 7.0 mg L-1 of losartan potassium in phosphate buffer pH=6.8. The calculation
of regression line was employed by the method of least squares.
Repeatability (intra-assay) and intermediate precision (inter-assay) of the analytical methods
The repeatability of analytical methods was validated by analysis of six standard solutions of losartan potassium dissolved in phosphate buffer pH=6.8 at the concentrations of 55.6 and 5.56 mg L-1 using
HPLC and spectrophotometry, respectively (100% levels). The intermediate precisions of methods were determined similarly but a second analyst repeated the procedure in a different day. The R.S.D values for determinations were calculated.33
Repeatability (intra-assay) and intermediate precision (inter-assay) of the dissolution procedure
The repeatability of dissolution procedure was accomplished according to literature,34 by submitting six samples of each product
(A, B and C) to the optimized dissolution test. Aliquots were col-lected and evaluated by HPLC and spectrophotometry at 205 nm. The intermediate precisions were determined similarly but a second analyst repeated the procedure in a different day. The R.S.D values for determinations were calculated.
Accuracy of the analytical methods
Accuracy of the analytical methods was carried out by the addition of losartan potassium stock standard solution to placebo mixtures A, B and C in 25 mL volumetric lasks, to obtain three inal concentration levels, corresponding to 80, 100 and 120% of target concentration of each quantitation method (HPLC and spectrophotometry). Each solu-tion was prepared in triplicate. The percent recoveries were calculated.33
Accuracy of the dissolution procedure
Accuracy of dissolution tests was determined according to lite-rature,34 by the addition of 40, 50 and 60 mg of losartan potassium
to placebo mixtures A, B and C in vessels containing 900 mL of dissolution medium (phosphate buffer, pH = 6.8). The samples were submitted to optimized dissolution test. Aliquots were collected and analyzed by HPLC and spectrophotometry at 205 nm. These studies were performed in triplicate. The percent recoveries were calculated.
Detection limit and quantitation limit
Detection limit (DL) and quantitation limit (QL) of the HPLC method were determined based on the S/N criteria, according to ICH recommendations.33 The signal-to-noise ratio was 3:1 for DL and
10:1 for QL. The noise was measured from chromatograms of blank (phosphate buffer, pH = 6.8).
The detection (DL) and quantitation (QL) limits of the UV spec-trophotometric method were obtained from the Equations 3 and 4:
DL = 3(S.D/a) (3)
QL= 10(S.D/a) (4)
where S.D. is standard deviation of the 20 spectrophotometric readin-gs of blank (phosphate buffer, pH = 6.8). and a is slope of calibration curves obtained in the linearity study.
Disintegration
All capsules formulations were subject to a disintegration test according general chapters to United States Pharmacopoeia.3 All tests
were conducted using water at 37 ± °C. Six capsules per formulation were tested.
Dissolution proiles
The dissolution proiles were obtained after determining the best dissolution condition tests as well as the validation. Potassium phosphate buffer, pH 6.8 was used as dissolution medium, basket as apparatus at the stirring speed of 50 rpm and vessel volume of 900 mL. Aliquots of 5 mL were withdrawn from each vessel and the same volume of the dissolution medium was replaced to maintain a constant total volume. The times selected were 2; 5; 10; 20; 30 and 60 min. Six samples were assayed for each product using both HPLC and spectrophotometry.
Comparison of methods
A factorial design 6×3×2 (six time points, three products and two methods) with six repetitions was used together with a statisti-cal method based on the analysis of variance (ANOVA) in order to compare the analytical methods (UV spectrophotometry x HPLC) at 0.05 signiicance level.
RESULTS AND DISCUSSION Spectrophotometric conditions
The ultraviolet spectrum for losartan potassium, in water and potassium phosphate buffer showed maximum drug absorption wave-length at 205 nm. Therefore, this wavewave-length was used for the losartan potassium spectrophotometric quantitation throughout the study.
Optimization of HPLC conditions
In the HPLC analysis, the chromatographic conditions were based on the previous work,35 in which a HPLC method for the quantitation
of losartan potassium in pharmaceutical capsules was developed and validated. In order to conirm if the chromatographic parameters are in accordance with literature,a system suitability test was carried out by injecting six replicates of a work standard solution of losar-tan potassium containing 55.5 mg L-1. The retention time was 2.92
min; theoretical plates higher than 4100; capacity factor of 2.19 and asymmetry of 1.30. The relative standard deviation of peak area was 0.96%. Thus, all parameters are in agreement to the United States Pharmacopeia recommendations.3
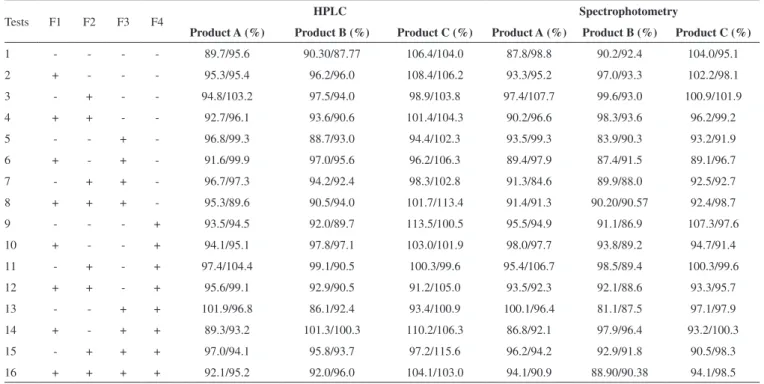
Optimization strategy of dissolution experiments
(Table 2). Taking into account the analytical responses as drug release percent (DR%), the effects of the four factors and their respective errors were calculated and are shown in Table 3. When the effects of factorial design exceed the estimated error for each product in a level of 95% of conidence interval, this effect becomes statistically signiicant.31 Furthermore, variables with positive effects indicate that
an increase of their level provides a signiicant increase in the DR % and negative effects mean that higher percentage of drug release is obtained with decrease in the levels of the variables.
Considering HPLC method, only F4 (stirring speed) was statis-tically signiicant with a negative effect (-2.78) for product A. For product B, only F4 is signiicant too, however the effect was positive (2.77). One possible explanation for this paradoxical effect is the difference of the excipients contained in each product A and B. In the case of product A, the increase of the agitation speed could have favored the interaction of its excipients with the active principle,36
resulting in a smaller analytical responses, which was not observed with product B. However, when the experiments were carried out with stirring speed of 50 rpm the drug release percent (DR%) was higher than 80% in all products (Table 2). This effect was observed due to the high aqueous solubility of losartan potassium.6 Therefore, this
factor was ixed at 50 rpm because this stirring speed is enough to assure an effective drug release of products. Moreover, a maximum discriminatory power should be obtained with lower stirring rate.36
Regarding spectrophotometric detection, F2 (apparatus) was statistically signiicant. The negative effect for both products B (-3.03) and C (-3.77) indicates that the basket is an adequate stirring apparatus. This result is in accordance with USP 30 that recommends basket apparatus for dissolution test of capsules.3
The factor F1 (dissolution mediums) is not signiicant for all pro-ducts, considering both detection methods. Therefore, both mediums (phosphate buffer pH 6.8 and water) could be used in the subsequent analysis. However, the use of water as a dissolution medium is discouraged because test conditions such as pH and surface tension can vary depending on the water source and may change during the dissolution test itself.1 For this reason, the phosphate buffer pH 6.8
was chosen as dissolution medium. The 0.1 and 0.01 mol L-1 HCl was
not used for establishment of dissolution medium because the drug was not dissolved in both solutions, and a precipitate was observed during the establishment of sink conditions.
The time of 30 min is not statistically different from 60 min. Con-sequently, the time of 30 min was chosen considering the importance
Table 2. Design matrix and experimental results obtained from the 24 fullfactorial design
Tests F1 F2 F3 F4 HPLC Spectrophotometry
Product A (%) Product B (%) Product C (%) Product A (%) Product B (%) Product C (%)
1 - - - - 89.7/95.6 90.30/87.77 106.4/104.0 87.8/98.8 90.2/92.4 104.0/95.1
2 + - - - 95.3/95.4 96.2/96.0 108.4/106.2 93.3/95.2 97.0/93.3 102.2/98.1
3 - + - - 94.8/103.2 97.5/94.0 98.9/103.8 97.4/107.7 99.6/93.0 100.9/101.9
4 + + - - 92.7/96.1 93.6/90.6 101.4/104.3 90.2/96.6 98.3/93.6 96.2/99.2
5 - - + - 96.8/99.3 88.7/93.0 94.4/102.3 93.5/99.3 83.9/90.3 93.2/91.9
6 + - + - 91.6/99.9 97.0/95.6 96.2/106.3 89.4/97.9 87.4/91.5 89.1/96.7
7 - + + - 96.7/97.3 94.2/92.4 98.3/102.8 91.3/84.6 89.9/88.0 92.5/92.7
8 + + + - 95.3/89.6 90.5/94.0 101.7/113.4 91.4/91.3 90.20/90.57 92.4/98.7
9 - - - + 93.5/94.5 92.0/89.7 113.5/100.5 95.5/94.9 91.1/86.9 107.3/97.6
10 + - - + 94.1/95.1 97.8/97.1 103.0/101.9 98.0/97.7 93.8/89.2 94.7/91.4
11 - + - + 97.4/104.4 99.1/90.5 100.3/99.6 95.4/106.7 98.5/89.4 100.3/99.6
12 + + - + 95.6/99.1 92.9/90.5 91.2/105.0 93.5/92.3 92.1/88.6 93.3/95.7
13 - - + + 101.9/96.8 86.1/92.4 93.4/100.9 100.1/96.4 81.1/87.5 97.1/97.9
14 + - + + 89.3/93.2 101.3/100.3 110.2/106.3 86.8/92.1 97.9/96.4 93.2/100.3
15 - + + + 97.0/94.1 95.8/93.7 97.2/115.6 96.2/94.2 92.9/91.8 90.5/98.3
16 + + + + 92.1/95.2 92.0/96.0 104.1/103.0 94.1/90.9 88.90/90.38 94.1/98.5
Table 3. Effects of the factors and estimated errors on the drug release percent (DR%) for products A, B and C
Method Factor Product A Product B Product C
Effects Estimated error Effects Estimated error Effects Estimated error
HPLC F1 1.11
2.48
-0.24
1.93
-0.82
2.90
F2 -0.71 0.47 -0.15
F3 -0.30 1.02 -0.19
F4 -2.78* 2.77* 1.90
Spectrophotometry F1 -0.18
3.27
1.63
2.39
-0.32
2.80
F2 -3.24 -3.03* -3.77*
F3 1.18 -0.81 0.30
F4 -3.08 2.04 0.30
The least square regression showed excellent correlation coeficients: r = 1.0000 and 0.9999 for HPLC and spectrophotometric methods, respectively. The relative standard deviation of each point (n=5) was smaller than 2%. The results meeting the acceptance criteria.33
Repeatability (intra-assay) and intermediate precision (inter-assay) of the analytical methods
The results of the repeatability (intra-assay) and intermediate precision (inter-assay) of the methods are shown in Table 4. The relative standard deviations did not exceed 2.0% for both methods, demonstrating suitable precision.37
Repeatability (intra-assay) and intermediate precision (inter-assay) of the dissolution procedure
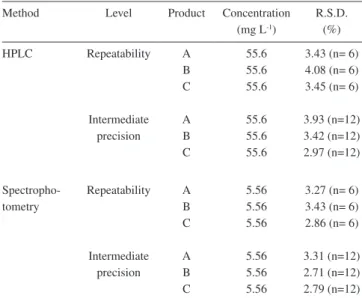
The results of the repeatability (intra-assay) and intermediate preci-sion (inter-assay) of the dissolution procedure using HPLC and spectro-photometry are shown in Table 5. The relative standard deviations did not exceed 5.0%, demonstrating suitable precision for the dissolution test.37
Accuracy of the analytical methods
The values of analytical methods accuracy for losartan potassium in all drug products are summarized in Table 6. The average values are between 98.0-102.0% for both methods, showing good recovery.37
Accuracy of the dissolution procedure
The values of dissolution procedure accuracy for losartan potas-sium in all drug products shown in Table 7 are between 95.0-105.0%, showing good recovery according to literature.37
of analytical frequency in pharmaceutical quality control laboratories. Therefore, the established conditions after 24 full factorial design
were: 900 mL of phosphate buffer, pH 6.8 at 37 °C as dissolution medium, basket as apparatus at the stirring speed of 50 rpm and collection in 30 min.
Method validation
Selectivity
Placebo formulations for products A, B and C did not present ab-sorbance at 205 nm. However, A, B and C capsule shells presented a signiicantly UV absorbance (Figure 2). For this reason, in this method one capsule shell of each product was analyzed in a separate vessel under the same optimized conditions and the absorbance value was subtracted from the sample solution absorbance to eliminate this interference.
In the HPLC method no additional chromatographic peaks from the placebo formulations and empty capsules were observed with the same retention time for losartan potassium, which demonstrates the selectivity of this method (Figure 3).
Linearity
The calibration equations obtained from HPLC and spectrophoto-metry were: peak area = 18994 [losartan potassium(mg L-1)] + 19753
and abs = 0.0891[losartan potassium (mg L-1)] – 0.0011, respectively.
Table 4. Results of precision of the HPLC and spectrophotometric analytical methods for losartan potassium in capsules
Method Level Concentration
(mg L-1) R.S.D. (%)
HPLC Repeatability 55.6 0.57 (n= 6)
Intermediate
precision 55.6 0.53 (n=12) Spectrophotometry Repeatability 5.56 0.56 (n=6)
Intermediate
precision 5.56 1.07 (n=12)
Table 5. Results of the dissolution procedure precision using HPLC and spectrophotometry for losartan potassium in capsules
Method Level Product Concentration (mg L-1)
R.S.D. (%)
HPLC Repeatability
Intermediate precision
A B C
A B C
55.6 55.6 55.6
55.6 55.6 55.6
3.43 (n= 6) 4.08 (n= 6) 3.45 (n= 6)
3.93 (n=12) 3.42 (n=12) 2.97 (n=12)
Spectropho-tometry
Repeatability
Intermediate precision
A B C
A B C
5.56 5.56 5.56
5.56 5.56 5.56
3.27 (n= 6) 3.43 (n= 6) 2.86 (n= 6)
3.31 (n=12) 2.71 (n=12) 2.79 (n=12) Figure 2. UV spectrum of losartan potassium (a), empty capsules A, B and
C (b) and placebo samples A, B and C (c), after dissolution test using basket at 150 rpm for 60 min. The aliquots were diluted 10-fold
Figure 3. Chromatogram of placebo sample of product A (a), placebo sample of product B (b), placebo sample of product C (c), empty capsule A (d), empty capsule B (e), empty capsule C (f) and a work standard solution of losartan
Table 7. Results of the dissolution procedure accuracy using HPLC and spectrophotometry for losartan potassium in capsules
Method Product
Final concentration (mg
L-1) R.S.D.
(%) n=3 Mean recovery (%) Added Found HPLC A B C A B C A B C 44.44 55.56 66.67 44.44 55.56 66.67 44.44 55.56 66.67 43.09 55.54 63.53 45.71 54.12 64.67 42.18 52.09 64.75 0.40 0.97 1.17 1.46 0.51 2.49 1.48 1.56 0.98 97.40 99.10 95.30 Spectropho-tometry A B C A B C A B C 4.44 5.56 6.67 4.44 5.56 6.67 4.44 5.56 6.67 4.47 5.58 6.78 4.71 5.67 6.90 4.40 5.64 6.55 0.98 0.68 0.54 1.84 1.48 0.27 4.49 1.65 1.24 100.9 103.8 99.6
Table 8. ANOVA data for comparative analysis of HPLC and spectrophotometric quantitation methods
Factors D. F. S. S. M. S. F P
Method 1 110.811037 110.811037 0.064 0.8003
Product 2 10470.681078 5235.340539 3.030 0.0504
M x P 2 212.578078 106.289039 0.062 0.9404
Error 210 362818.692003 1727.708057
Total 215 373612.762196
M x P: interaction between method and product; D. F.: degrees of freedom; S. S.: sum of squares; M. S.: mean square; F: F-ratio; P: P value (values above 0.05 indicates that there are no signiicant differences between treatments)
Detection limit and quantitation limit
The detection limits of the HPLC and spectrophotometric me-thods were found to be 0.013 and 0.08 mg L-1, respectively. The
quantitation limits of the HPLC and spectrophotometry were found to be 0.22 and 0.26 mg L-1, respectively. The precision experiments
at the QL level yielded R.S.D. of 2.0 and 1.9% (n = 3) for HPLC and spectrophotometric methods, respectively.
Disintegration
All formulations met the compendial requirements for capsules3
(disintegration time < 20 minutes). Disintegration times were 5 min and 11 s; 4 min and 52 s and 5 min and 35 s for products A, B and C, respectively.
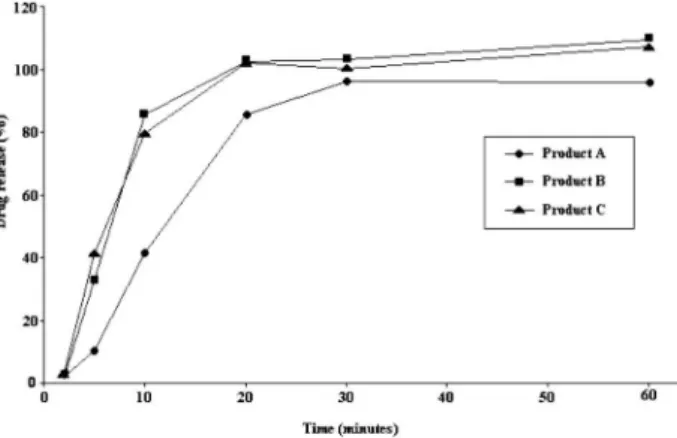
Dissolution proiles
The validated methods were used in the analysis of three losartan potassium capsules supplied from three different manufacturers. Dis-solution proiles of each product using HPLC and spectrophotometric
detection are presented in Figures 4 and 5, respectively. The results are expressed as losartan potassium concentration dissolved versus time (min). All three products tested showed >95% dissolution in 30 min. These results are in accordance to FDA,1 which recommended that
for highly soluble and rapidly dissolving drug products (BCS classes 1 and 3), a single-point dissolution test speciication of 85% in 60 min or less is suficient as a routine quality control test for batch-to-batch uniformity. Therefore, 30 min can be considered satisfactory to evaluate the release-time of losartan potassium in capsules, in agreement with the results of factorial design. So, the acceptance criterion of 85% in 30 min was established.
Comparison of methods
Table 8 presents the data obtained by ANOVA, where the analyti-cal methods were statistianalyti-cally compared. The results obtained show that there are no signiicant differences between HPLC and spec-trophotometric analytical methods as well as interactions between methods and products.
Table 6. Results of accuracy of the HPLC and spectrophotometric analytical methods for losartan potassium in capsules
Method Product
Final concentration
CONCLUSION
In this work, a dissolution test for losartan potassium in capsules was developed. Screening study using a 24 full factorial design was
conducted to select the dissolution medium, rotation speed, dissolu-tion apparatus and stirring speed. This strategy produces a reducdissolu-tion in the total number of simulations necessary to obtain a satisfactory result. The validation results demonstrated that the in vitro dissolution test using both HPLC and spectrophotometric analytical methods was accurate, precise, linear and selective. This study illustrates the importance of an oficial method for dissolution test, since there is no oficial monograph for losartan potassium in capsules.
ACKNOWLEDGEMENTS
The authors are grateful to Center of Pharmaceutical Equivalence of the Nucleus Control of Quality and the UNIFAL-MG for the inancial support. The author C. R. T. Tarley is grateful to the CNPq for fellowship. REFERENCES
1. United States Food and Drug Administration, Center for Drug Evalua-1. United States Food and Drug Administration, Center for Drug Evalua-tion and Research (CDER); Dissolution Testing of Immediate Release
Solid Oral Dosage Forms. Guidance for Industry, Rockville, 1997.
2. Dressman, J. B.; Amidon, G. L.; Reppas, C.; Shah, C. V. P.; Pharm. Res. 1998, 15, 11.
Figure 4. Dissolution proile of 50 mg capsules losartan potassium products codiied as A, B and C under optimal dissolution conditions using HPLC method
Figure 5. Dissolution proile of 50 mg capsules losartan potassium products codiied as A, B and C under optimal dissolution conditions using spectro-photometric method
3. The United States Pharmacopeia, 31thed., United States
Pharmacopoe-ial Convention: Rockville, 2008.
4. Schoenberger, J. A.; J. Hypertens.1995, 13, S43.
5. Hertzog, D. L.; McCafferty, J. F.; Fang, X.; Tyrrell, R. J.; Reed, R. A.;
J. Pharm. Biomed. Anal. 2002, 30, 747.
6. Williams, R. C.; Alasandro, M. S.; Fasone, V. L.; Boucher, R. J.; Ed-wards, J. F.; J. Pharm. Biomed. Anal.1996, 14, 1539.
7. Soldner, A.; Spahn-Langguth, H.; Mutschler, E.; Br. J. Pharmacol. 2000, 129,1235.
8. Lo, M. W.; Goldberg, M. R.; Mccrea, M. R.; Lu, H.; Furtek, C. I.; Bjornsson, T. D.; Clin. Pharmacol. Ther. 1995, 58, 641.
9. Furtek, C. I.; Lo, M. W.; J. Chromatogr., A 1992, 573, 295. 10. Lee, H.; Shim, H. O.; Lee, H. S.; Chromatographia 1996, 42, 39.
11. Yeung, P. K.; Jamieson, A.; Smith, G. J.; Fice, D.; Pollak, P. T.; Int. J. Pharm. 2000, 204, 17.
12. Kristoffersen, L.; Øiestad, E. L.; Opdal, M. S.; Krogh, M.; Lundanes, E.; Christophersen, A. S.; J. Chromatogr., B2007, 850, 147.
13. Soldner, A.; Benet, L.; Mutschler, Z. E.; Christians, U.; Br. J. Pharma-col. 2000, 129, 1235.
14. Erk, N.; J. Pharm. Biomed. Anal. 2001, 24, 603.
15. Ansari, M.; Kazemipour, M.; Khosravi, F.; Baradaran, M.; Chem. Pharm. Bull. 2004, 52, 1166.
16. Zhao, Z.; Wang, Q.; Tsai, E.; Qin, X.; Ip, D.; J. Pharm. Biomed. Anal. 1999, 20, 129.
17. Carlucci, G.; Palumbo, G.; Mazzeo, P.; Quaglia, M. G.; J. Pharm. Biomed. Anal. 2000, 23, 185.
18. Maio, V. M. P.; Dias, C. L.; Bergold, A. M.; Lat. Am. J. Pharm. 2005,
24, 250.
19. Lusina, M.; Cindri´c, T.; Tomai´c, J.; Peko, M.; Pozai´c, L.; Musulin, N.; Int. J. Pharm. 2005, 291, 127.
20. Obando, M. A.; Estela, J. M.; Cerda, V.; Anal.Bioanal. Chem. 2008,
391, 2349.
21. Seburg, R.; Ballard, J. M.; Hwang, T.; Sullivan, C. M.; J. Pharm.
Biomed. Anal.2006, 42, 411.
22. Sreekanth, N.; Shivshanker, K.; Shanmuga Pandian, P.; Roosewelt, C.; Srinivasa Rao, G.; Gunasekaran, V.; Asian J. Chem. 2007, 19,2850. 23. McCarthy, K. E.; Wang, Q.; Tsai, E. W.; Gilbert, R. E.; Ip, D. P.; Brooks,
M. A.; J. Pharm. Biomed. Anal. 1998, 17, 671.
24. Sathe, S. R.; Bari, S. B.; Acta Chromatogr. 2007, 19, 270.
25. Quaglia, M. G.; Donati, E.; Carlucci, G.; Mazzeo, P.; Fanali, S.; J.
Pharm. Biomed. Anal.2002, 29, 981.
26. Lastra, O. C.; Lemus, I. G.; Sánchez, H. J.; Pérez, R. F.; J. Pharm. Bio- Bio-med. Anal.2003, 33, 175.
27. Maggio, R. M.; Castellano, P. M.; Kaufman, T. S.; Anal. Bioanal. Chem. 2008, 391, 2949.
28. Prabhakar, A. H.; Giridhar, R.; J. Pharm.Biomed. Anal.2002, 27, 861. 29. Neves, R.; Arzneim. Forsch.2008, 58, 369.
30. Choi, Y.; J. Liq. Chromatogr. Relat. Technol.2008, 31, 2643. 31. Montgomery, D. C. Em Design and Analysis of Experiments;
Montgom-ery, D. C., ed.; Wiley: New York, 2000, p. 177-185.
32. Breier, A. R.; Paim, C. S.; Steppe, M.; Schapoval, E. E. S.; J. Pharm. Pharm. Sci.2005, 8, 289.
33. International Conference on Harmonisation (ICH); Validation of Ana lytical
Procedures: Methodology, Q2B, Consensus Guideline, 6 November 1996.
34. Azevedo, R. C. P.; Ribeiro, G. P.; Araújo, M. B.; Rev. Bras. Ciênc. Farm. 2008, 44, 261.
35. Bonilio, R.; Tarley, C. R. T.; Pereira, G. R.; Salgado, H. R. N.; Araújo, M. B.; Talanta2009, 80, 236.
36. Shah, V. P.; Gurbarg, M.; Noory, A.; Dighe, J. P.; Skelly, J. P.; J. Pharm. Sci. 1992, 81, 500.