ASSESSMENT OF THE SEISMIC BEHAVIOUR OF GONDAR CHURCH
USING A CONTINUUM DAMAGE MODEL
B. Silva
1, A. Arêde
2, J. M. Guedes
3and A. Costa
41
MSc, Dept. of Civil Engineering, FEUP, Porto. Portugal 2/3
Auxiliar Professor, Dept. of Civil Engineering, FEUP, Porto, Portugal 4
Full Professor, Dept. of Civil Engineering, FEUP, Porto, Portugal
Email: [email protected], [email protected], [email protected], [email protected] ABSTRACT :
Stone masonry elements compose a large number of constructions not only in Portugal but in many other countries. The analysis of such this type of constructions is a complex task, mainly due to the large variability of the material properties. This analysis becomes particularly important when the structures are submitted to dynamic type loads, especially seismic loads.
In this paper, an ancient Portuguese XII century church (Gondar church) located in the northern region of Portugal is analyzed using a numerical model in order to assess its structural behaviour and vulnerability when submitted to a seismic load. This analysis was performed using the finite elements program Cast3M (CEA, 1999) and considering non linear material characteristics for the masonry walls. The stone masonry behaviour was reproduced using a continuum isotropic non linear damage model originally created for concrete structures, while for the roof wooden structure a linear behaviour model was adopted. The church was tested considering a rigid foundation and submitted to its self-weight and a ground motion accelerogram matching the church site conditions. The results are presented and discussed in terms of the church deformation, damage pattern and stress state, indicating the most vulnerable zones. These types of studies highly contribute to the definition of more effective retrofitting and strengthening solutions.
KEYWORDS: Damage, Masonry, Non-linear, Seism, Cast3M, Dynamic
1. CHURCH DESCRIPTION 1.1. General description
The Gondar church (Figure 1) is a beautiful but discrete example of religious, Romanic architecture, located on the Gondar village near Amarante on the north region of Portugal. This church, also known as Gondar monastery, is in fact what’s left of a Benedict monastery founded on the XII century. After being abandoned and in ruins for many years, in 1978 the church was classified as property with public interest and it was registered on the General Directorate of Buildings and Monuments of the Northern part of Portugal (DGEMN). Architecture Heritage Inventory. At that time the church was bought by the town hall and later, during the 80’s and 90’s, the church underwent conservation and rehabilitation interventions by the DGEMN, which left it as it is presented nowadays.
Figure 1 Gondar church
1.2. Structural description
The church presents a rectangular type plant. Figure 2 indicates the dimensions of the church according to the latest survey performed by DGEMN. The church is composed by a single nave, a main arch that makes the transition to the main-chapel and a sacristy with square plant positioned on the South side of the main-chapel. There is a small bell tower on top of the south wall, close to the main façade.
The church main supporting structure is composed by two leaf stone masonry walls with an infill middle layer, this walls are approximately 1.0m thick. The church roof (Figure 3) is covered by an oak wooden structure that
supports to the outside tiles roof and it is composed by rectangular cross-section elements (0.10x0.12m2). The
support structure is composed by wood trusses spaced of 0.45m. The trusses are connected on the inside by a wooden lining 2.0cm thick; on the outside they are connected by the framework that supports the tiles. This roof structure is not self-bearing, introducing horizontal forces to the supporting lateral walls.
Figure 2 Church implantation and space description
(a) (b)
Figure 3 Church roof. (a) Outside view. (b) Schematic drawings by Augusto Costa, Director of DGEMN.
2. NUMERICAL MODEL
2.1. Geometrical characterization
The numerical model, presented in Figure 3, was created based on the geometrical survey performed during the technical inspections on the building and on the most recent topographic elements at DGEMN possession. This information was later treated through a set of steps that involved several auxiliary programs such as AutoCad (Autodesk, 2002), GiD (CIMNE, 2007) and other specially developed software, until it was ready to be introduced in the finite elements program Cast3M (CEA, 1990) used in the study.
(a)
(b)
(c) Figure 3 Numerical model of Gondar church. (a) Complete model. (b) Roof model. (c) Truss model. The masonry structure was simulated using 8 nodes volumetric elements (CUB8), while the already existing roof wooden structure was simulated using a 2 nodes bar elements (BARR). As boundary conditions, the church was considered fixed on the base. Although the foundation and the soil conditions may be relevant for the church behaviour, they weren’t considered in this study.
2.2. Mechanical characterization
2.2.1. Non linear material model (Continuum damage model) - Stone Masonry
The stone masonry material behaviour was defined through a continuum damage model based on the continuum damage mechanics, originally developed for the analysis of large dimension concrete structures such as dams and capable of reproducing the dissimilar degrading phenomena that occur under tension or
compression. This model incorporates two damage variables; one for tension (d+) and another for compression
(d-) and a plastic deformation tensor for the characterization of the non-linear concrete degradation mechanisms
under tensile and compression conditions, (Faria, 1994).
The damage variables can only assume the values between 0 and 1, Eqn. 2.1; 0 corresponds to the elastic state and it increases with the evolution of the degradation until it reaches 1 that corresponds to the collapse state.
(
,
)
1
0
≤
+ −≤
d
d
(2.1)A basic entity of such a model is the “effective stress tensor” which is split into tensile and compressive components in order to clearly distinguish the respective stress contributions. In what concerns the constitutive
X Z
law the model leads to an intuitive format for the Cauchy stress tensor Eqn. 2.2.
(
−
+)
++
(
−
−)
−=
σ
σ
σ
1
d
1
d
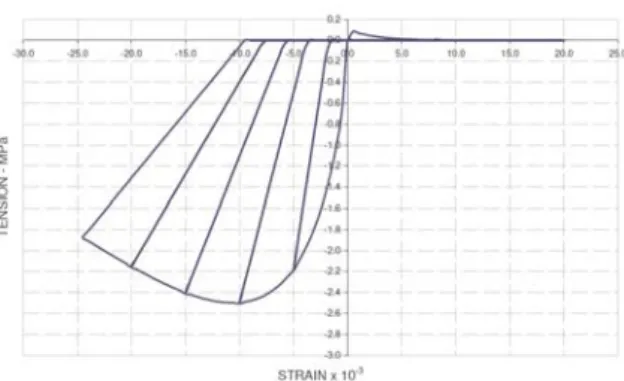
(2.2)The continuum damage model applied to the non linear mechanical behaviour of the masonry walls resulted on the axial curve presented in Figure 4. This behaviour was numerically reproduced through an extensive calibration process (Silva, 2008) based on the experimental tests (Vasconcelos, 2005).
Figure 4 Numerical material behaviour curve for stone masonry.
2.1.2. Linear material model - Roof structure and strengthening solutions
The wood elements were simulated using a linear elastic model and the mechanical characteristics presented on Table 2.2.
Table 2.2 Wood elements mechanical characteristics
Material S (m2) E (GPa) ρ (Kg\m3) ν
Oak 0.012 14.0 650.0 0.37 2.3. Load conditions
The loads used to assess the structural behaviour of the Gondar church were the permanent (Gk) and the seismic
loads (Ek). The permanent loads consisted on the weight of the stone masonry structure and on the church roof.
These loads were computed internally by the program, based on the mechanical and geometrical characteristics of the materials.
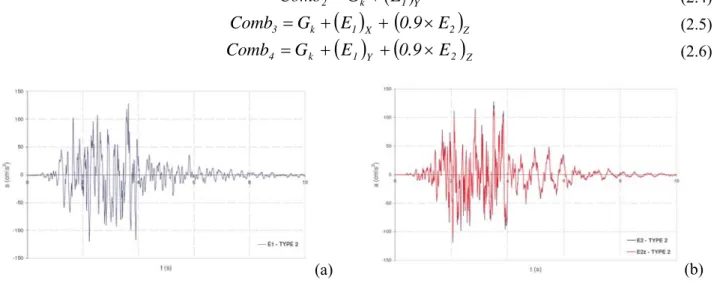
The seismic analysis was performed using type 2 artificial accelerograms (E1 and E2 – Figure 5) generated
according to the EN 1998-1:2005 (CEN, 2005) response spectrum and to the zoning proposed on the Portuguese DNA. This particular structure is located in a level 5 zone and over a medium terrain (type C),
which corresponds to a maximum reference acceleration of 80cm/s2 for a type 2 seismic action.
The accelerograms were generated using the program SIMQKE (Vanmarckle, 1969) and treated using an excel spreadsheet developed by Campos Costa (Costa, 1993) that permits the visualization of the corresponding
response spectrums and its comparison with the normalized spectrum. The accelerogram E1 was applied on
both horizontal directions (XX and YY) and E2 on the vertical direction (ZZ), according to the following load
combinations:
( )
1 X k1
G
E
( )
1 Y k 2G
E
Comb
=
+
(2.4)( )
1 X(
2)
Z k 3G
E
0
.
9
E
Comb
=
+
+
×
(2.5)( ) (
1 Y 2)
Z k 4G
E
0
.
9
E
Comb
=
+
+
×
(2.6) (a) (b)Figure 5 Artificial accelerograms. (a) E1. (b) E2 and E2z.
3. MODAL ANALYSIS
In this phase, it was performed the modal analysis of the unreinforced church model. The knowledge attained from this type of analysis is of extreme importance: it provides knowledge on the structure dynamic characteristics and it helps understanding the structure response when submitted to seismic loads. Figure 7 presents the first 10 numerical vibration modes of the stone masonry structure (red color) using the unreinforced model MSV - UR, over the initial church plant (black color).
3thmode (f = 4.5Hz) 4thmode (f = 5.2Hz) 7thmode (f = 7.7Hz) 9thmode (f = 8.6Hz) 10thmode (f = 10.1Hz) 12thmode (f = 10.5Hz) 14thmode (f = 12.3Hz) 16thmode (f = 12.5Hz) 17thmode (f = 13.4Hz) 18thmode (f = 13.8Hz) Figure 6 Modal shapes and frequencies.
X (South) Y
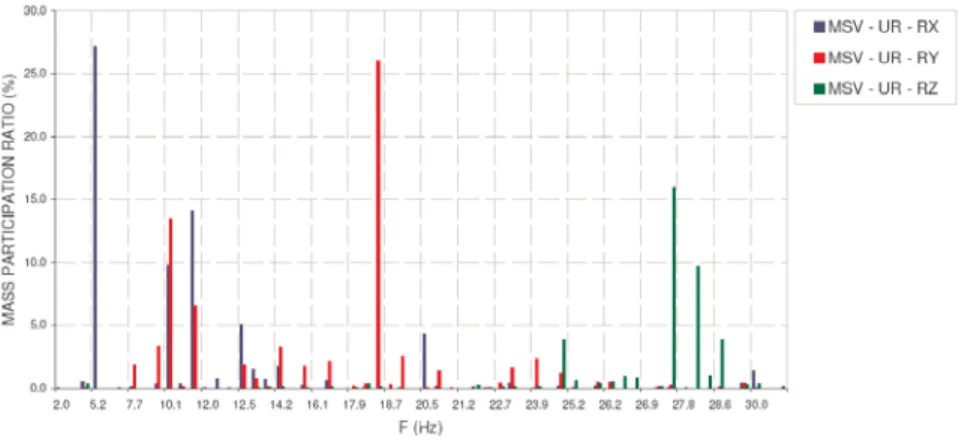
The most participative modes in each of the main directions were: in the XX direction, the 4th mode (f=5.2Hz)
and the 12th mode (f=10.5Hz), and in the YY longitudinal direction, the 10th mode (f=10.1Hz) and the 27th mode
(f=18.2Hz), Figure 7. Besides the global vibration modes with higher effective mass percentage i.e., with higher
mass participation ratios, there is the local vibration modes related to the church roof, like for example the 1st,
2nd, 5th and 6th. The deformed shape of the 4th mode illustrated in Figure 6 indicates that the church roof doesn’t give enough stiffness at the roof level, allowing the independent movement of the nave lateral walls.
Figure 7 Mass participation ratios for each of the vibration modes and the main directions (XX, YY and ZZ).
4. STATIC ANALYSIS
The seismic analysis was preceded by a static analysis that allowed representing the church initial stress and deformation state for the permanent loads. The results are illustrated in Figure 8 in terms of the principal stresses (S11 and S33) and absolute displacements.
Deformation (DispMAX = 0.28cm) S11 (S11 – MAX = 100.0kPa) S33 (S33 - MAX = -306.0kPa) Permanent Loads (a) (b) (c)
Figure 8 Absolute displacements and tensile (S11) and compression (S33) principal stresses maps for the model
MSV - UR under permanent loads.
The analysis of these results clearly indicates that the roof structure isn’t self-bearing, introducing horizontal deformations on the lateral walls, especially at the nave, pushing them to the outside and increasing their relative distance, Figure 8a. These out-of-plane flexure movements of the walls introduced by the wooden roof
are responsible by the main tensile (S11) and compression (S33) stress concentrations on the church, Figure 8b
and Figure 8c. The main tensile stress concentration appears on the nave lateral walls outer face near the roof and on the inner face of the same elements on the intersection to the nave transversal walls, while the main compression stress appear on the outer face of the nave lateral walls near the base with values up to 306.0kPa.
5. SEISMIC ANALYSIS
The seismic analysis focused on the church global behaviour. The results are represented by the envelope of the
maximum principal stresses (S11 and S33) and of the maximum absolute displacements, allowing the
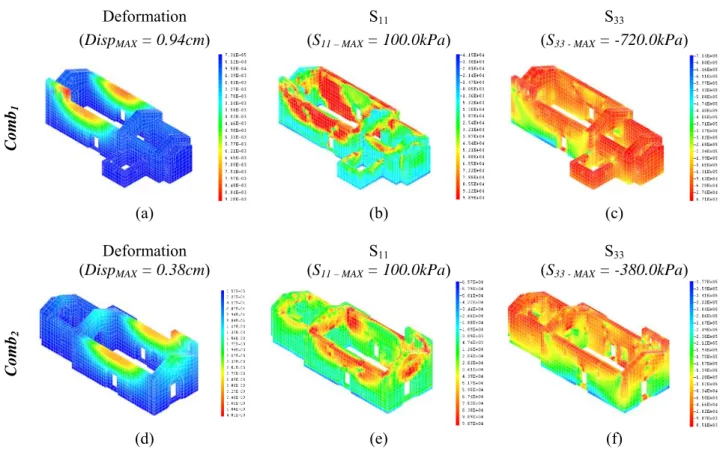
identification of the structures most critical zones, Figure 9. Deformation (DispMAX = 0.94cm) S11 (S11 – MAX = 100.0kPa) S33 (S33 - MAX = -720.0kPa) Comb 1 (a) (b) (c) Deformation (DispMAX = 0.38cm) S11 (S11 – MAX = 100.0kPa) S33 (S33 - MAX = -380.0kPa) Comb 2 (d) (e) (f)
Figure 9 Maximum absolute displacements maps and tensile (S11) and compression (S33) principal stresses
maps for the model MSV - UR under load combination Comb1.
Finally, it’s compared the church tensile damage maps (d+) of the initial state for the load combinations Comb
1
and Comb2, Figure 9. This comparison allows a better understanding of the damage progression along the
church walls.
Comb1 Comb2
(a) (b)
Figure 10 Tensile damage maps (d+) for the load combinations Comb
1 and Comb2.
essentially on same the zones already referred to the static analysis. This is mainly due to the roof influence, in this case added to the seismic load effect applied on the church XX direction, Figure 9 and Figure 10.
For Comb2, besides the expected deformation and damage concentration on the main façade, the maximum
values continue to appear on the nave lateral walls with values similar to the ones attained when considering only permanent loads (Figure 9 and Figure 10), leading us to conclude: (1) that the church geometry “prevents”
the seismic load E1Y from having an important effect on the transversal direction; (2) the roof structure, not
being self-bearing, has a major influence on the church behaviour.
Finally, the analyses were the seismic vertical load was also considered showed that, for this particular church, this component doesn’t introduce any relevant changes on the structural response when compared to the results
for combinations Comb1 and Comb2.
5. CONCLUSIONS
In this work, an old masonry church was analyzed using a numerical model in order to assess its structural behaviour and vulnerability when submitted to a seismic load. This analysis was performed using the finite elements program Cast3M (CEA, 1999) and considering non linear material characteristics for the masonry walls.
The use of a non linear continuum material damage type model points out intuitively the most vulnerable areas of the structure. The model takes into consideration the accumulative development of the structure damage (tensile and compressive damage) and provides a good perception of how the damage spreads and the stresses are redistributed.
The main tensile stresses and damage concentration appear on the nave lateral walls outer face near the roof and on the inner face of the same elements on the intersection to the nave transversal walls, while the main compression stresses and damage emerge on the outer face of the nave lateral walls near the base.
An important conclusion drawn from this analysis is that the existing roof, with no ties at the lower level has a very negative influence on the church walls for both static and dynamic loads, justifying an intervention at the roof level.
REFERENCES
Autodesk, Inc. (2002) http://usa.autodesk.com, AutoCAD. CEA (1990) Visual Cast3M - Guide d' utilisation. France.
CEN (2005) Eurocode 8: Design of structures for earthquake resistance. Part 1: (EN 1998 -1: 2005). CIMNE (2007) http://gid.cimne.upc.es/index.html, GiD.
Costa, A. P. N. C. - A acção dos sismos e o comportamento das estruturas. Porto: Faculdade de Engenharia da Universidade do Porto, 1993.
Faria, R. (1994) Avaliação do comportamento sísmico de barragens de betão através de um modelo de dano contínuo. PhD Thesis, Faculdade de Engenharia da Universidade do Porto, Departamento de Engenharia Civil, Porto, Portugal.
Silva, Bruno Q. (2008) Aplicação de um modelo de dano contínuo na modelação de estruturas de alvenaria de pedra – Igreja de Gondar um caso de estudo. MSc Thesis, Faculdade de Engenharia da Universidade do Porto, Porto, Portugal.
Vanmarckle, C. H., Cornell, C. A., Gasparini, D. A., Hou, S. N. (1969) SIMQKE - Simulation of earthquake ground motion. Cambridge, Massachusetts: MIT, USA.
Vasconcelos, G. (2005) Experimental investigations on the mechanics of stone masonry: Characterization of granites and behaviour of ancient masonry shear walls. PhD Thesis, Universidade do Minho, Guimarães, Portugal.