Development of Biocolonization Resistant Mortars: Preliminary Results
F. Henriques1, A. E. Charola2, V. Moreira Rato1 and P. Faria Rodrigues1
1Universidade Nova de Lisboa, Portugal
2WMF-P, Mosteiro dos Jerónimos, Lisbon, Portugal
Abstract
The negative impact of biocolonization on buildings, particularly rendered ones, prompted the evaluation of a hydraulic mortar formulation to which copper metal, either as a powder or as fibres, was added as a means to control this problem. The study used in situ exposure in a location prone to biocolonization for over nine years. The results have proved that over this time period, no biocolonization occurred on samples containing 0.35 % by weight of copper powder with regards to the dry mortar mix. The mortar proved to acquire a slightly bluer-green hue which diminished after the nine year outdoor exposure. The mortars formulated with copper have a lower porosity as well as a lower capillary water absorption coefficient a definite advantage for their eventual life span. On the other hand, the mechanical resistance is slightly decreased but not significantly so. Further studies are envisioned to assess the performance with other types of binder, such as aerial lime.
Keywords: Mortars, copper powder, copper fibres, biocolonization, prevention of biocolonization
Entwicklung von Mörteln mit hohem Widerstand gegen biologischen Bewuchs:
Vorläufige Ergebnisse
Zusammenfassung
Biologischer Bewuchs hat eine negative Auswirkung auf Bauwerke, insbesondere wenn diese verputzt sind. Um diesem Problem Herr zu werden, wurden hydraulische Mörtel entwickelt, denen metallisches Kupfer zugesetzt wurde, entweder als Pulver oder in Form von Fasern. In diesem Projekt wurde der Mörtel neun Jahre lang einer Umgebung ausgesetzt, die für biologischen Bewuchs förderlich war. Die Ergebnisse zeigten, dass wäh-rend dieser Zeitspanne auf Mörtel mit einem Gehalt von 0.35 % Kupferpulver bezogen auf die Masse des trok-kenen Mörtels kein biologischer Bewuchs festgestellt werden konnte. Der Mörtel hatte zunächst einen leicht blau grünen Farbton angenommen, der aber im Laufe der neunjährigen Auslagerungsdauer wieder verblasste. Die Mörtel, denen Kupfer zugesetzt war, hatten eine geringere Porosität und niedrigere kapillare Saugfähigkeit für Wasser. Das bedeutet einen entscheidenden Vorteil für die zu erwartende Lebensdauer. Andererseits ist die Festigkeit etwas aber nicht signifikant niedriger. Weiterführende Untersuchungen sind geplant, um das Verhal-ten von Mörteln mit anderem Bindemittel, wie etwa Luftkalk, zu untersuchen.
1
Introduction
The biocidal effects of some metals and their com-pounds have long been known. For example, water in tanks or wells was kept pure by throwing in a sil-ver spoon while copper sulfate as wood preservative or for the Bordeaux mixture to protect grape vines from mildew has been in use for centuries.
Biocolonization of porous inorganic materials has been shown to deteriorate the inorganic substrate, though at a relative slower rate compared to other deterioration mechanisms such as salt decay [1, 2]. Nonetheless, it should be remembered that one of the key issues of biocolonization is its negative effect on the appearance of the structure on which it grows, giving it an early appearance of decay and neglect. This is particularly evident for renders, especially those with rougher finishes and higher porosity. The addition of special components to mortars, such as aluminum oxides to increase their resistance to chlorides [3], or titanium dioxide, in its anatase form, to concrete, to accelerate the photocatalytic conversion of NOx pollutant gases thus reducing its soiling [4] prompted the idea of formulating a mor-tar that would slowly liberate metal ions thus pre-venting biocolonization on a rendered surface. The present study reports the results obtained with mortars formulated with addition of copper, as one of the most effective biocides or fungistat, tested in situ over several years.
2
Experimental
2.1 Sample Preparation
The mortars prepared for the study used as a binder Ledan C30 (Tecno Edile Toscana), an Italian
com-mercial hydraulic binder formulation, and as aggre-gate regular siliceous sand in a 1:5 ratio by weight. Copper was added to this formulation in three dif-ferent forms: as a powder with particle size < 63 µm (type P); as single 30-cm length wire, either thin (
φ
0.19 mm) or thick (φ
0.58 mm) (type I); and, as cut thin fibres, i.e., thin copper wires cut into 1-cm lengths (type F). The mortars were hand-mixed in laboratory conditions by the same person and samples of 10 x 10 x 2 cm were prepared for natural exposure. Table 1 summarizes the different formulations.Both for the control (type C) formulation with no copper and those with the maximum copper powder (P3), standard 4 x 4 x 16 cm size samples were also prepared for laboratory evaluation.
These samples were kept in a laboratory from their preparation in 1998 until 2001, when they were moved to a controlled environment room with con-stant temperature and relative humidity (20 ºC and 65 % RH) where they remained till 2007.
2.2 Sample Exposure
After curing for 28 days in the laboratory, the samples were taken out of their moulds and placed on a rack in an outdoors environment. For this purpose, the small town of Sintra, located 30 km northwest of Lisbon was chosen since its climate provides excellent conditions for biological devel-opment. Average temperatures range between 10º and 20 ºC and the relative humidity range between 77 % and 88 % respectively, the year round. Added to this are good light conditions so that lichens, algae and mosses are typical of the Sintra environment, to the point of being considered a "local patina".
Table 1: Experimental mortar (Ledan C30-sand 1:5) samples (10 x 10 x 2 cm) formulated with copper
Type Label Copper shape Weight of copper
added Percentage of copper added Copper powder P1 0.127 g 0.04 % P2 0.635 g 0.18 % P3 1.270 g 0.35 % Copper wire
If 1 thin copper wire (30 cm length)
0.090 g 0.02 %
I5f 5 thin copper wires (30 cm length)
0.450 g 0.12 %
Ig 1 thick copper wire (30 cm length)
0.673 g 0.19 %
Copper fibre
F1
cut thin copper wires (1-cm length pieces)
0.127 g 0.04 %
F2 0.635 g 0.18 %
F3 1.270 g 0.35 %
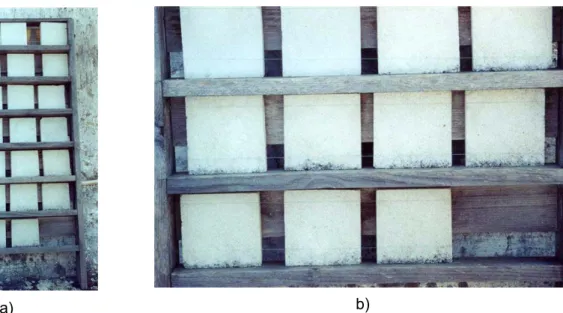
The samples were exposed at roof level in Sintra for over 8 years, from January 1999 to July 2007. They were placed vertically on a rack which protects them from water running down their surface (see Figure 1 for a photograph of the setup).
3
Results
3.1 Mechanical Testing
Mechanical testing was carried out on the 4 x 4 x 16 cm samples, both control (C) and with the maximum amount of copper powder added (P3), which had remained in a laboratory environ-ment for the nine years. Table 2 reports the results for the compressive resistance, flexural resistance and modulus of elasticity.
As can be seen, the addition of copper powder changes significantly the mechanical performance of the mortar, reducing both the compressive and the flexural resistance as well as significantly increas-ing the data dispersion for individual samples as reflected by the increased standard deviation of the averages.
3.2 Biocolonization
By 2001, after two and a half year exposure, it was seen that the samples located in the two bottom rows had started to develop biological coloniza-tion, as shown in Figure 1a and, in detail, in Figure 1b. Biocolonization was found to develop from the bottom up of the sample presumably because the wooden shelves kept moisture longer.
These samples corresponded to the three controls (C1, C2 and C3), the two samples with 1 (If1 and If2) and 5 (I5f-1 and I5t-2) thin wires, respectively, and the two with the thick wire (Ig-1 and Ig-2). These observations suggested that the rack might not have equivalent exposure at different levels and therefore the samples were moved to a more ran-dom distribution as shown in diagrammatic form in Table 4.
Two years later (July 2004) some signs of biocolo-nization appeared, particularly for the samples in the upper shelves and the three controls as shown in Figure 2.
a) b)
Figure 1: Samples photographed in 2001 (a) Original disposition of the samples on the rack after two and a half year exposure. (b) Detail of the samples in the lower shelves which developed some biocolonization.
Table 2: Mechanical testing for mortar samples with and without copper powder addition. The values are the average
from three independent samples. Standard deviation is reported between brackets.
Property/Sample
C Control
P3
0.35 % copper powder Compressive Strength (σrc) [MPa] 22.97 (0.30) 14.73 (2.49)
Flexural Strength
(σf) [MPa] 5.5 (1.2) 4.7 (0.4)
The samples that showed higher biocolonization were primarily those that had originally developed it, i.e., the controls (C), those with the single wires, thick (Ig) or thin (If) and those with the 5 thin wires (I5f), even though they had been switched around on the rack. Interestingly, one of these samples (If-1) developed a fructicose lignicole yellow lichen in the lower left corner, presumably because the sample was resting on a wooden rack.
Other samples not readily visible in the above pho-tograph but which on direct observation showed colonization were the three samples with fibres at the lower and medium concentration (F1 and F2) as well as one of the powder samples at the lowest concentration (P1-1). One of these samples (F2-1) also grew a small yellow lichen.
By April 2007, after over eight year exposure, all samples presented some degree of colonization except for the three samples with the highest con-centration of copper powder (P3). The observations can be summarized as shown in Table 5.
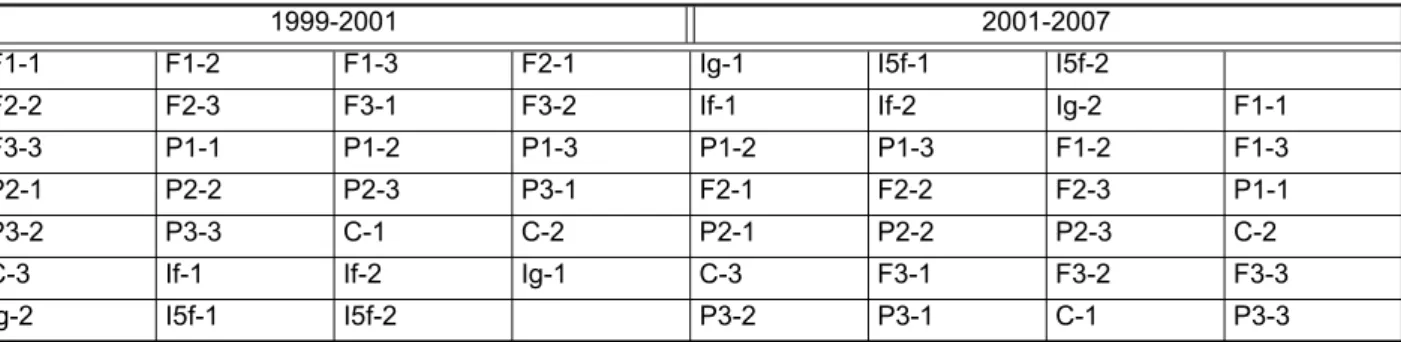
To be noted was the increase in size of the yellow lichen of sample If-1, as shown in Figure 3, while that of sample F2-1 had practically disappeared. Table 3: Diagrammatic representation of the sample location changes on the exposure rack. The original disposition
(January 1999-July 2001) is on the left and on the right the subsequent one (July 2001-April 2007). The number after the dash identifies the actual sample.
1999-2001 2001-2007
F1-1 F1-2 F1-3 F2-1 Ig-1 I5f-1 I5f-2
F2-2 F2-3 F3-1 F3-2 If-1 If-2 Ig-2 F1-1
F3-3 P1-1 P1-2 P1-3 P1-2 P1-3 F1-2 F1-3
P2-1 P2-2 P2-3 P3-1 F2-1 F2-2 F2-3 P1-1
P3-2 P3-3 C-1 C-2 P2-1 P2-2 P2-3 C-2
C-3 If-1 If-2 Ig-1 C-3 F3-1 F3-2 F3-3
Ig-2 I5f-1 I5f-2 P3-2 P3-1 C-1 P3-3
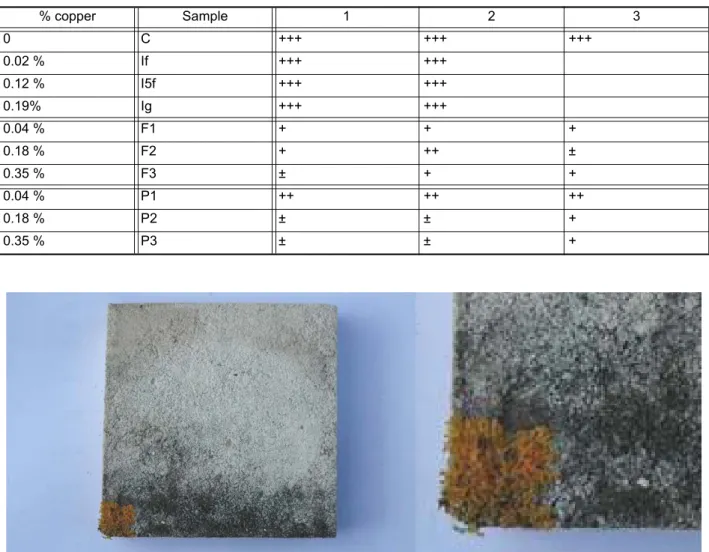
Table 4: Summary of the visual examination of the surface of samples after nearly nine years exposure: (-) traces of
biocolonization; (±) slight biocolonization; (+) significant biocolonization; (++) part of the surface covered; (+++) most of the surface covered; and, (0) no biocolonization.
% copper Sample 1 2 3 0 C ++ ++ ++ 0.02 % If ++ ++ 0.12 % I5f +++ +++ 0.19% Ig +++ ++ 0.04 % F1 + + + 0.18 % F2 + + + 0.35 % F3 ± + ± 0.04 % P1 ± ± ± 0.18 % P2 - - -0.35 % P3 0 0 0
Figure 2: Photograph of the rack with the samples exposed after four and a half years (January 1999-July 2004). Note the darker areas of biological colonization for the samples in the top two shelves.
3.3 Erosion and Roughness
The most heavily colonized samples also showed severe surface erosion, which can be attributed both to the biological attack of the samples as well as to that resulting from water run-off. Table 5 summarizes the result from a blind tactile evalua-tion of the surfaces of these samples [5].
A good correlation between roughness and biocoloni-zation was found. Only some samples showed higher roughness in correlation to the presence of biocoloni-zation. These were the three P1 samples, one P2 sam-ple (P2-3) and one P3 samsam-ple (P3-3), representing less than 2 % of the total number of samples.
3.4 Colour Changes
Visual observation of the samples kept in the labo-ratory showed that those with powdered copper (P3 type) were distinctly darker than the controls
(C). Colour measurements were taken in the CIE L*a*b* system with a colorimeter having a D65 type light source, taken at a 2º angle which corresponds to the evaluation of a circular area with a 1.6 cm diameter.
Colour measurements were taken for all the sam-ples containing copper powder (P) and, since the control samples were very rough, colour was eval-uated on two of the samples containing the lowest amount of copper fibres (type F1) since their rough-ness was similar to that of the P samples and visu-ally their colour was equivalent to that of the con-trols. Colour was also measured on samples with the maximum copper powder (P3 lab) and on con-trols (C lab) that had been kept in the laboratory for the nine years. Table 6 presents the average results of three measurements taken on each of the men-tioned samples.
Table 5: Summary of tactile evaluation of roughness developed on the exposed surface of the samples: (±) smooth;
(±) slight roughness; (+) significant roughness; (++) higher roughness; and, (+++) highest erosion and roughness. % copper Sample 1 2 3 0 C +++ +++ +++ 0.02 % If +++ +++ 0.12 % I5f +++ +++ 0.19% Ig +++ +++ 0.04 % F1 + + + 0.18 % F2 + ++ ± 0.35 % F3 ± + + 0.04 % P1 ++ ++ ++ 0.18 % P2 ± ± + 0.35 % P3 ± ± +
Figure 3: Sample IF1 in 2007 showing the growing fructicose lignicole lichen that had already developed by 2004 and detail of the lichen.
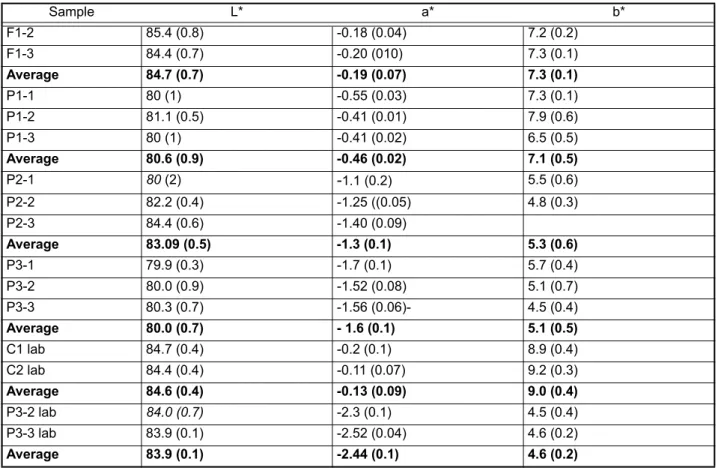
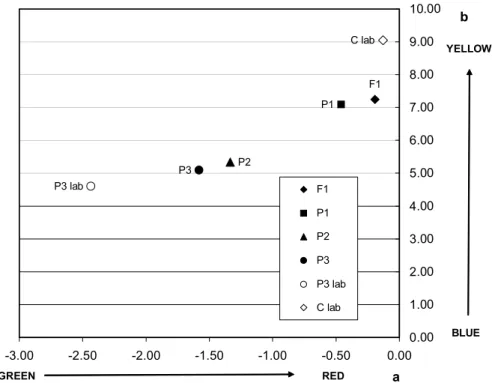
It can be seen that the L* values, which measure lightness on a scale from 0 (black) to 100 (white) are fairly close, reflecting the greyish colour of the mortars. However, there are changes for both the a* and the b* values which measure the changes from red (+) to green (-), and yellow (+) to blue (-). The plot of these data is shown in Figure 4 where it can be seen that as the copper content increases there is a change towards the blue-green colour field. Interestingly, the bluish-green hue of the copper containing mortar decreases upon weathering which could be attributed to an increase in rough-ness and therefore increased light scattering and as reflected by the decrease of the L* value from around 84 to 80.
3.5 Capillary Water Absorption
Capillary water absorption was measured on both the exposed and unexposed samples. The latter cor-respond to samples cut to 4 x 4 x 8 cm after mechanical testing. The test follows the Normal 11/85 procedure. For the case of the exposed samples, the weathered surface was used as the absorbing one.
Once the samples have reached the asymptotic value they are totally immersed in water for 24 hours. This allows the calculation of the open porosity following the ASTM C67-97 procedure. The data is summarized in Table 7.
The capillary absorption curves cannot be com-pared between the unexposed and the exposed sam-ples because of their different size and shape. But correlations can be drawn from comparison of the control (C) and the sample with the copper powder (P3) in both sets. In the first place, the presence of the copper powder reduces by about one fifth the rate at which water is absorbed. Secondly, the porosity is slightly reduced by the presence of cop-per powder but appears to be even more affected by the presence of the cut copper fibres. Finally, the presence of biocolonization appears to enhance the maximum water absorbed by capillarity as reflected by the asymptotic value obtained.
3.6 Drying Behaviour
The drying curves were registered after total immersion of the samples for 24 hours. Again, the curves obtained from the unexposed samples, C Table 6: Values for L*, a* and b* parameters for the weathered samples, where the F1 sample serves as the control,
while the P1, P2 and P3 samples have increasing amount of copper powder in them. C-lab and P3-lab correspond to the samples kept in the laboratory for the nine years. The reported values are averages of three readings for each sample and the number in brackets indicates the standard deviation. (Note: numbers in italics not included in the average since
the standard deviation did not pass the F test at 95 % confidence level)
Sample L* a* b* F1-2 85.4 (0.8) -0.18 (0.04) 7.2 (0.2) F1-3 84.4 (0.7) -0.20 (010) 7.3 (0.1) Average 84.7 (0.7) -0.19 (0.07) 7.3 (0.1) P1-1 80 (1) -0.55 (0.03) 7.3 (0.1) P1-2 81.1 (0.5) -0.41 (0.01) 7.9 (0.6) P1-3 80 (1) -0.41 (0.02) 6.5 (0.5) Average 80.6 (0.9) -0.46 (0.02) 7.1 (0.5) P2-1 80 (2) -1.1 (0.2) 5.5 (0.6) P2-2 82.2 (0.4) -1.25 ((0.05) 4.8 (0.3) P2-3 84.4 (0.6) -1.40 (0.09) Average 83.09 (0.5) -1.3 (0.1) 5.3 (0.6) P3-1 79.9 (0.3) -1.7 (0.1) 5.7 (0.4) P3-2 80.0 (0.9) -1.52 (0.08) 5.1 (0.7) P3-3 80.3 (0.7) -1.56 (0.06)- 4.5 (0.4) Average 80.0 (0.7) - 1.6 (0.1) 5.1 (0.5) C1 lab 84.7 (0.4) -0.2 (0.1) 8.9 (0.4) C2 lab 84.4 (0.4) -0.11 (0.07) 9.2 (0.3) Average 84.6 (0.4) -0.13 (0.09) 9.0 (0.4) P3-2 lab 84.0 (0.7) -2.3 (0.1) 4.5 (0.4) P3-3 lab 83.9 (0.1) -2.52 (0.04) 4.6 (0.2) Average 83.9 (0.1) -2.44 (0.1) 4.6 (0.2)
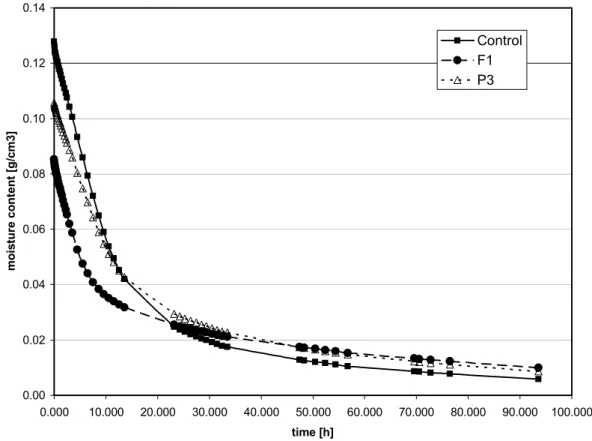
and P3, cannot be compared with the square sam-ples that were exposed, C, F1 and P3, because of their difference in shape. Particularly these exposed samples gave the most interesting drying curves, as shown in Figure 5.
It can be seen that both samples with biocoloniza-tion, C and F1, have a faster initial drying rate. This drying rate corresponds to that occurring by evapo-ration from the surface and corresponds to a capil-lary water transport in the interior of the sample. For the unexposed samples, the control also has a
faster initial drying rate than the P3 sample, as reported in Table 8 which summarizes the data for both the exposed and the unexposed samples. However, the final drying rate, which corresponds to a pure water vapour diffusion mechanism, is slightly faster for the P3 sample, and this is also the case for the unexposed samples, probably because these samples still hold more water than the control. Interestingly, the F1 sample is the one that has the highest moisture content by the time the final dry-ing rate is achieved.
Figure 4: Plot of the average a* and b* values for samples containing different amounts of copper. The samples with a higher amount of copper show an increase towards the blue-green colour.
Table 7: Data from the capillary water absorption test and subsequent total immersion for both the unexposed and
exposed samples. Capillarity water maximum refers to the asymptotical value reached during the absorption test. Standard deviation is given between brackets. Data between unexposed and exposed samples cannot be compared because of size and shape differences.
Unexposed Exposed
Sample Control P3 Control F1 P3
Weight dry sample [g] 232 (10) 221 (10) 376 (15) 353 (8) 346 (9)
Absorbing surface [cm2] 16 16 100 100 100
Capill. Abs Coeff [kg/m2*h0.5] 5.097 1.052 0.565 0.112 0.166 Capillarity water maximum [g] 23.0 (0.5) 17.7 (0.8) 25 (3) 13 (1) 19 (1) Expressed as % of dry weight 9.9 (0.4) 8.0 (0.1) 6.7 (1.1) 3.6 (0.4) 5.5 (0.3) Water absorbed 24 h immersion [g] 26.3 (0.8) 20.4 (0.9) 28 (2) 20 (1) 24.1 (0.8) Porosity % w/w 11.4 (0.7) 9.2 (0.1) 6.3 (0.9) 4.6 (0.4) 6.1 (0.2) Open porosity % v/v 20.5 15.9 14 10 12 F1 P1 P2 P3 P3 lab C lab 0.00 1.00 2.00 3.00 4.00 5.00 6.00 7.00 8.00 9.00 10.00 -3.00 -2.50 -2.00 -1.50 -1.00 -0.50 0.00 a b F1 P1 P2 P3 P3 lab C lab BLUE YELLOW GREEN RED
4
Discussion and Conclusions
The study evaluated hydraulic mortars with differ-ent amounts of elemdiffer-ental copper as well as under different physical shapes. It was found that fine copper powder, in the amount of 0.35 % by weight of the dry mortar mix (binder + aggregate) was sufficient to prevent biocolonization of the exposed surface after over nine years exposure. As reference, it should be taken into account that bio-colonization had started on the control samples after some two and a half years exposure, which correlates with data obtained in other studies [6]. The state of aggregation of the copper plays an important role since the same amount cut in thinfibres was not as effective possibly because of their lower specific surface. The erosion suffered upon exposure and, in part, through the developed biocolonization, was evaluated through surface roughness. This showed a fairly good inverse cor-relation with the amount and state of aggregation of the copper present in the sample.
However, the presence of copper changes the mechanical performance of the mortar. For exam-ple, all mechanical properties decreased when 0.35 % of copper powder was added to the mix. Compressive strength was reduced to 65 % of the original value, flexural strength was reduced to 85 %, while the elasticity modulus was the least Figure 5: Average drying curves for the exposed samples. The control samples had the highest biocolonization of
these samples, followed by the F1 samples, while the P3 showed no apparent biocolonization.
Table 8: Data from the drying behaviour of both exposed and unexposed samples. Data between unexposed and
exposed samples cannot be compared because of size and shape differences.
Unexposed Exposed
Sample Control P3 Control F1 P3
Initial drying rate [kg/m3*h] 5.59 4.46 7.05 7.51 5.35
Critical moisture content [kg/m3] 86.2 105.4 59.0 62.0 54.7
Final drying rate [kg/m3*h] 0.22 0.24 0.14 0.14 0.18
Final moisture content [kg/m3] 19.3 18.5 5.9 10.0 8.7
0.00 0.02 0.04 0.06 0.08 0.10 0.12 0.14 0.000 10.000 20.000 30.000 40.000 50.000 60.000 70.000 80.000 90.000 100.000 time [h] m o is tu re c o n te n t [g /c m3] Control F1 P3
affected being reduced only to 93 %. Considering the hydraulic nature of the binder tested and its intended use for re-pointing or bedding mortars, the observed decreases are not critical as the mechanical strengths are still clearly above those usually required. And for the case of old masonries, far beyond the type of stresses generally encountered in them.
Further testing is required to determine if similar reductions occur when other binders, such as aerial lime, are used since the performance of such mor-tars may be completely different as already reported for the case of changes in aggregate granulometry [7, 8].
One of the concerns when developing these mortars was the possible change in colour that these might suffer from the leaching of the copper. Although the colour of the mortar shifted to a blue-greener hue with increased amount of copper powder, exposure actually decreased this shift. In principle, this could be attributed to the erosion suffered during the nine years exposure although the roughness data suggest that an increased amount of copper in the mortar reduces its susceptibility to erosion. This is one of the points that need further evaluation in a future study.
Probably the most puzzling data is that obtained by testing with water. For example, the porosity of the sample with the lowest amount of thin copper fibres (F1 with 0.04 % of Cu) is 73 % of that of the control sample, while that with the highest amount of cop-per powder (P3 with 0.35 %) is only reduced to 97 %. Meanwhile, for the unexposed samples the open porosity of the P3 mix value is reduced to 81% of that of the control. But in general, the presence of copper reduces the porosity of the samples and the capillary absorption coefficient.
Another interesting result is provided by the differ-ence in water absorption between the maximum reached by capillarity and after 24 hours total immersion. For the unexposed samples, this differ-ence is about 3 g, and this is also the case for the exposed control. However, the samples containing copper have a significant increase: P3 absorbs 5 g more, while the F1 with less copper absorbs 7 g more of water. It would appear that the copper fibres influence significantly both the porosity and the pore size distribution of the mortar. The F1 sam-ple has the lowest porosity, the lowest capillary absorption coefficient - reflecting a larger amount of smaller diameter pores - and the highest number of bottle-neck pores since they require immersion before being filled with water. Meanwhile, the
con-trol samples show the highest capillary absorption rate which indicates larger pores. The reduction of this factor when copper powder is added is main-tained, whether the same is exposed or not, and this is also reflected in the open porosity decrease shown by the exposed samples (C = 11.4 to 6.3; and P3 = 9.2 to 6.1).
The drying behaviour of these mortars follows a similar pattern as discussed for absorption. The ini-tial drying rate of the mortar is reduced when pow-dered copper is added, and this is maintained upon weathering, although the control samples had more of a biofilm than the copper containing samples. The same relation is found for the critical moisture content between these samples, both in the unex-posed and the exunex-posed samples. And the final dry-ing rate is slightly higher for the copper containdry-ing samples. Although the presence of the biocoloniza-tion of these samples was evident by the character-istic smell developed during the time they were in the water absorption test, the results do not appear to indicate that this presence influences signifi-cantly the behaviour of the samples when exposed to water absorption or during the drying phase. The objective of formulating a mortar more resist-ant to biocolonization was achieved. It would appear that one of the side benefits is the reduction of both the porosity and the capillary absorption coefficient, which implies that for a given amount of rain, less water will penetrate a mortar formu-lated with copper. However, the initial drying rate is slightly reduced which means that the mortar might retain whatever moisture enters slightly longer but the differences noted appear not to be significant.
Many questions arose as a result of the exposure program and testing carried out. Further studies with improved exposure conditions are being con-templated to further elucidate the reasons for the changes in behaviour when copper, in various shapes and amounts, are added to the mortars and its effect when other types of binders, such as aerial lime, is used.
Acknowledgements
The authors would like to thank Isabel Ferreira and Dr. Amelia Dionísio for helping with the colour measurements carried out and Lic. Marcela Cedrola for identifying the type of lichen developed on two of the samples and the reason for their growth.
References
1. R. J. Koestler, P. Brimblecombe, D. Camuffo, W. Ginell, T. Graedel et al. Group Report: How
do environmental factors accelerate change?
pp. 140-163 in Durability and Change: The Science, Responsibility, and Cost of Sustaining Cultural Heritage, W. E. Krumbein, P. Brimblecombe, D. E. Cosgrove and S. Staniforth, Editors, John Wiley & Sons, Chichester (1994)
2. R. J. Koestler, Th. Warscheid, and F. Nieto,
Biodeterioration: Risk Factors and their Management, pp. 25-36 in Saving Our
Architectural Heritage. The Conservation of Historic Stone Structures, N. S. Baer and R. Snethlage, Editors, John Wiley & Sons, Chichester (1997)
3. F. Henriques and A. E. Charola,
Develop-ment of Lime Mortars with Improved Resist-ance to Sodium Chloride Crystallization,
Vol. 2 pp. 333-342, in Proceedings 9th Inter-national Congress on Deterioration and Con-servation of Stone, V. Fassina, Editor, Elsevier, Amsterdam (2000)
4. J. S. Dalton, P. A. Janes, N. G. Jones, K. R. Hallam, J. A. Nicholson and G. C. Allen,
Photocatalytic Oxydation of NOx Gases using TiO2: A Surface Spectroscopic Approach, pp.
317-327 in Understanding and Managing
Stone Decay, R. Prykryl and H. Viles, Eds., Karolinum Press, Prague (2002)
5. C. A. Grissom, A. E. Charola and
M. J. Wachowiak, Measuring Surface Roughness on Stone: Back to Basics. Studies
in Conservation 45 73-84 (2000)
6. M. Vale Anjos, A estatuária de pedra dos
jardins do Palácio Nacional de Queluz: for-mas de degradação, enquadramento, trata-mentos e avaliação. (The Stone Sculptures of the Gardens of Queluz Palace. Site Condi-tions, Degradation Forms, Treatment and Evaluation, Master Thesis) Dissertação de
Mestrado, Universidade de Évora (2006) 7. V. Moreira Rato, Influência da
microstruc-tura morfológica no comportamento de argamassas (Influence of the morphological microstructure in the behaviour of mortars,
Doctoral Thesis) Tesis Doctoral en Ingeni-ería Civil, Especialidad en Rehabilitación del Patrimonio Edificado, Faculdade de Ciencias e Tecnología, Universidade Nova de Lisboa, Lisbon (2006)
8. F. Henriques, V. M. Rato, A. E. Charola, The
influence of grain size distribution on the performance of mortars, pp.1001-1008 in:
D. Kwiatkowski and R. Löfvendahl, Eds., Proceedings 10th International Congress on the Deterioration and Conservation of Stone, ICOMOS Sweden, Stockholm, (2004)
Prof. Dr. Fernando M. A. Henriques, PhD, full professor at
the Universidade Nova de Lisboa, where he coordinates the civil engineering program. Member of the Scientific Commit-tee of World Monuments Fund (Portugal) and of the Perma-nent Scientific Committee of the International Congresses on Deterioration and Conservation of Stone.
Received October 4, 2007
Dr. A. Elena Charola obtained her doctorate in Chemistry
from the Universidad Nacional de La Plata, in her native country Argentina. She is currently an independent consultant in conservation, working primarily on various projects for WMF and serving as Scientific Advisor and Program Coordi-nator for WMF-Portugal.
She is a Visiting Scientist at the Museum Conservation Insti-tute of the Smithsonian Institution and Lecturer in Advanced Architectural Conservation at the Graduate Program of His-toric Preservation, University of Pennsylvania and Guest Lec-turer at the Raymond Lemaire Centre for Conservation, Katholieke Universiteit Leuven, Belgium.
e-mail [email protected]
Dr. Vasco Moreira Rato, PhD, is Assistant Professor at
Uni-versidade Nova de Lisboa where he lectures Building Materi-als. Main field of interest is the performance of mortars for architectural conservation, in particular the relationship between the microstructure and the water absorption by capil-larity. Email: [email protected]
Dr. Paulina Faria Rodrigues received her degree on Civil
Engineering and MSc on Construction from the Universidade Técnica de Lisboa and her PhD on Architectural Heritage Conservation from the Universidade Nova de Lisboa. She currently teaches at this University at the Materials and Con-struction Technologies Division of the Department of Civil Engineering. As a researcher she mainly works on the charac-terisation of mortars to be applied on ancient buildings.