Revista Brasileira de
Engenharia Agrícola e Ambiental
Campina Grande, PB, UAEA/UFCG – http://www.agriambi.com.br
v.21, n.11, p.746-751, 2017
Influence of physical attributes and pedotransfer function
for predicting water retention in management systems
André C. Auler
1, Luiz F. Pires
2& Maria C. Pineda
3 DOI: http://dx.doi.org/10.1590/1807-1929/agriambi.v21n11p746-751A B S T R A C T
The aims of this study were to evaluate the effects of the soil structural physical attributes on the water retention and to develop pedotransfer functions (PTFs) for the estimation of the soil water content (θ) at different matric potentials of a Dystrophic Red Latosol (Hapludox) under conventional tillage (CT) and no-tillage (NT) soil management systems. The effects of long-term CT and NT (over 25 years) management on the soil bulk density (BD), total porosity (TP), macroporosity (Ma), microporosity (Mi) and water retention were investigated. The PTFs were developed to predict θ and used to evaluate the soil water retention curve only for the NT system. The NT system was characterized by smaller values of the soil BD and higher values of the soil TP and Mi than the CT system. The NT system exhibited a higher θ retained than the CT system for the pore-size interval of 0.2–30 µm. However, the CT system exhibited a large amount of water retention for pores smaller than 0.2 µm. The PTFs were utilized to estimate θ at matric potentials of -1, -3, -6, -10, -33, -100, -400, -800, and -1,500 kPa with adequate accuracy. The soil BD, Ma, Mi and sand content were the main variables considered to estimate θ for the different matric potentials evaluated.
Atributos físicos e funções de pedotransferência
para estimativa da retenção de água em sistemas de manejo
R E S U M O
Os objetivos deste estudo foram avaliar os efeitos de atributos físicos estruturais do solo sobre a retenção de água e desenvolver funções de pedotransferência (FPT) para a estimativa de conteúdos de água (θ) em diferentes potenciais mátricos de um Latossolo Vermelho distrófico em sistema convencional (SC) e sistema plantio direto (SPD). Os efeitos de longo prazo dos manejos SC e SPD (mais de 25 anos) sobre a densidade do solo (DS), porosidade total (PT), macroporosidade (Ma), microporosidade (Mi) e retenção de água foram investigados. As FPT foram desenvolvidas para predizer os θs utilizados na determinação da curva de retenção de água apenas para o SPD. O SPD apresentou menor DS e maior PT e Mi que o SC. O SPD aumentou o conteúdo de água retido em poros de tamanho entre 0,2 e 30 µm, em relação ao SC. No entanto, o SC apresentou maior conteúdo de água retido em poros com raio menor que 0,2 µm. As FPTs utilizadas para estimar θ para os potenciais mátricos de -1, -3, -6, -10, -33, -100, -400, -800 e -1500 kPa tiveram acurácia adequada. A DS, Ma, Mi e teor de areia foram as principais variáveis consideradas para estimar o conteúdo de água nesses potenciais mátricos.
Key words: no-tillage
conventional tillage soil porosity
Palavras-chave: sistema plantio direto sistema plantio convencional porosidade do solo
1 Universidade Estadual de Ponta Grossa/Programa de Pós-Graduação em Agronomia. Ponta Grossa, PR. E-mail: aulerac@gmail.com (Corresponding author) 2 Universidade Estadual de Ponta Grossa/Departamento de Física. Ponta Grossa, PR. E-mail: lfpires@uepg.br
3 Universidad Central de Venezuela/Facultad de Agronomia. Aragua, Venezuela. E-mail: pinedamariacorina@gmail.com
Introduction
Soil structure and its physical-hydrical processes are greatly affected by the soil management (Auler et al., 2014). Among management systems, no-tillage (NT) is reported as a conservationist method with advantages over conventional tillage (CT), as the soil structure is improved by increasing the water retention (Bescansa et al., 2006).
Studies on soil water retention are essential because water availability affects crop development and yield (Fernández-Ugalde et al., 2009). The soil water-retention curve (SWRC), which is based on the relationship between the water content (θ) and the matric potential (Ψm), has been widely used to evaluate the soil water retention properties (Pires et al., 2017).
The SWRC is traditionally measured by establishing a series of thermodynamic equilibria between the water in the soil sample and the water at chosen matric potentials. However, this is usually time-consuming, which may affect the quality of the results because the samples undergo constant manipulation and spend a long time inside the pressure chambers (Dane et al., 2002).
An alternative method that overcomes these shortcomings is the use of pedotransfer functions (PTFs) to predict θ for different Ψm values according to other physical attributes, such as the bulk density (BD), total porosity (TP), macroporosity (Ma), microporosity (Mi), and textural classes (Machado et al., 2008; Michelon et al., 2010). The idea behind the PTFs is the evaluation of more laborious physical attributes using other less laborious ones for reference (Botula et al., 2014).
Therefore, the aims of this study were (i) to evaluate the effects of the soil structural physical attributes on the water retention and (ii) to develop PTFs for the estimation of the soil water content at different matric potentials of a Hapludox under NT.
Material and Methods
The study was performed in the Experimental Station of the Agricultural Research Institute of Paraná (IAPAR) in Ponta Grossa, PR, Brazil (25°13’ S; 50° 01’ W; 875 m above sea level). According to the Brazilian System of Soil Classification (Santos et al., 2013) and Soil Taxonomy (Soil Survey Staff, 2013), the soil studied is classified as Dystrophic Red Latosol (Hapludox), respectevely. According to Koppen’s classification, the Ponta Grossa region has a humid subtropical climate (Cfb), with mild summers. The average air temperature, rainfall, and relative humidity are 18 °C, 1,542 mm year-1, and 77% (IAPAR, 2009).
Two soil-management systems were investigated in the experimental macro-plots of IAPAR: NT and CT. The NT and CT areas were approximately 10,000 and 6,000 m2, respectively.
The hydrometer method was employed to evaluate the soil texture (CT: 630 g kg-1 clay, 250 g kg-1 silt, 120 g kg-1 sand; NT:
650 g kg-1 clay, 240 g kg-1 silt, 110 g kg-1 sand).
In 2009, before the crop winter sowing, 36 undisturbed soil samples were collected at the soil surface layer (0-0.10 m) of each soil management in a transection 48 m long for NT and 24 m long for CT. Stainless-steel volumetric rings (0.05 × 0.05 m - external diameter and height) were utilized for sampling.
NT and CT management was performed in the experimental areas for more than 25 years. The crop rotation included oat, vetch, or wheat in the autumn-winter season and maize or soybean in the spring-summer season. For CT, before the autumn-winter crop sowing and spring-summer crop sowing, the soil was plowed by employing a disk plow up to 0.25 m deep. After each plowing operation, the leveling harrowing was executed.
The undisturbed soil samples were saturated by the capillary rise method and subjected to the following matric potentials: -1 to -10 kPa in a suction table (model M1-0801, Eijkelkamp®) and -33, -100, -400, -800, and -1,500 kPa in Richards chambers (model 1500, Soil Moisture Equip. Corp.®). After thermodynamic equilibrium was reached, the masses of the undisturbed samples were evaluated using a precision analytical balance, and then the samples were dried under forced air circulation oven (105 °C for 48 h).
Afterwards, the soil bulk density (BD) and volumetric water contents (θ) were measured. The total porosity (TP) was determined according to the relationship between the BD and the particle density (PD), which was measured using the pycnometer method (Dane et al., 2002). The microporosity (Mi) was determined considering θ = -6 kPa, and Ma was determined according to the difference between TP and Mi (Dane et al., 2002).
The PTFs were developed to estimate θ for Ψm values of -1, -3, -6, -10, -33, -100, -400, -800, and -1,500 kPa for the soil under NT. An exploratory analysis of the data was performed to evaluate the distribution, central tendency, statistical dispersion, and presence of outliers. The Tukey statistic method was employed to identify the outliers, and a non-parametric Kolmogorov-Smirnov test was utilized to assess the data-set normality.
Pearson linear correlation analysis was applied to the data. Finally, a multivariate linear regression analysis was performed using the SPSS statistical software (Green & Salkind, 2010), aiming to estimate θ for each Ψm measured. The aforementioned soil attributes (BD, PD, TP, Mi, and Ma) were used as independent variables in the last step. Only the attributes with the largest r values were considered.
The trend of the PTFs was evaluated according to the coefficient of determination (R2), root-mean-square error
(RMSE), and mean error (ME) between the observed and predicted θ values.
The SWRCs for the measured and estimated data were adjusted by using the Genuchten (1980) mathematical model, with the Mualem (1986) restriction. The SWRC Fit software was utilized to perform the SWRC data adjustments (Seki, 2007).
According to the fitted SWRCs, the pore-size distribution (PSD) was calculated through the derivation of the SWRCs (dθ/ dΨm). A simplification of the Laplace equation was performed to determine the equivalent porous radius (r = 149/Ψm) (Ψm in kPa) (Cássaro et al., 2011).
test was employed, and the Tukey test was applied to multiple comparisons. Additionally, Pearson linear-correlation analyses were performed to identify the correlation between the θ retained for different pore sizes (0.2, 30, and 149 µm) and the soil structural physical attributes. The R software (version 3.3.1) was utilized for the statistical analyses (R Core Team, 2016).
Aiming to classify the correlations, the coefficient of Pearson (r) was divided into five ranges: (i) 0.00 < r < 0.19, very weak; (ii) 0.20 < r < 0.39, weak; (iii) 0.40 < r < 0.69, moderate; (iv) 0.70 < r < 0.89, strong; and (v) 0.90 < r < 1.00, very strong (Gujarati, 2006).
Results and Discussion
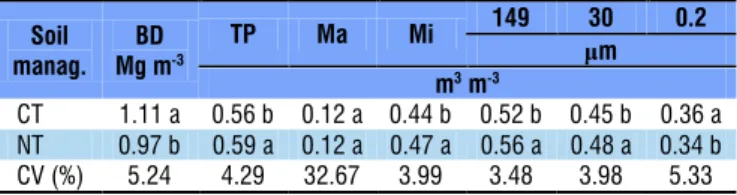
Soil management systems are significantly affected by some soil structural attributes. CT exhibited a higher BD and, consequently, a smaller TP compared with NT. The Mi had the same tendency as the TP, and the Ma did not differ significantly between the management systems (Table 1). The results for the BD, TP and Mi are ascribed to: (i) the increase in the crop residue and soil organic carbon at the surface layer (NT) (Hickmann & Costa, 2012) and (ii) the formation and stabilization of biopores as a consequence of the absence of the soil disturbance in NT compared with CT (Kautz, 2014). In the absence of soil tillage, the increase in the soil organic carbon and the biopores improved the soil aggregation (Fernández-Ugalde et al., 2009; Sheehy et al., 2015), making the soil less dense and more porous (Cássaro et al., 2011).
The Ma similarity between NT and CT can be explained by (i) the higher bioporosity for the soil under NT (Kautz, 2014) and (ii) the continuous disturbance of the soil under CT, which broke the soil macroaggregates and increased the Ma (Kay & Vandenbygaart, 2002).
The management system also affected the θ values measured for different pore sizes. For the pore sizes of 149 and 30 µm, NT had a higher θ retained than CT. On the other hand, for the pore size of 0.2 µm, CT had a higher θ retained (Table 1). The water retention results are ascribed to the Ma and Mi results (Table 1), considering that pores 149 and 30 µm in size are considered macropores and mesopores, respectively, and pores 0.2 µm in size are micropores (Sasal et al., 2006).
The correlation analysis validates the results of the amount of water retained for the different pore sizes (Table 2). Comparing the soil management systems, NT exhibited higher correlations than CT. The BD exhibited a negative correlation (weak for CT and strong for NT) for the θ retained at the pore size of 149 µm, and positive correlations were observed for pore sizes of 30 and 0.2 µm. The correlations between the BD and
the 30-µm pore size were strong for CT and moderate for NT, and those between the BD and the 0.2-µm pore size were very strong for both soil management systems (Table 2).
The Ma exhibited opposite results with respect to the BD and Mi for both soil management systems (Table 2). However, the negative correlations observed between the Ma and the 30- and 0.2-µm pore sizes were stronger than the positive correlation with the pore size of 149 µm, which was classified as moderate. Thus, an increase in the BD or Mi caused a decrease in the amount of water retained for the 149-µm pore size. Processes that lead to increases in the BD affect the distribution of large pores responsible for water infiltration (Abu & Abubakar, 2013).
The Mi had a similar and opposite correlation to BD and Ma, respectively, for both soil management systems, except for the pore-size interval of 149 µm (correlations not significant). The Mi correlations were very strong for the θ retained at the 30-µm pore size (NT and CT) and strong (CT) and moderate (NT) at the 0.2-µm pore size (Table 2). Therefore, increases in the BD increased the Mi and, consequently, a large amount of water remained retained in smaller pores (Jemai et al., 2013).
According to the similarity of the correlations between the soil management systems - with stronger correlations in NT than CT (Table 2) - PTFs were generated only for the former. The best PTFs were obtained for Ψm values of -1, -3, -6, -10, -33, -100, -400, -800, and -1,500 kPa. Then, the estimated θ values were used to build the estimated SWRC.
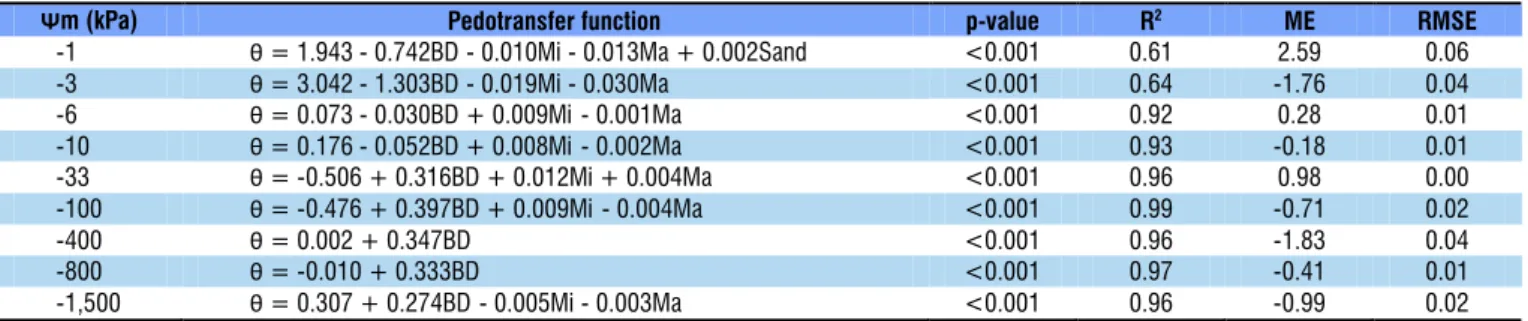
In general, the BD was the most important variable for the PTF evaluation, especially for small Ψm values (-400 and -800 kPa) (Table 3). This result might be explained by the fact that the BD - and not only the Ma and Mi - influenced the distribution of the pore sizes (Machado et al., 2008; Bo & Yulong, 2016). The PTF determined for -1 kPa Ψm was unique and characterized by a textural attribute (Table 3).
The PTFs results suggest that the soil structural physical attributes are more important for the water storage than the textural ones (Table 3) (Machado et al., 2008; Michelon et al., 2010). This occurs mainly when the soil texture undergoes a small variation (Rubio et al., 2008).
The generated PTFs confirm that the representative structural physical attributes can be used to infer θ in places where it has not been possible to measure this attribute directly for different Ψm values. However, it is important to emphasize that the PTFs should be developed regionally because PTFs are built for specific soils, according to their attributes (Botula et al., 2014).
CV - Coefficient of variation; averages (n = 36) followed by the same letter did not differ from each other by the Tukey test (p ≥ 0.05); CT - Conventional tillage; NT - No-tillage
Soil manag.
BD Mg m-3
TP Ma Mi 149 30 0.2
μm
m3m-3
CT 1.11 a 0.56 b 0.12 a 0.44 b 0.52 b 0.45 b 0.36 a NT 0.97 b 0.59 a 0.12 a 0.47 a 0.56 a 0.48 a 0.34 b CV (%) 5.24 4.29 32.67 3.99 3.48 3.98 5.33 Table 1. Bulk density (BD), total porosity (TP), macroporosity (Ma), microporosity (Mi) and water content (θ) retained at different pore sizes (149, 30, and 0.2 mm)
*p < 0.05; **p < 0.01; ns Not significant; CT - Conventional tillage; NT - No-tillage
Soil management
Soil attribute
Pore size (μm)
149 30 0.2
CT
BD -0.39* 0.78** 0.97** Ma 0.56** -0.73** -0.78** Mi -0.25ns 0.96** 0.80**
NT
The matric potentials smaller than -3 kPa had the highest R2
values and the lowest RMSE values (Table 3). The assessment of the PTFs indicated that some of them exhibited a small tendency to overestimate θ (Figure 1). The SWRCs evaluated using the measured and estimated (PTFs) values of θ did not exhibit significant differences (Figure 2A). Only small differences were observed between the SWRCs (< ± 3%) in the structural and textural regions (Figure 2B).
The differences in the SWRCs were mainly observed at high Ψm values (-1 to -3 kPa) (Figure 2B). This is ascribed to the accuracy of the PTFs for these Ψm values, which had R2
values near 0.60 (Table 3). Other soil attributes not considered for the PTFs developed here, such as organic carbon, influence the water retention for large pore sizes and, if considered, can increase R2 for -1 and -3 kPa Ψm (Yi et al., 2013). Yi et al. (2013)
observed that soil organic carbon exhibits a higher correlation (0.82, p < 0.01) with the saturation water content.
The air-filled porosity also exhibited small differences between the measured (θm) and estimated (θe) water contents (Figure 2C). For pores smaller than 50 µm, θm indicated a larger air filled porosity than θe, and the tendency was reversed for pores larger than 50 µm. These results may be explained by the underestimation of θm at saturation and overestimation for other potentials (Table 4 and Figure 1).
On the other hand, the parameters of the van Genuchten mathematical adjustment (Genuchten, 1980) differ between the θm and θe data. In this context, the SWRC adjusted with θe underestimates the parameters θs, θr, n, and m and overestimates α (Table 4). Although these distinctions did not affect the quality of the SWRC estimated in relation to the measured one (Figure 2), they did not allow an accurate analysis of the PSD based on the water-capacity function (Figure 2D).
The pore size distributions (Figure 2D) exhibited similarities in shape (estimated and measured) (Figure 2A). This result is
Table 3. Pedotransfer functions and statistical-significance parameters: p-value, coefficient of determination (R2), mean
error (ME) and root mean square error (RMSE)
Ψm (kPa) Pedotransfer function p-value R2 ME RMSE -1 θ= 1.943 - 0.742BD - 0.010Mi - 0.013Ma + 0.002Sand <0.001 0.61 2.59 0.06 -3 θ= 3.042 - 1.303BD - 0.019Mi - 0.030Ma <0.001 0.64 -1.76 0.04 -6 θ= 0.073 - 0.030BD + 0.009Mi - 0.001Ma <0.001 0.92 0.28 0.01 -10 θ= 0.176 - 0.052BD + 0.008Mi - 0.002Ma <0.001 0.93 -0.18 0.01 -33 θ= -0.506 + 0.316BD + 0.012Mi + 0.004Ma <0.001 0.96 0.98 0.00 -100 θ= -0.476 + 0.397BD + 0.009Mi - 0.004Ma <0.001 0.99 -0.71 0.02
-400 θ= 0.002 + 0.347BD <0.001 0.96 -1.83 0.04
-800 θ= -0.010 + 0.333BD <0.001 0.97 -0.41 0.01
-1,500 θ= 0.307 + 0.274BD - 0.005Mi - 0.003Ma <0.001 0.96 -0.99 0.02
Ψm - Matric potential; θ - Soil water content; BD - Bulk density; Mi - Microporosity; Ma - Macroporosity
Figure 1. Correlations between the measured (θm) and estimated (θe) water contents for the soil under no-tillage at matric
potentials of -1 (A), -3 (B), -6 (C), -10 (D), -33 (E), -100 (F), -400 (G), -800 (H), and -1,500 kPa (I)
θe= 0.54θm+ 0.32
R² = 0.61 0.57
0.59 0.61 0.63 0.65
0.52 0.54 0.56 0.58 0.60
θe
(m
3m -3)
A.
θe= 0.99θm+ 0.008
R² = 0.92 0.40
0.45 0.50 0.55 0.60
0.40 0.45 0.50 0.55 0.60 B.
θe= 1.02θm- 0.03
R² = 0.99 0.35
0.40 0.45 0.50 0.55
0.35 0.40 0.45 0.50 0.55 C.
θe= 0.94θm+ 0.07
R² = 0.97 0.37
0.41 0.45 0.49 0.53
0.37 0.41 0.45 0.49 0.53
θe
(m
3m -3)
D.
θe= 0.95θm+ 0.05
R² = 0.93 0.32
0.36 0.40 0.44 0.48
0.32 0.36 0.40 0.44 0.48 E.
θe= 0.99θm+ 0.03
R² = 0.95 0.31
0.34 0.37 0.40 0.43
0.30 0.33 0.36 0.39 0.42 F.
θe= 1.00θm+ 0.002
R² = 0.99 0.28
0.31 0.34 0.37 0.40
0.28 0.31 0.34 0.37 0.40
θe
(m
3m -3)
θm(m3m-3) G.
θe= 1.01θm- 0.006
R² = 0.99 0.26
0.29 0.32 0.35 0.38
0.26 0.29 0.32 0.35 0.38 θm(m3m-3)
H.
θe= 1.05θm- 0.03
R² = 0.97 0.24
0.27 0.30 0.33 0.36
0.26 0.29 0.32 0.35 0.38 θm(m3m-3)
I.
mainly related to the similar values of the n parameter (Table 4) (Ogunwole et al., 2015). However, the estimated distribution exhibited a shift of the most frequent pore size for large sizes. This result is mainly due to the parameter α of the mathematical adjustment, which is related to the air-entry region of the SWRC (Table 4) (Kutílek & Jendele, 2008).
In this context, the pore size distribution results show that the air-capacity function was the most sensible physical attribute for both the estimated and measured SWRCs. This result, as previously indicated, is related to the differences in the structural region of the SWRC, mainly for potentials near the air-entry region.
Conclusions
1. No-tillage increased the water retained at different pore sizes as a consequence to the reduction in the soil bulk density, in relation to the conventional tillage.
2. The pedotransfer functions depended mainly on the soil bulk density and were adequate for predicting the water retention of the Hapludox under no-tillage.
3. The pedotransfer functions should be used only to understand the water retention and air-filled porosity. They cannot be used to estimate the pore size distribution.
Literature Cited
Abu, S. T.; Abubakar, I. U. Evaluating the effects of tillage techniques on soil hydro-physical properties in Guinea Savanna of Nigeria. Soil and Tillage Research, v.126, p.159-168, 2013. https://doi. org/10.1016/j.still.2012.09.003
Auler, A. C.; Miara, S.; Pires, L. F.; Fonseca, A. F. da; Barth, G. Soil physico-hydrical properties resulting from the management in integrated production systems. Revista Ciência Agronômica, v.45, p.976-989, 2014. https://doi.org/10.1590/S1806-66902014000500013
Bescansa, P.; Imaz, M. J.; Virto, I.; Enrique, A.; Hoogmoed, W. B. Soil water retention as affected by tillage and residue management in semiarid Spain. Soil and Tillage Research, v.87, p.19-27, 2006. https://doi.org/10.1016/j.still.2005.02.028
Bo, L.; Yulong, C. Influence of dry density on soil-water retention curve of unsaturated soils and its mechanism based on mercury intrusion porosimetry. Transactions of Tianjin University, v.22, p.268-272, 2016. https://doi.org/10.1007/s12209-016-2744-5 Botula, Y-D.; Ranst, E. van; Cornelis, W. M. Pedotransfer functions
to predict water retention for soils of the humid tropics: A review. Revista Brasileira de Ciência do Solo, v.38, p.679-698, 2014. https://doi.org/10.1590/S0100-06832014000300001
Cássaro, F. A. M.; Borkowski, A. K.; Pires, L. F.; Rosa, J. A.; Saab, S. da C. Characterization of a Brazilian clayey soil submitted to conventional and no-tillage management practices using pore size distribution analysis. Soil and Tillage Research, v.111, p.175-179, 2011. https://doi.org/10.1016/j.still.2010.10.004
Dane, J. H.; Topp, C. G.; Campbell, G. S. Methods of soil analysis: Part 4 - Physical methods. Madison: Soil Science Society of America, 2002. 866p.
Fernández-Ugalde, O.; Virto, I.; Bescansa, P.; Imaz, M. J.; Enrique, A.; Karlen, D. L. No-tillage improvement of soil physical quality in calcareous, degradation-prone, semiarid soils. Soil and Tillage Research, v.106, p.29-35, 2009. https://doi.org/10.1016/j. still.2009.09.012
Genuchten, M.Th. van. A closed-form equation for predicting the hydraulic conductivity of unsaturated soils. Soil Science Society of America Journal, v.44, p.892-898, 1980. https://doi.org/10.2136/ sssaj1980.03615995004400050002x
Green, S. B.; Salkind, N. J. Using SPSS for Windows and Macintosh: Analyzing and understanding data. 6.ed. Upper Saddle River: Prentice Hall Press, 2010. 480p.
Gujarati, D. Econometria básica. 4.ed. Rio de Janeiro: Elsevier, 2006. 784p.
0.25 0.35 0.45 0.55 0.65
0.1 10 1000
θ(
m
3m
-3)
- Ψm (kPa) A.
-4.00 -2.00 0.00 2.00 4.00
0.1 10 1000
RD (%)
- Ψm (kPa) B.
0.00 0.08 0.16 0.24 0.32 0.40
1.E-01 1.E+00 1.E+01 1.E+02 1.E+03
TP
-θ
(m
3m -3)
r (µm) C.
0.0 0.2 0.4 0.6 0.8 1.0
1.E-01 1.E+01 1.E+03 1.E+05
(d
θ/
dΨ
m)
N
r (µm) D.
Figure 2. Measured (∆) and estimated (○) soil water retention curves (SWRC) (A), relative differences (RD) between the
SWRCs (θ measured as reference) (B), air-filled porosity (C), and pore size distribution (D)
Table 4. Parameters of the van Genuchten (1980) mathematical adjustment of the soil water retention curves
for the measured (θm) and estimated (θe) water contents
SWRC parameters
θs θr α
kPa-1 n m R 2
m3m-3
θm 0.595 0.275 0.786 1.300 0.231 0.998
θe 0.592 0.225 1.373 1.192 0.161 0.982 θs - Saturation soil water content; θr - Residual soil water content; α - Value of air entrance;
Hickmann, C.; Costa, L. M. da. Estoque de carbono no solo e agregados em Argissolo sob diferentes manejos de longa duração. Revista Brasileira de Engenharia Agrícola e Ambiental, v.16, p.1055-1061, 2012. https://doi.org/10.1590/S1415-43662012001000004 IAPAR - Instituto Agronômico do Paraná. Cartas climáticas do
Paraná: Classificação climática - segundo Köppen. Londrina: IAPAR, 2009. CD-Rom
Jemai, I.; Aissa, N. B.; Guirat, S. B.; Ben-Hammouda, M.; Gallali, T. Impact of three and seven years of no-tillage on the soil water storage, in the plant root zone, under a dry subhumid Tunisian climate. Soil and Tillage Research, v.126, p.26-33, 2013. https:// doi.org/10.1016/j.still.2012.07.008
Kautz, T. Research on subsoil biopores and their functions in organically managed soils: A review. Renewable Agriculture and Food Systems, v.30, p.318-327, 2014. https://doi.org/10.1017/ S1742170513000549
Kay, B. D.; Vandenbygaart, A. J. Conservation tillage and depth stratification of porosity and soil organic matter. Soil and Tillage Research, v.66, p.107-118, 2002. https://doi.org/10.1016/S0167-1987(02)00019-3
Kutílek, M.; Jendele, L. The structural porosity in soil hydraulic functions: A review. Soil and Water Research, v.3, p.7-20, 2008. Machado, J. L.; Tormena, C. A.; Fidalski, J.; Scapim, C. A.
Inter-relações entre as propriedades físicas e os coeficientes da curva de retenção de água de um Latossolo sob diferentes sistemas de uso. Revista Brasileira de Ciência do Solo, v.32, p.495-502, 2008. https://doi.org/10.1590/S0100-06832008000200004
Michelon, C. J.; Carlesso, R.; Oliveira, Z. B. de; Knies, A. E.; Petry, M. T.; Martins, J. D. Funções de pedotransferência para estimativa da retenção de água em alguns solos do Rio Grande do Sul. Ciência Rural, v.40, p.848-853, 2010. https://doi.org/10.1590/ S0103-84782010005000055
Mualem, Y. Hydraulic conductivity of unsaturated soils: Prediction and formulas. In: A. Klute (ed.). Methods of soil analysis: I. Physical and mineralogical methods. 2.ed. Madison: Soil Science Society of America, 1986. Cap.31, p.799-823.
Ogunwole, J. O.; Pires L. F.; Shehu, B. M. Changes in the structure of a Nigerian soil under different land management practices. Revista Brasileira de Ciência do Solo, v.39, p.830-840, 2015. https://doi. org/10.1590/01000683rbcs20140017
Pires, L. F.; Borges, J. A. R.; Rosa, J. A.; Cooper, M.; Heck, R.; Passoni, S.; Roque, W. L. Soil structure changes induced by tillage systems. Soil and Tillage Research, v.165, p.66-79, 2017. https://doi. org/10.1016/j.still.2016.07.010
R Core Team. R: A language and environment for statistical computing. Vienna: R Foundation for Statistical Computing, 2013. 3458p. Rubio, C. M.; Llorens, P.; Gallart, F. Uncertainty and efficiency
of pedotransfer functions for estimating water retention characteristics of soils. European Journal of Soil Science, v.59, p.339-347, 2008. https://doi.org/10.1111/j.1365-2389.2007.01002.x Santos, H. G.; Jacomine, P. K. T.; Anjos, L. H. C.; Oliveira, V. Á.;
Lumbreras, J. F.; Coelho, M. R.; Almeida, J. A.; Cunha, T. J. F.; Oliveira, J. B. Sistema brasileiro de classificação de solos. Rio de Janeiro: Embrapa Solos, 2013. 353p.
Sasal, M. C.; Andriulo, A. E.; Taboada, M. A. Soil porosity characteristics and water movement under zero tillage in silty soils in Argentinian Pampas. Soil and Tillage Research, v.87, p.9-18, 2006. https://doi. org/10.1016/j.still.2005.02.025
Seki, K. SWRC fit - A nonlinear fitting program with a water retention curve for soils having unimodal and bimodal pore structure. Hydrology and Earth System Sciences Discussions, v.4, p.407-437, 2007. https://doi.org/10.5194/hessd-4-407-2007
Sheehy, J.; Regina, K.; Alakukku, L.; Six, J. Impact of no-till and reduced tillage on aggregation and aggregate-associated carbon in Northern European agroecosystems. Soil and Tillage Research, v.150, p.107-113, 2015. https://doi.org/10.1016/j.still.2015.01.015 Soil Survey Staff. Simplified guide to soil taxonomy. Lincoln: USDA-Natural Resources Conservation Service, National Soil Survey Center, 2013. 289p.