Prot ein and Fat Deposit ion in t he Carcass of
Broilers
M ail Address
Ke yw ords Aut hor(s)
Arrived: March/2009 Approved: July/2009
ABSTRACT
An experiment was carried out to evaluate the effects of different levels of digestible lysine in the diets of male and female broilers on protein and fat deposition. A total of 2160 Avian Farms broilers. A completely randomized experimental design was applied, and treatments consisted of the effects of three digestible lysine levels nested within each sex, with 12 replicates and 30 birds per experimental unit. The adopted digestible lysine levels corresponded to 92.5, 100.0, and 107.5% of the nutritional requirements of phases 1 to 21 days, 22 to 42 days, and 43 to 56 days of age, respectively. In each phase, the experimental diets contained similar calorie and protein levels within each sex. No significant effects of lysine levels were found on dry matter and fat percentages in the carcass of birds during the evaluated periods. Also, there were no significant effects of lysine levels on protein and fat deposition in males or females. However, males presented higher protein deposition and lower fat deposition than females during the total experimental period. Gompertz equations showed that females deposit more fat and less protein than males, and that this affected the fall in the curve of protein deposition, when the curve of fat deposition was still rising. Therefore, it was concluded that the older the broilers at slaughter, the higher their body fat content and the lower their body protein content, particularly in females.
INTRODUCTION
The genetic evolution observed in the last few years allowed significant reduction of broiler market age and important increase in growth rate. During the same period, an increase in body fat content was also observed. According to Kessler (1999), high feed intake capacity of modern broiler strains and inadequate dietary balance are the main factors responsible for the increment of fat deposition presented by these birds.
According to Scheuermann et al. (1995) and Wiseman & Lewis (1998),
excessive carcass fat reduces processing yield and value of commercial cuts. In addition, the presence of fat residues in the water used during processing impairs proper effluent treatment (Mcleod, 1982). This stimulated the research on carcass quality, particularly in reduction of carcass fat content and increase in lean tissue yield (Leeson, 1995).
In practice, a certain amount of intramuscular fat is desirable to ensure chicken meat tenderness, juiciness, and flavor (Lin, 1981; Leenstra, 1986). In this sense, there is an increasing interest in the effect of nutrition on carcass traits. Among the different nutrients that may affect live performance and carcass quality, lysine seems to have the most noticeable effects. Several researchers observed that high lysine levels in broilers feeds reduce carcass fat content, and increase protein
Tavernari F de C1
Buteri CB2
Rostagno HS3
Albino LFT3
1
Post - Graduate Program in Animal Science - UFV. [email protected]
2
Escola Agrotécnica Federal de Salinas.
3
Animal Science Department - UFV.
Fernando de Castro Tavernari
Rua Dr. Milton Bandeira, n.351, apto 201 Centro
36570-000. Viçosa, MG, Brasil.
E-mail: [email protected]
Avian Farms, body composition, Gompertz equation.
This research was financially supported by Educational Commission of Hubei Province of China (Project No. D20091808). The authors would like to thank X. Guo for assistance with lutein assays.
accretion (Eits et al., 2002; Ajinomoto, 2009).
Also, the knowledge on body protein composition and accretion has allowed the establishment of animal nutritional requirements by researchers. It is well-known that genetic companies adopt different selection criteria to produce birds with different body compositions, and according to Han & Baker (1993), birds with different body compositions have different nutritional requirements. Establishing nutritional requirement equations for each genetic strain, under different rearing conditions, may allow determining these requirements faster and more efficiently as compared to experimental procedures.
The aims of this study were to investigate the effects of dietary digestible lysine levels on fat and protein deposition in carcass of male and female broilers and to adjust Gompertz equations describing male and female broiler growth and protein and fat deposition during a 56-day experimental period.
M ATERIAL AND M ETHODS
The trial was conducted at the Poultry Sector of the Animal Science Department of the Federal University of Viçosa (UFV). Average temperature recorded during the period of 1 to 21 days of age was 23.1°C (17.8 minimum and 28.3°C maximum temperatures); during the period of 22 to 42 days of age was 20.9°C (17.9 minimum and 23.9°C maximum temperatures) and 18.2°C (14.3 minimum and 22.1°C maximum temperatures) during the period of 43 to 56 days of age.
A number of 2160 one-day-old males and females Avian Farms chicks, with average initial weights of 43.8 g and 42.5 g, respectively, was used. A completely randomized experimental design was applied, and treatments consisted of the effects of three digestible lysine levels nested within each sex, with 12 replicates and 30 birds per experimental unit.
Birds were housed in a conventional poultry house, divided in 1.0 x 2.0 m pens. Wood shavings were used as litter. Birds were managed according to the recommendations of the genetic company manual (Granja Planalto, 1999). Water and feed were offered
ad libitum during the entire experiment.
Feeds were based on corn, soybean meal, and corn gluten meal, and contained three different digestible lysine levels (DL) for each rearing phase and sex. During the starter phase (1 to 21 days), males were fed diets containing 1.073 (DL1), 1.160 (DL2), and 1.247% (DL3), and females 1.018 (DL1), 1.100 (DL2), and 1.183%
(DL3) digestible lysine (Table 1). During the grower phase (22 to 42 days), males were fed 0.981 (DL1), 1.060 (DL2), and 1.140% (DL3), and females 0.925 (DL1), 1.000 (DL2), and 1.075% (DL3) digestible lysine (Table 2). During the finisher phase (43 to 56 days), males were fed 0.888 (DL1), 0.960 (DL2), and 1.032% (DL3), and females 0.833 (DL1), 0.900 (DL2), and 0.968% (DL3) digestible lysine (Table 3). DL1, DL2, and DL3 digestible lysine levels corresponded, respectively, to 92.5, 100.0, and 107.5% of the recommendations of the Brazilian Tables for Poultry and Swine (Rostagno
et al., 2000) for each rearing phase and sex.
In each phase, the experimental diets contained similar calorie and protein levels within each sex.
Body composition in dry matter, crude protein and fat, and protein and fat deposition in the carcass of male and female broilers were evaluated.
In order to determine weekly body composition, two birds per experimental unit were randomly selected, submitted to a 6 hours fasting period, weighed, and sacrificed by neck dislocation. After defeathering, carcasses were weighed to determine feather weight. A sample of the feathers was collected and stored in the freezer.
Two whole carcasses per experimental unit, with viscera and blood, were ground for 15 min in a commercial cutter, and after homogenization, a sample was collected and stored in the freezer.
When preparing for laboratory analyses, carcass and feather samples were pre-dried in a forced-ventilation oven at 60 °C for 72 hours. Due to their high fat content, carcasses were previously de-fatted using heat methodology in a SOXHLET apparatus for four hours. The pre-dried and pre-defatted samples were then ground in a knife mill, and placed in duly identified flasks for subsequent analyses.
Dry matter, protein, and fat analyses were carried out at the Animal Nutrition Laboratory of the Animal Science Department of UFV, according to the methods described by Silva (1998). A sample of 32 one-day-old chicks was also processed as described above.
Body protein and fat contents were calculated by multiplying the percentages of protein and fat by de-feathered carcass weight and feather weight obtained during the weekly weighting and sacrifice. Protein and fat depositions were calculated comparing carcass and feather compositions of the birds slaughtered at different ages.
weight, protein accretion, and fat deposition. Their derivates allowed establishing daily weight gain, protein gain, and fat gain curves. The following Gompertz equation was used:
- B . (t - C) - e
M = A . e
where: M = body or tissue weight (g); t = age (days); A = body weight or amount of tissue at mature age (g); B = maximum rate of weight gain or tissue deposition (g/day per g); C = age at maximum growth or tissue deposition (days); e = 2.718282 (base of the Neperian algorithm).
The Gauss-Newton procedure of SAEG software package (UFV, 1999) was used to determine the equation parameters.
Weight at 21 days of age was used as covariate in the analysis of variance of the 22 to 42 days period, and weight at 42 days was used for the 43 to 56 days period.
The studied parameters were statistically analyzed using SAEG (Sistema de Análises Estatísticas e Genéticas - System of Statistical and Genetic Analyses) software package, developed by Universidade Federal de Viçosa (1999). Means were compared using the test of Student Newman-Keuls (P<0.05).
RESULTS AND DISCUSSION Body com posit ion
There were no significant effects of lysine levels on dry matter or fat percentage on bird carcass during the different evaluated periods. As to protein
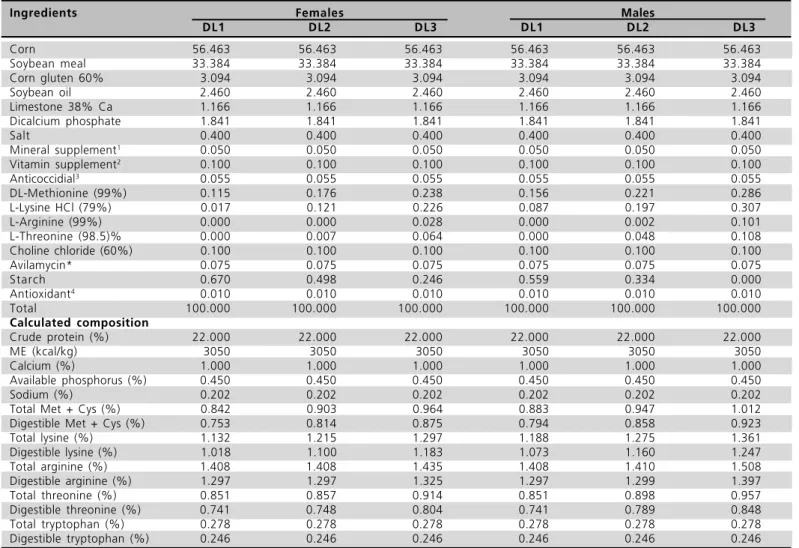
Table 1 - Percentage composition of the experimental feeds of the starter phase (1 to 21 days).
Ingredients Females Males
DL1 DL2 DL3 DL1 DL2 DL3
Corn 56.463 56.463 56.463 56.463 56.463 56.463
Soybean meal 33.384 33.384 33.384 33.384 33.384 33.384
Corn gluten 60% 3.094 3.094 3.094 3.094 3.094 3.094
Soybean oil 2.460 2.460 2.460 2.460 2.460 2.460
Limestone 38% Ca 1.166 1.166 1.166 1.166 1.166 1.166
Dicalcium phosphate 1.841 1.841 1.841 1.841 1.841 1.841
Salt 0.400 0.400 0.400 0.400 0.400 0.400
Mineral supplement1 0.050 0.050 0.050 0.050 0.050 0.050
Vitamin supplement2
0.100 0.100 0.100 0.100 0.100 0.100
Anticoccidial3
0.055 0.055 0.055 0.055 0.055 0.055
DL-Methionine (99%) 0.115 0.176 0.238 0.156 0.221 0.286
L-Lysine HCl (79%) 0.017 0.121 0.226 0.087 0.197 0.307
L-Arginine (99%) 0.000 0.000 0.028 0.000 0.002 0.101
L-Threonine (98.5)% 0.000 0.007 0.064 0.000 0.048 0.108
Choline chloride (60%) 0.100 0.100 0.100 0.100 0.100 0.100
Avilamycin* 0.075 0.075 0.075 0.075 0.075 0.075
Starch 0.670 0.498 0.246 0.559 0.334 0.000
Antioxidant4 0.010 0.010 0.010 0.010 0.010 0.010
Total 100.000 100.000 100.000 100.000 100.000 100.000
Calculated composition
Crude protein (%) 22.000 22.000 22.000 22.000 22.000 22.000
ME (kcal/kg) 3050 3050 3050 3050 3050 3050
Calcium (%) 1.000 1.000 1.000 1.000 1.000 1.000
Available phosphorus (%) 0.450 0.450 0.450 0.450 0.450 0.450
Sodium (%) 0.202 0.202 0.202 0.202 0.202 0.202
Total Met + Cys (%) 0.842 0.903 0.964 0.883 0.947 1.012
Digestible Met + Cys (%) 0.753 0.814 0.875 0.794 0.858 0.923
Total lysine (%) 1.132 1.215 1.297 1.188 1.275 1.361
Digestible lysine (%) 1.018 1.100 1.183 1.073 1.160 1.247
Total arginine (%) 1.408 1.408 1.435 1.408 1.410 1.508
Digestible arginine (%) 1.297 1.297 1.325 1.297 1.299 1.397
Total threonine (%) 0.851 0.857 0.914 0.851 0.898 0.957
Digestible threonine (%) 0.741 0.748 0.804 0.741 0.789 0.848
Total tryptophan (%) 0.278 0.278 0.278 0.278 0.278 0.278
Digestible tryptophan (%) 0.246 0.246 0.246 0.246 0.246 0.246
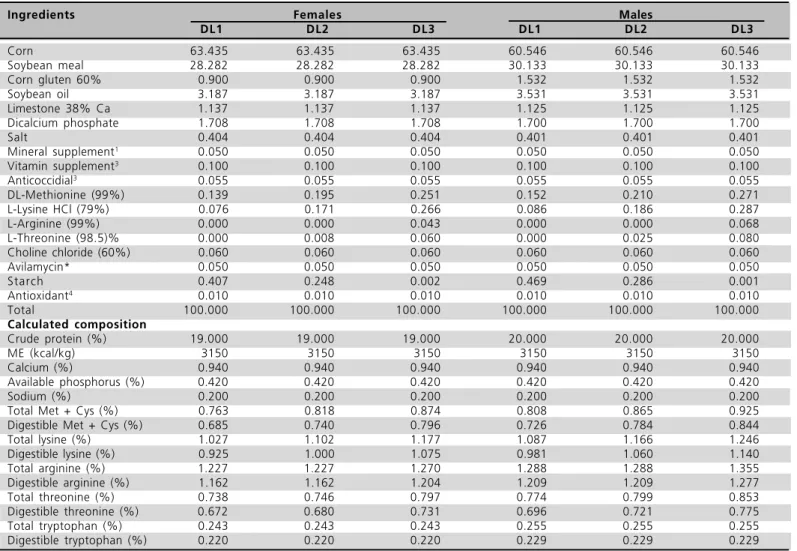
Table 2 - Percentage composition of the experimental feeds of the grower phase (22 to 42 days).
Ingredients Females Males
DL1 DL2 DL3 DL1 DL2 DL3
Corn 63.435 63.435 63.435 60.546 60.546 60.546
Soybean meal 28.282 28.282 28.282 30.133 30.133 30.133
Corn gluten 60% 0.900 0.900 0.900 1.532 1.532 1.532
Soybean oil 3.187 3.187 3.187 3.531 3.531 3.531
Limestone 38% Ca 1.137 1.137 1.137 1.125 1.125 1.125
Dicalcium phosphate 1.708 1.708 1.708 1.700 1.700 1.700
Salt 0.404 0.404 0.404 0.401 0.401 0.401
Mineral supplement1
0.050 0.050 0.050 0.050 0.050 0.050
Vitamin supplement3
0.100 0.100 0.100 0.100 0.100 0.100
Anticoccidial3
0.055 0.055 0.055 0.055 0.055 0.055
DL-Methionine (99%) 0.139 0.195 0.251 0.152 0.210 0.271
L-Lysine HCl (79%) 0.076 0.171 0.266 0.086 0.186 0.287
L-Arginine (99%) 0.000 0.000 0.043 0.000 0.000 0.068
L-Threonine (98.5)% 0.000 0.008 0.060 0.000 0.025 0.080
Choline chloride (60%) 0.060 0.060 0.060 0.060 0.060 0.060
Avilamycin* 0.050 0.050 0.050 0.050 0.050 0.050
Starch 0.407 0.248 0.002 0.469 0.286 0.001
Antioxidant4
0.010 0.010 0.010 0.010 0.010 0.010
Total 100.000 100.000 100.000 100.000 100.000 100.000
Calculated composition
Crude protein (%) 19.000 19.000 19.000 20.000 20.000 20.000
ME (kcal/kg) 3150 3150 3150 3150 3150 3150
Calcium (%) 0.940 0.940 0.940 0.940 0.940 0.940
Available phosphorus (%) 0.420 0.420 0.420 0.420 0.420 0.420
Sodium (%) 0.200 0.200 0.200 0.200 0.200 0.200
Total Met + Cys (%) 0.763 0.818 0.874 0.808 0.865 0.925
Digestible Met + Cys (%) 0.685 0.740 0.796 0.726 0.784 0.844
Total lysine (%) 1.027 1.102 1.177 1.087 1.166 1.246
Digestible lysine (%) 0.925 1.000 1.075 0.981 1.060 1.140
Total arginine (%) 1.227 1.227 1.270 1.288 1.288 1.355
Digestible arginine (%) 1.162 1.162 1.204 1.209 1.209 1.277
Total threonine (%) 0.738 0.746 0.797 0.774 0.799 0.853
Digestible threonine (%) 0.672 0.680 0.731 0.696 0.721 0.775
Total tryptophan (%) 0.243 0.243 0.243 0.255 0.255 0.255
Digestible tryptophan (%) 0.220 0.220 0.220 0.229 0.229 0.229
1 Roligomix (DSM) manganese, 60 g; iron, 80 g; zinc, 50 g; copper, 10 g; cobalt, 2 g; iodine, 1 g, and vehicle q.s.p. 500 g.2 Rovimix (DSM) -vit. A - 15,000,000 IU, -vit. D3 - 1,500,000 IU, -vit. E - 15,000 IU, -vit. B1 - 2.0 g, -vit. B2 - 4.0 g, -vit. B6 - 3.0 g, -vit. B12 - 15 mg, nicotinic acid - 25 g, pantothenic acid - 10 g, vit. K3 - 3.0 g, folic acid - 1.0 g, selenium - 250 mg, and vehicle q.s.p. - 1,000 g. 3 - Coxistac (Salinomycin 12%). 4 - BHT (Butyl hydroxi toluene). * - Surmax 2%.
composition, there were significant differences only for 42-day-old females, with no differences between those fed DL1 or DL2, which protein carcass content, however, were significantly higher than those fed DL3. These results show that a 7.5% reduction or increase in the digestible lysine levels determined by Rostagno et al. (2000) were not sufficient to cause changes in the body composition of male and female birds during the period of 1 to 56 days of age. The obtained data are consistent with those observed by Summers & Leeson (1985) and Conhalato (1998), but disagree with Kubena et al. (1972), Holsheimer (1980), Hurwitz et al. (1998), and Ajinomoto (2009).
Prot ein and f at deposit ion
No significant effect of lysine levels (P>0.05) was observed on fat deposition during the studied period (1 to 56 days). Protein deposition was influenced by
the studied lysine levels only in 6- and 7-week-old males. In 6-week-old males, DL2 e DL3 levels did not result in different protein deposition, which was, however, higher than in broilers fed DL1. On the other hand, DL1 resulted in statistically higher protein deposition than DL2 in 7-week-old birds; however, protein deposition promoted by DL3 was not different from DL1 or DL2.
Table 4 shows the daily protein and fat deposition results of 1- to 21-day-old male and female broilers as a function of digestible lysine levels.
Table 4 - Effect of digestible lysine dietary levels on daily protein (CP) and fat (FT) deposition of male and female broilers in the period of 1 to 21 days of age1.
Lysine CP (g/bird/day) FT (g/bird/day) levels2
Males Females Males Females
DL1 6.534 6.199 2.869 2.972
DL2 6.586 6.217 3.073 3.010
DL3 6.618 6.349 2.887 2.985
Mean3 6.579 A 6.255 B 2.943 2.989
CV (%) 3.01 7.75
1 - Means followed by capital letters in the same row are significantly different by the test of Student-Newman-Keuls (P<0.05). 2 - NL1 = 1.073% and 1.018%; DL2 = 1.160% and 1.100%; DL3 = 1.247% and 1.183% digestible lysine for males and females, respectively. CV (coefficient of variation).
There was no significant effect of digestible lysine level on protein or fat deposition in male or female broilers during the studied period. Males presented higher protein deposition as compared to females, but fat deposition was not different. Based on these results, it is not recommended to increase dietary lysine levels to reduce fat deposition and to increase protein deposition in 1 to 21-day-old broilers.
The absence of effects of increasing lysine levels on protein deposition during this phase was also reported by Kubena et al. (1972), with birds reared at
32.2ºC, and Summers et al. (1992) and Conhalato
(1998), who worked with diets formulated according to the ideal protein concept. Other researchers, such as Sibbald & Wolynetz (1986), Tesseraud et al. (1992),
Holsheimer & Ruensink (1993), Scheuermann et al.
(1995), Edwards et al. (1999), Eits et al. (2002), and
Ajinomoto (2009) observed that increasing lysine levels
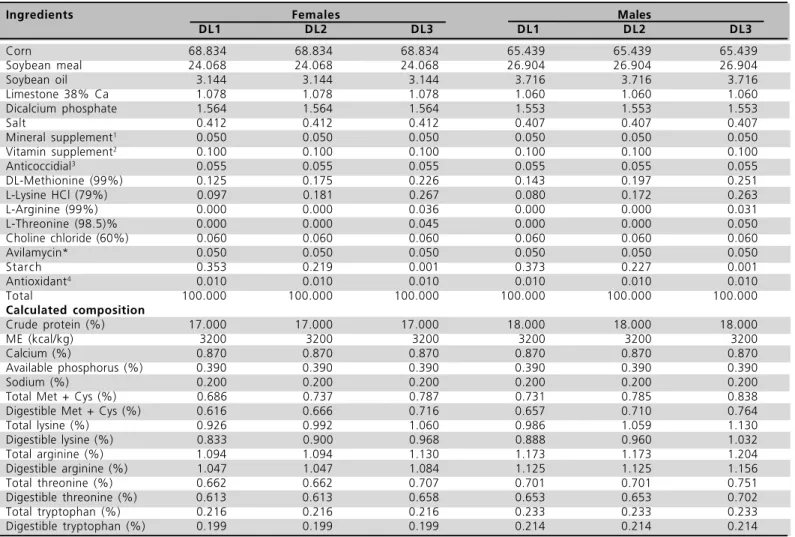
Table 3 - Percentage composition of the experimental feeds of the finisher phase (43 to 56 days).
Ingredients Females Males
DL1 DL2 DL3 DL1 DL2 DL3
Corn 68.834 68.834 68.834 65.439 65.439 65.439
Soybean meal 24.068 24.068 24.068 26.904 26.904 26.904
Soybean oil 3.144 3.144 3.144 3.716 3.716 3.716
Limestone 38% Ca 1.078 1.078 1.078 1.060 1.060 1.060
Dicalcium phosphate 1.564 1.564 1.564 1.553 1.553 1.553
Salt 0.412 0.412 0.412 0.407 0.407 0.407
Mineral supplement1
0.050 0.050 0.050 0.050 0.050 0.050
Vitamin supplement2
0.100 0.100 0.100 0.100 0.100 0.100
Anticoccidial3
0.055 0.055 0.055 0.055 0.055 0.055
DL-Methionine (99%) 0.125 0.175 0.226 0.143 0.197 0.251
L-Lysine HCl (79%) 0.097 0.181 0.267 0.080 0.172 0.263
L-Arginine (99%) 0.000 0.000 0.036 0.000 0.000 0.031
L-Threonine (98.5)% 0.000 0.000 0.045 0.000 0.000 0.050
Choline chloride (60%) 0.060 0.060 0.060 0.060 0.060 0.060
Avilamycin* 0.050 0.050 0.050 0.050 0.050 0.050
Starch 0.353 0.219 0.001 0.373 0.227 0.001
Antioxidant4
0.010 0.010 0.010 0.010 0.010 0.010
Total 100.000 100.000 100.000 100.000 100.000 100.000
Calculated composition
Crude protein (%) 17.000 17.000 17.000 18.000 18.000 18.000
ME (kcal/kg) 3200 3200 3200 3200 3200 3200
Calcium (%) 0.870 0.870 0.870 0.870 0.870 0.870
Available phosphorus (%) 0.390 0.390 0.390 0.390 0.390 0.390
Sodium (%) 0.200 0.200 0.200 0.200 0.200 0.200
Total Met + Cys (%) 0.686 0.737 0.787 0.731 0.785 0.838
Digestible Met + Cys (%) 0.616 0.666 0.716 0.657 0.710 0.764
Total lysine (%) 0.926 0.992 1.060 0.986 1.059 1.130
Digestible lysine (%) 0.833 0.900 0.968 0.888 0.960 1.032
Total arginine (%) 1.094 1.094 1.130 1.173 1.173 1.204
Digestible arginine (%) 1.047 1.047 1.084 1.125 1.125 1.156
Total threonine (%) 0.662 0.662 0.707 0.701 0.701 0.751
Digestible threonine (%) 0.613 0.613 0.658 0.653 0.653 0.702
Total tryptophan (%) 0.216 0.216 0.216 0.233 0.233 0.233
Digestible tryptophan (%) 0.199 0.199 0.199 0.214 0.214 0.214
increase body protein deposition.
As to fat deposition, Kubena et al. (1972), Summers
& Leeson (1985), Summers et al. (1992), Conhalato
(1998), and Eits et al. (2002) also did not observe any
reduction in fat deposition when feeding broilers with increasing lysine levels during the starter phase, which is consistent with our results. On the other hand, Gous & Morris (1985), Holsheimer & Ruensink (1993), Scheuermann et al. (1995), Hurwitz et al. (1998), and
Ajinomoto (2009) concluded that increasing lysine levels during this phase reduced body fat deposition in broilers.
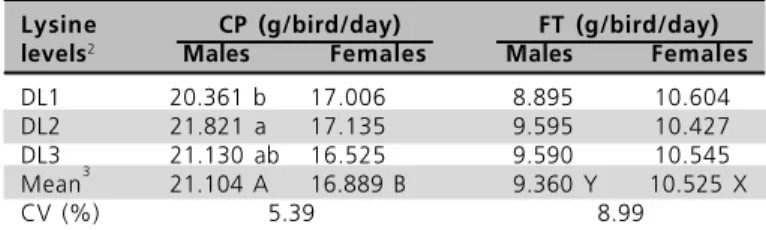
Table 5 shows the daily protein and fat deposition results of 22 to 42-day-old male and female broilers as a function of digestible lysine levels.
Table 5 - Effect of digestible lysine dietary levels on daily protein (CP) and fat (FT) deposition of male and female broilers in the period of 22 to 42 days of age1.
Lysine CP (g/bird/day) FT (g/bird/day) levels2
Males Females Males Females
DL1 20.361 b 17.006 8.895 10.604
DL2 21.821 a 17.135 9.595 10.427
DL3 21.130 ab 16.525 9.590 10.545
Mean3 21.104 A 16.889 B 9.360 Y 10.525 X CV (%) 5.39 8.99
1 - Means followed by small letters in the same column and capital letters in the same row are significantly different by the test of Student-Newman-Keuls (P<0.05). 2 - NL1 = 0.981% and 0.925%; DL2 = 1.060% and 1.000%; DL3 = 1.140% and 1.075% digestible lysine for males and females, respectively. 3 - Capital letters A and B for protein deposition, and X and Y for fat deposition. CV (coefficient of variation).
There was no significant effect of lysine levels on fat deposition for males or females, nor on protein deposition for females. As to male protein deposition, DL2 promoted higher deposition as compared to DL1, but these two levels were not different from DL3. Males presented higher protein deposition and lower fat deposition as compared to females. These results preclude the increase of dietary lysine levels beyond those recommended by Rostagno et al. (2000) with
the aim of reducing fat deposition and increasing protein deposition in broiler carcasses.
In the studies of Holsheimer & Ruensink (1993) and Conhalato (1998), no effects of increasing lysine levels on protein deposition were observed. However, Scheuermann et al. (1995), Eits et al. (2002), and
Ajinomoto (2009) concluded that increasing dietary lysine levels in this phase increase body protein deposition.
Summers & Leeson (1985), Holsheimer & Ruensink (1993), Conhalato (1998), and Eits et al. (2002) also
did not find any effects of dietary lysine levels on fat
deposition, as opposed to Scheuermann et al. (1995) and Ajinomoto (2009), who found a direct relation between increasing lysine levels and fat deposition reduction in grower broilers.
Table 6 shows the daily protein and fat deposition results of 43- to 56-day-old male and female broilers as a function of digestible lysine levels.
Table 6 - Effect of digestible lysine dietary levels on daily protein (CP) and fat (FT) deposition of male and female broilers in the period of 43 to 56 days of age1.
Lysine CP (g/bird/day) FT (g/bird/day) levels2
Males Females Males Females
DL1 19.526 a 13.867 14.487 17.148
DL2 17.463 b 14.920 14.743 17.521
DL3 19.119 a 15.026 13.291 17.190
Mean3 18.703 A 14.604 B 14.174 Y 17.286 X CV (%) 9.57 17.14
1 - Means followed by small letters in the same column and capital letters in the same row are significantly different by the test of Student-Newman-Keuls (P<0.05). 2 - NL1 = 0.888% and 0.833%; DL2 = 0.960% and 0.900%; DL3 = 1.032% and 0.968% digestible lysine for males and females, respectively. 3 - Capital letters A and B for protein deposition, and X and Y for fat deposition. CV (coefficient of variation).
There was no effect of dietary lysine levels on female protein deposition or on male and female fat deposition during this period. Male protein deposition values promoted by DL1 and DL3 levels were not different, but were higher than those observed when DL2 was fed. Protein deposition was higher in males than females, whereas females presented higher fat deposition as compared to males. The results show that, at this age interval, a 7.5% reduction or increase in lysine levels increase protein deposition in males. These findings are opposite to those obtained by Summers et al. (1992) with grower broilers. The results
obtained in the present experiment do not allow the recommendation to increase lysine levels to reduce fat deposition or to increase protein deposition in 43- to 56-day-old broilers.
Table 7 shows the daily protein and fat deposition results of 1 to 56-day-old male and female broilers as a function of digestible lysine levels.
Gompertz curves and derivates
Table 7 - Effect of digestible lysine dietary levels on daily protein (CP) and fat (FT) deposition of male and female broilers in the period of 1 to 56 days of age1.
Lysine CP (g/bird/day) FT (g/bird/day) levels2 Males Females Males Females
DL1 14.967 12.168 8.033 9.378
DL2 15.019 12.487 8.436 9.419
DL3 15.185 12.334 8.002 9.372
Mean3 15.057 A 12.330 B 8.157 Y 9.390 X CV (%) 3.58 7.65 1 - Means followed by capital letters in the same row are significantly different by the test of Student-Newman-Keuls (P<0.05). 2 - NL1 = 1.073, 0.981, and 0.888%; DL2 = 1.160, 1.060, and 0.960%; DL3 = 1.247, 1.140, and 1.032% digestible lysine for males, and DL1 = 1.018, 0.925, and 0.833%; DL2 = 1.100, 1.000, and 0.900%; DL3 = 1.183, 1.075, and 0.968% digestible lysine for females, for the phases of 1 to 21 days, 22 to 42 days, and 43 to 56 days of age, respectively. 3 - Capital letters A and B for protein deposition, and X and Y for fat deposition.CV (coefficient of variation).
Table 8 shows the parameter values of Gompertz equations fit for body weight of female and male broilers as a function of dietary digestible lysine levels during the period of 1 to 56 days of age.
Table 8 - Parameters of Gompertz equations fit for body weight of female and male broilers fed different digestible lysine levels1.
Parameter Males Females
values2 DL1 DL2 DL3 DL1 DL2 DL3
A 5289.4 5421.6 5734.4 4453.0 4467.4 4678.2 B 0.0459 0.0454 0.0429 0.0445 0.0441 0.0431
C 35.8 36.1 37.8 35.4 35.4 36.2
R2 0.995 0.997 0.997 0.996 0.996 0.998
1 - NL1 = 1.073, 0.981, and 0.888%; DL2 = 1.160, 1.060, and 0.960%; DL3 = 1.247, 1.140, and 1.032% digestible lysine for males, and DL1 = 1.018, 0.925, and 0.833%; DL2 = 1.100, 1.000, and 0.900%; DL3 = 1.183, 1.075, and 0.968% digestible lysine for females, for the phases of 1 to 21 days, 22 to 42 days, and 43 to 56 days of age, respectively.2 - A = mature body weight (g); B = maximum growth rate (g/day per g); C = age at maximum growth (days).
The values obtained for parameter A are similar to those established by Hancock et al. (1995) and lower
than those obtained by Gous et al. (1999). B and C
values were lower than those found by Hancock et al.
(1995). The analysis of the equation parameters shows that the mature body weight (A) of males is always higher than that of females, and that increasing lysine levels increased the value of this parameter both in males and females; there was a slight difference between males and females as to age at maximum growth (C), and lysine supplementation delayed the age when it occurred; and maximum growth rate (B) was higher in males as compared to females, and
increasing lysine levels reduced its value. The values of the coefficient of determination show the high degree of efficiency of the Gompertz equation to describe broiler growth. Similar R2 values were observed by Freitas et al. (1983) and Wiseman & Lewis
(1998) for the same parameter.
Increasing lysine levels in female and male broiler diets during the period of 1-56 days of age increased bird weight gain, reduced maximum growth rate, and delayed age at maximum growth.
Table 9 shows the parameter values of Gompertz equations fit for protein deposition of female and male broilers as a function of dietary digestible lysine levels during the period of 1 to 56 days of age.
Table 9 - Parameters of Gompertz equations fit for protein
deposition of female and male broilers fed different digestible lysine levels1.
Parameter Males Females
values2 DL1 DL2 DL3 DL1 DL2 DL3
A 1299.0 1196.8 1304.8 999.7 1062.1 1073.8 B 0.0462 0.0518 0.0471 0.0477 0.0457 0.0441
C 37.5 35.1 37.4 35.1 36.3 36.8
R2 0.996 0.996 0.994 0.995 0.996 0.991
1 - NL1 = 1.073, 0.981, and 0.888%; DL2 = 1.160, 1.060, and 0.960%; DL3 = 1.247, 1.140, and 1.032% digestible lysine for males, and DL1 = 1.018, 0.925, and 0.833%; DL2 = 1.100, 1.000, and 0.900%; DL3 = 1.183, 1.075, and 0.968% digestible lysine for females, for the phases of 1 to 21 days, 22 to 42 days, and 43 to 56 days of age, respectively. 2A = mature protein content (g); B = maximum protein deposition rate (g/day per g); C = age at maximum protein gain (days).
The observed A and B values are higher, and C values are lower than those determined by Hruby et al. (1995) and Gous et al. (1999). The analysis of the
equation parameters shows that the mature protein content (A) of males is always higher than that of females, and that the highest value in males was obtained with DL3 lysine level and the lowest with DL2, whereas in females, increasing lysine levels increased this value. Also, age at maximum protein gain (C) was similar between males and females, and DL2 promoted the lowest value in males, while DL1 and DL3 did not result in any differences. Maximum protein deposition rate (B) was higher in males, and increasing lysine levels reduced this value in females, whereas DL2 promoted the highest value in males, and DL1, the lowest. The values of the coefficient of determination for protein deposition are similar to those established by Hruby et al. (1995) and show the high degree of efficiency of
are compared, it is observed that age at maximum gain agrees matches age at maximum protein deposition both in males and females. Graph 1 shows the effects of dietary lysine levels on protein deposition and daily protein gain of male and female broilers in the period of 1 to 56 days.
Graph 1 - Effect of digestible lysine levels on daily protein gain of male and female broilers in the period of 1 to 56 days of age.
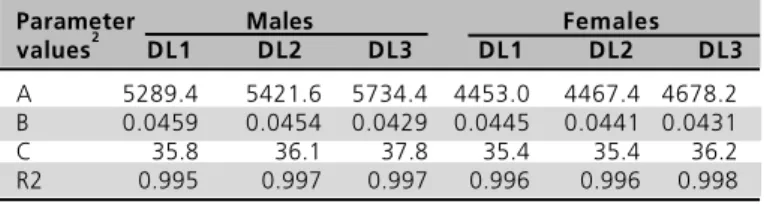
Table 10 shows the parameter values of Gompertz equations fit for fat deposition of female and male broilers as a function of dietary digestible lysine levels during the period of 1 to 56 days of age.
Table 10 - Parameters of Gompertz equations fit for fat
deposition of female and male broilers fed different digestible lysine levels1.
Parameter Males Females
values2 DL1 DL2 DL3 DL1 DL2 DL3
A 1543.8 1438.9 1100.1 2153.2 1924.4 1986.0 B 0.0271 0.0291 0.0332 0.0248 0.0271 0.0265
C 63.7 59.6 52.8 70.0 65.5 66.8
R2 0.985 0.982 0.986 0.972 0.984 0.985
1NL1 = 1.073, 0.981, and 0.888%; DL2 = 1.160, 1.060, and 0.960%; DL3 = 1.247, 1.140, and 1.032% digestible lysine for males, and DL1 = 1.018, 0.925, and 0.833%; DL2 = 1.100, 1.000, and 0.900%; DL3 = 1.183, 1.075, and 0.968% digestible lysine for females, for the phases of 1 to 21 days, 22 to 42 days, and 43 to 56 days of age, respectively.2A = mature fat content (g); B = maximum fat deposition rate (g/day per g); C = age at maximum fat gain (days).
A and C values are higher, and B values are lower than those determined by Gous et al. (1999). The analysis of the equation parameters shows that mature fat content (A) of females is always higher than that of males, with the highest value obtained with DL1 and the lowest with DL2 in females, whereas in males increasing lysine levels reduced A values. Age at maximum fat gain was higher in females, and increasing lysine levels reduced age at maximum fat deposition (C) in males. A different behavior was observed in females, with DL1 resulting in the highest C value and DL2, the lowest. Maximum fat deposition rate (B) was higher in males, where increasing lysine
levels determined increase in B values, while in females the highest value was obtained with DL2 and the lowest with DL1. The values of the coefficient of determination are lower than those of the previous equations; however, they still demonstrate the high degree of efficiency of the Gompertz equation to describe fat deposition in broilers.
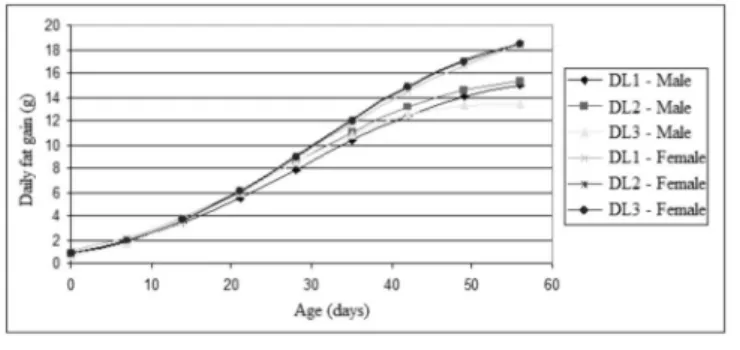
When protein and fat deposition curves are compared, it is observed that age at maximum protein deposition in males and females is much lower than age at maximum fat deposition, demonstrating that even after protein deposition decreases, fat deposition continues to increase for some time. Therefore, the older the broilers, the higher their body fat content. Graph 2 shows the effects of lysine levels on fat deposition and daily fat gain of males and female broilers during the period of 1 to 56 days of age
Graph 2 - Effect of digestible lysine levels on daily fat gain of male and female broilers in the period of 1 to 56 days of age.
CONCLUSIONS
Reducing or increasing dietary digestible lysine levels 7.5% below or above the established requirements is not sufficient to cause significant changes in body composition or in protein and fat deposition during the period of 1 to 56 days of age of male and female Avian Farms broilers. Females deposit more fat and less protein as compared to males. After the fall in the protein deposition curve, the fat deposition curve continues to rise, and therefore, the older the broiler at slaughter, the higher its body fat content and the lower its body protein content, particularly in females.
REFERENCES
Conhalato GS. Exigência de lisina digestível para frangos de corte machos [dissertação]. Viçosa (MG): Universidade Federal de Viçosa; 1998.
Edwards HM, Fernandez SR, Baker DH. Maintenance lysine requirement and efficiency of using lysine for accretion of whole-body lysine and protein in young chicks. Poultry Science 1999; 78:1412-1417.
Eits RM, Kwakkel RP, Verstegen MWA, Stoutjesdijk P, Greef KH. Protein and lipid deposition rates in male broiler chickens: separate responses to amino acid and protein-free energy. Poultry Science 2002; 81:472-480.
Freitas AR, Albino LFT, Rosso LA. Estimativas do peso de frangos machos e fêmeas através de modelos matemáticos [comunicado técnico 68]. Concórdia: Embrapa-CNPSA; 1983. p.1-4
Gous RM, Morris TR. Evaluation of a diet dilution technique for measuring the response of broiler chickens to increasing concentrations of lysine. British Poultry Science 1985; 26:147-161.
Gous RM, Moran Jr ET, Stilborn HR, Bradford GD, Emmans GC. Evaluation of the parameters needed to describe the overall growth, the chemical growth, and the growth of feathers and breast muscles of broilers. Poultry Science 1999; 78:812-821.
Granja Planalto. Manual de pinto de corte Planalto Avian Farms. Uberlândia (MG); 1999.
Han Y, Baker DH. Effects of sex, heat stress, body weight, and genetic strain on the dietary lysine requirement of broiler chicks. Poultry Science 1993; 72:701-708.
Hancock CE, Bradford GD, Emmans GC, Gous RM. The evaluation of the growth parameters of six strains of commercial broiler chickens. British Poultry Science 1995; 36:247-264.
Holsheimer JP, Ruensik EW. Effect on performance, carcass composition, yield, and financial return of dietary energy and lysine levels in starter and finisher diets fed to broilers. Poultry Science 1993; 72:806-815.
Holsheimer JP. Performance and carcass composition of male broilers as influenced by phase feeding. Poultry Science 1980; 59:2060-2064.
Hruby M, Hanre ML, Coon CN. Predicting amino acid requirements for broilers at 21.1ºC and 32.2ºC. Journal of Applied Poultry Research 1995; 4:395-401.
Hurwitz S, Sklan D, Talpaz H, Plavnik I. The effect of dietary protein level on lysine and arginine requirements of growing chickens. Poultry Science 1998; 77:689-696.
Kessler AM. Programas alimentares para otimizar a deposição de carne e gordura em carcaças de frangos de corte. In: Ribeiro AML, Bernardi ML, Kessler AM, editores. Tópicos em produção animal. Porto Alegre: Departamento de Zootecnia da UFRGS; 1999. p.183-199.
Kubena LF, Lott BD, Deaton JW, Reece FN, May JD. Body composition of chicks as influenced by environmental temperature and selected dietary factors. Poultry Science 1972; 51: 517-522.
Leenstra FR. Effect of age, sex, genotype and environment on fat deposition in broiler chickens: a review. World's Poultry Science Journal 1986; 42:12-25.
Leeson S. Nutrição e qualidade da carcaça de frangos de corte. Anais da Conferência APINCO de Ciência e Tecnologia Avícolas; 1995; Campinas, São Paulo. Brasil. p.111-8.
Lin CY. Relationship between increased body weight and fat deposition in broilers. World's Poultry Science Journal, 1981; 37: 106-110.
Mcleod JA. Nutritional factors influencing carcass fat in broilers - A review. World's Poultry Science Journal 1982; 38:195-200.
Rostagno HS, Albino LFT, Donzele JL, Gomes PC, Oliveira RF, Lopes DC, Ferreira AS, Barreto SLT. Tabelas brasileiras para aves e suínos: composição de alimentos e exigências nutricionais. Viçosa; 2000. p. 141.
Scheuermann GN, Maier JC, Bellaver C, Fialho FD. Metionina e lisina no desenvolvimento de frangos de corte. Revista Brasileira de Agrociência 1995; 1(2):75-86.
Sibbald IR, Wolynetz MS. Effects of dietary lysine and feed intake on energy utilization and tissue synthesis by broiler chicks. Poultry Science 1986; 65:98-105.
Silva DJ. Análise de alimentos: métodos químicos e biológicos. 2nd ed. Viçosa; 1998. p. 165.
Summers JD, Sprat D, Atkinson JL. Broiler weight gain and carcass composition when fed diets varying in amino acid balance, dietary energy, and protein level. Poultry Science 1992; 71:263-273.
Summers JD, Leeson S. Broiler carcass composition as affected by amino acid supplementation. Canadian Journal of Animal Science 1985; 65:717-723.
Tesseraud S, Larbier M, Chagneau AM, Geraert PA. Effect of dietary lysine on muscle protein turnover in growing chickens. Reproduction and Nutrition Development 1992; 32:163-171.
Universidade Federal de Viçosa. Sistema de análises estatísticas e genéticas - SAEG. Viçosa: UFV; 1999. 59p.