Row spacing, plant density, sowing
and harvest times for sweet sorghum
1Josefa Maria Francieli da Silva2, Alek Sandro Dutra2,
Felipe Thomaz da Camara3, Antônio Alves Pinto3, Francisco Edson da Silva3
INTRODUCTION
The global demand for renewable fuels has expanded rapidly in recent years, due to concerns about reducing the volume of greenhouse gas emissions from non-renewable resources. In addition, uncertainties about the future availability of fossil fuels and geopolitical tensions in oil-producing regions have aroused a great global interest in biofuels, as they are the most viable substitutes for oil (May et al. 2012, Zegada-Lizarazu & Monti 2012, Cabral et al. 2013, Santos et al. 2015).
Brazil stands out as the world’s largest producer of bioethanol from sugarcane. According to Conab
ABSTRACT
RESUMO
(2016), when evaluating the prospects for expansion of the domestic and international market, a production
of 28.7 billion liters was verified in the 2014/2015 harvest season and 30.5 billion liters in the 2015/2016 harvest season. For the 2020/2021 harvest season, this
value may reach 65.3 billion liters, what represents 15 % of the Brazilian energy matrix. However, one of the great challenges for the Brazilian sugar-energy sector is the increasing oscillation of production
costs, making it necessary to find solutions to reduce
them, focusing mainly on increasing agricultural and
industrial outputs (Whitfield et al. 2012, Chaves & Gomes 2014, Fernandes et al. 2014).
1. Manuscript received in Aug./2017 and accepted for publication in Dec./2017 (http://dx.doi.org/10.1590/1983-40632017v4748585).
2. Universidade Federal do Ceará, Centro de Ciências Agrárias, Departamento de Fitotecnia, Fortaleza, CE, Brasil.
E-mails: francielisilva39@yahoo.com.br, alekdutra@ufc.br.
3.Universidade Federal do Cariri, Centro de Ciências Agrárias e da Biodiversidade, Crato, CE, Brasil.
E-mails: felipe.camara@ufca.edu.br, pintoalves01@hotmail.com, frcedson@gmail.com.
Along with sugarcane, which is the main crop used for ethanol production, the sweet sorghum is a promising agronomic and industrial alternative for cultivation in water-stress regions. This study aimed at assessing the row
spacing (0.70 m, 0.80 m and 0.90 m) and plant density
(80,000 plants ha-1; 100,000 plants ha-1; 120,000 plants ha-1;
and 140,000 plants ha-1) for the BRS 511 sorghum cultivar, combined with sowing and harvest times. A split-plot experimental design, in complete randomized blocks, with four replications, was used. The analyzed variables were plant height, stem diameter, shoot fresh and dry matter, broth volume and total soluble solids (ºBrix). The results showed
isolated effects of plant density on plant height and stem diameter, as well as effects of row spacing on total fresh mass and broth volume. The most efficient productive effect
for the sweet sorghum was observed in populations lower than 120,000 plants ha-1 and row spacing inferior to 0.80 m, associated with harvest at 120 days after sowing.
KEYWORDS:Sorghum bicolor; plant spatial arrangement;
planting density.
Espaçamento, população de plantas, épocas de semeadura e de colheita para sorgo sacarino
Juntamente com a cana-de-açúcar, principal cultura empregada na produção de etanol, o sorgo sacarino é uma alternativa promissora, do ponto de vista agronômico e industrial, para cultivo em
regiões sob déficit hídrico. Avaliaram-se o espaçamento entre fileiras (0,70 m; 0,80 m; e 0,90 m) e a população de plantas (80.000 plantas ha-1, 100.000 plantas ha-1, 120.000 plantas ha-1 e 140.000 plantas ha-1), para a cultivar de sorgo BRS 511, combinados com épocas de semeadura e colheita. O delineamento experimental foi de parcelas subdivididas, em blocos completos casualizados, com quatro repetições. As variáveis
analisadas foram: altura de planta, diâmetro de colmo, matéria fresca e
seca da parte aérea, volume de caldo e sólidos solúveis totais (ºBrix). Os resultados demonstraram efeito isolado da população de plantas sobre a
altura de planta e diâmetro do colmo, bem como efeito do espaçamento entre fileiras sobre a matéria fresca total e volume de caldo. O melhor
efeito produtivo sobre o sorgo sacarino foi observado em populações inferiores a 120.000 plantas ha-1 e espaçamentos inferiores a 0.80 m, associados à colheita aos 120 dias após a semeadura.
PALAVRAS-CHAVE:Sorghum bicolor; arranjo espacial de
409
Row spacing, plant density, sowing and harvest times for sweet sorghum
In this scenario, sorghum (Sorghum bicolor L. Moench) is presented as a promising alternative to increase the ethanol production chain. Sorghum may
be harvested at the sugarcane off-season, when mills
are idle, with advantages such as a high biomaterial production, harvest anticipation and use of the same industrial process of sugarcane for producing ethanol (Guigou et al. 2011, Parrella 2011).
A c c o r d i n g t o F i o r i n i e t a l. ( 2 0 1 6 ) , understanding the behavior of sorghum cultivars
under different management conditions (variation
in sowing dates, plant population or harvest times)
allows the adoption of more efficient strategies, thus
increasing the productivity and sustainability of the activity.
According to Fernandes et al. (2014), the reduction of row spacing for the sorghum crop results in agronomic gains of great importance for the ethanol production. On the other hand, in relation to plant population, the result does not always indicate
an effect on the main production variables, due to the environmental variation and the different row
spacings evaluated.
For Silva et al. (2005), adjusting the production system to the best sowing season will result in gains for both forage and industrial yield of sorghum. However, when they sowed at inappropriate times (in this case, at late dates in the year), there was usually a decrease in the availability of water in the soil, temperature and insolation, when the photoperiod began to decrease, inducing the apical meristem of the sorghum plants to pass from the vegetative to the reproductive stage, thus decreasing its yield.
This study aimed to evaluate the effect of row
spacing and plant population for the sweet sorghum BRS 511 cultivar, combined with sowing and harvest dates.
MATERIAL AND METHODS
The trials were conducted in the experimental area of the Universidade Federal do Cariri, in Crato,
Ceará state, Brazil (7º14’49”S, 39º22’05”W and 413 m of altitude), from April 2016 to January 2017. The climate, according to the Köppen classification,
is tropical humid (Aw’), with a characteristic dry winter and a rainy season from December to April and a dry season from May to November (Table 1).
The soil of the experimental area is a Red-Yellow Argisol, with a sandy texture (Santos et al.
2013). The results obtained with the soil chemical
analysis (0-20 cm depth) were: pH (1:2.5 H2O): 5.0;
P (Melich-1) = 3.0 mg dm-3; K = 1.00 mmol
c dm
-3;
Ca = 3.0 mmolc dm-3; Mg = 3.0 mmol
c dm
-3;
Al3+ = 0.7 cmol
c dm
-3; H + Al = 1.98 cmol
c dm
-3;
CTC = 26.0 mmolc dm-3; V(%) = 23.0. Liming was performed to raise the base saturation to 60 %, and the fertilization rate was calculated in order to provide adequate amounts of nitrogen, phosphorus and potassium, based on the expected total biomaterial production of shoots of 60 t ha-1.
A split-plot experimental design, in complete randomized blocks, with four replications, was used. The plots consisted of row spacings
(0.70 m, 0.80 m and 0.90 m) and the subplots of plant
populations (80,000 plants ha-1; 100,000 plants ha-1; 120,000 plants ha-1; and 140,000 plants ha-1). Each experimental unit consisted of three rows with 5.0 m, where only the central row, eliminating 1.0 m from each end, was considered for the analyses. The useful area for the analysis was one linear meter, so the number of plants varied according to the spacings used. The cultivar evaluated was the BRS 511, a variety developed by the Empresa Brasileira de Pesquisa Agropecuária (Embrapa) and recommended for this crop region because of its high potential for
stem/stalk production (about 80 t ha-1), associated
with high levels of sugars in the broth (18-22 ºBrix) and a good fermentation pattern.
Two sowing seasons were considered: the first on April 15 and the second on September 15
(2016). The soil preparation was carried out in a conventional way, with a light harrow, prior to the
Source: Brasil (2017).
Month Rainfall (mm)
Relative humidity (%)
Temperature (ºC)
Min. Max.
April/2016 33.50 74.05 21.26 32.84
May/2016 30.00 66.64 20.88 33.40
June/2016 17.60 64.00 19.82 32.63
July/2016 0.00 50.60 19.56 33.22
August/2016 0.00 45.91 19.32 34.68
September/2016 3.10 45.65 21.01 35.57
October/2016 0.00 45.65 21.80 36.72
November/2016 0.00 44.07 23.02 36.31
December/2016 69.10 43.40 22.47 35.61
January/2017 21.00 74.21 21.86 31.95
dates, one fertilization was applied to the furrow (8 cm depth), at a dose of 200 kg ha-1 of ammonium sulphate, 500 kg ha-1 of single superphosphate and 125 kg ha-1 of potassium chloride. After this, soil was deposited over the fertilizer, in order to avoid a direct contact with the seeds. Afterwards, a sowing machine with a Knapik seed drill and a seed distribution system for honeycomb discs was used. At 15 days after germination, manual thinning was performed, leaving the number of plants adjusted for each population to be assessed with a ruler previously marked, indicating the distances between the plants in the row, according to the spacing related to each experimental treatment.
The topdressing nitrogen was divided into two
applications: the first carried out when the plants emitted 3-4 final leaves, at 30 days after sowing
(DAS), at a dose of 350 kg ha-1 of ammonium sulfate and 125 kg ha-1 of potassium chloride; and the second at 65 DAS, with 350 kg ha-1 of ammonium sulfate. A dripping irrigation system was used, being the experiment irrigated daily (10 mm). For each sowing
season, there were two independent harvests, the first at 90 DAS and the other at 120 DAS.
The variables analyzed were: plant height
(average distance, in meters, from the ground base to the panicle insertion, with a sample of ten plants
from the useful area of 0.90 m2 in each subplot);
stem diameter (average diameter, in millimeters, using a calliper, of the stem in its middle third, with the same plant samples); total fresh matter (average weight, in grams, of the fresh matter of stems, leaves and panicles, using a semi-analytical precision scale, with a subsequent conversion to kg ha-1); total dry matter (average weight, in grams, of the dry matter of stems, leaves and panicles, resulting from drying in a forced-circulation oven at 65 ºC, for 72 hours, with
(measured with a graduated test tube and expressed in L ha-1 - the broth was extracted from the stems, which
passed twice through a “low extraction efficiency”
electric mill); and total soluble solids (determined by
a field refractometer, scaled from 0 to 32 ºBRIX, in
broth samples extracted from plant stems).
The data were submitted to analyses of variance at 5 %, using the Sisvar software (Ferreira
2011). The regression models for data fitting of
the response variables to quantitative factors (row spacing and plant population) were chosen based on
the coefficient of determination and significance of the effects.
RESULTS AND DISCUSSION
The plant height variable was not affected
by the spacing between rows at sowing and harvest times (Table 2). However, for the plant population
factor, in the first sowing season, the plants reached a maximum height of 2.59 m, in a population of
111,111 plants ha-1, a value close to that obtained for 80,000 plants ha-1 with 2.58 m; while, in the
population of 140,000 plants ha-1, the plant height was
2.48 m. In the second sowing season, the height was 1.59 m for the population of 80,000 plants ha-1 and
1.17 m for the population of 140,000 plants ha-1, with the maximum value estimated in 1.67 m only for the
population of 40,000 plants ha-1. This implies that the
plant height was negatively influenced by the plant
population, i.e., the larger plant population per hectare is associated with their lower height. Regarding the
harvest at 90 DAS, there was no significance for the
two sowing times studied (Figure 1).
Embrapa (2009) states that daytime temperatures higher than 34 ºC, for nine consecutive
days, impact on plant growth, due to a yield decrease
Source of variation
1st sowing 2nd sowing 1st sowing 2nd sowing
1st harvest 2ndharvest 1st harvest 2nd harvest 1st harvest 2nd harvest 1st harvest 2nd harvest _______________________ Plant height (m) _______________________ _____________________ Stem diameter (cm) ____________________
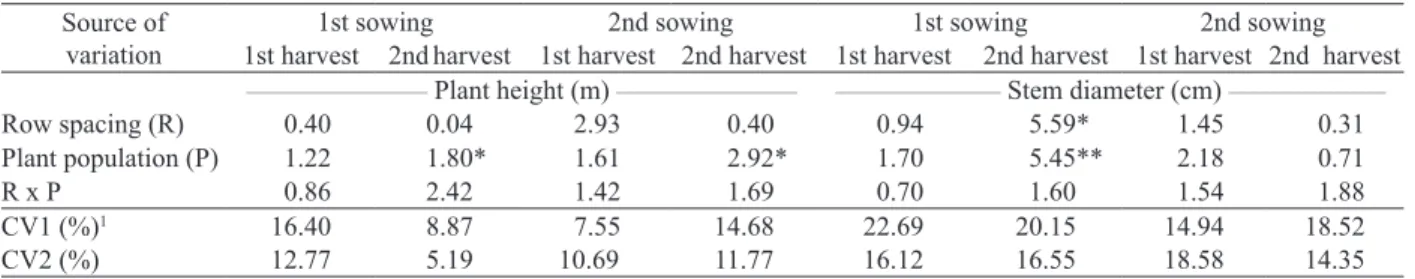
Row spacing (R) 0.40 0.04 2.93 0.40 0.94 5.59* 1.45 0.31
Plant population (P) 1.22 1.80* 1.61 2.92* 1.70 5.45** 2.18 0.71
R x P 0.86 2.42 1.42 1.69 0.70 1.60 1.54 1.88
CV1 (%)1 16.40 8.87 7.55 14.68 22.69 20.15 14.94 18.52
CV2 (%) 12.77 5.19 10.69 11.77 16.12 16.55 18.58 14.35
Table 2. Summary of the analyses of variance (F-test values) for plant height and stem diameter, at different sowing and harvest
times, as a function of row spacing and plant population.
411
Row spacing, plant density, sowing and harvest times for sweet sorghum
of 12-17 % (Table 1). The fact was also observed by Avelino et al. (2011), in a study on density and sowing
date in Araguaína (Tocantins state, Brazil), where the
plants obtained a height inferior to those found in the
present study, varying 0.45-1.20 m.
For the stem diameter, the effect of spacing between rows was significant in the first sowing
season, with harvest at 120 DAS (Figure 2), since the higher plant diameters were related to the larger row spacing. For May et al. (2012) and Souza et al. (2013), this occurs probably due to the better use of water, light and nutrients by plants, as well as the
longer period in the field, since the plants harvested
at 120 DAS had better results, in relation to the stem diameter. In the second sowing season and in its two
harvest dates, stem diameter was not influenced by
the increasing row spacing for the crop.
In relation to the plant population, only in the
first sowing season and with the harvest at 120 DAS, there were significant effects. With the plant population
increase from 80,000 plants ha-1 to 140,000 plants ha-1, a decrease of 1.21 cm was observed in the diameter, i.e., the greater the number of plants per hectare the lower the plant diameter. This fact was also noticed in relation to the plant height (Figure 3). These results corroborate those obtained by May et al. (2012), who
Figure 2. Stem diameter, as a function of plant row spacing, at two sowing and harvest times. ∆SD90DAS: stem diameter at 90 days after sowing; ■SD120DAS: stem diameter at 120 days after sowing. * and
ns: significant at 5 % and non-significant, respectively.
Figure 1. Plant height, as a function of plant population, at two sowing and harvest times. ∆PH90DAS: plant height at 90 days after sowing; ■PH120DAS: plant height at 120 days after sowing. * and
ns: significant at 5 % and non-significant, respectively.
■PH120DAS = 1.48 + 2.10-5X -9.10-11X2
R² = 0.99*
0.0 0.5 1.0 1.5 2.0 2.5 3.0
80000 100000 120000 140000
P
la
n
t h
ei
g
h
t (m
)
Plant population (plants ha-1) ∆ PH90DAS= 1.76ns
1st sowing
■PH120DAS= 1.59 + 4.10-6X - 5.10-11X2
R² = 0.93*
0.0 0.5 1.0 1.5 2.0
80000 100000 120000 140000
P
la
n
t h
ei
g
h
t (m
)
Plant population (plants ha-1)
∆ PH90DAS= 1.43ns
2nd sowing
■SD120DAS= 0.5133 + 1 X R2 = 0.92*
1.0 1.2
1.4
1.6 1.8 2.0
0.70 0.80 0.90
S
tem
d
ia
m
et
er (
cm
)
Row spacing (m)
1st sowing
1.0 1.2
1.4
1.6 1.8 2.0
0.70 0.80 0.90
S
tem
d
ia
m
et
er (
cm
)
Row spacing (m)
2nd sowing
∆SD90DAS= 1.22ns
∆SD90DAS= 1.51ns
in the reduction of plant diameter and height, due to the competition and use of water, light and nutrients by plants. In the second sowing season, there was no
effect for the harvest dates.
Regarding the total fresh matter, there was no
significance, in the first sowing season, for the factors
under study. In the second sowing season, there was a
positive effect of the row spacing factor with harvest
at 120 DAS, when the total fresh matter increased
with the spacing reduction (Figure 4). However, the
plant population factor, in relation to the total fresh
matter, did not present a significant effect in the two
sowing seasons (Table 3).
According to Pereira Filho et al. (2013), when evaluating the cultivars BR 501, BR 505, BR 506 and BR 507, and a single cross BR 601, seeding at densities of 75,000 plants ha-1, 100,000 plants ha-1, 125,000 plants ha-1, 150,000 plants ha-1 and 175,000
matter yield ranged from 86.0 t ha (BR 506) to
54.1 t ha-1 (BR 601). Thus, the fresh matter yields obtained in the present study are below those found by these authors. They state that the fresh matter is a characteristic of great importance in sorghum and
reflects positively on the broth volume. However,
the sugar content in the broth and, consequently, its conversion to ethanol, is dependent on the cultivar,
environmental factors, harvest time and efficiency of
transportation and industrial conversion processes, since there is always a positive correlation between these two characteristics.
Similarly to the total fresh matter, the dry
matter was also influenced by the spacing between
rows in the second sowing season, with harvest at 120 DAS. The row spacing of 0.70 m presented the highest total dry matter yield, and it was not
influenced by the plant population factor (Figure 5).
1 CV1 and CV2: coefficients of variation for plot and subplot, respectively; * significant at 5 %.
Source of variation
1st sowing 2nd sowing 1st sowing 2nd sowing
1st harvest 2ndharvest 1st harvest 2nd harvest 1st harvest 2ndharvest 1st harvest 2nd harvest _________________ Fresh matter (kg ha-1) _________________ ________________ Total dry matter (kg ha-1) ________________
Row spacing (R) 0.21 0.40 3.69 5.63* 0.63 0.54 3.06 10.18*
Plant population (P) 1.51 1.18 0.11 0.82 1.16 1.79 0.40 2.65
R x P 0.65 1.50 1.55 0.46 0.74 0.94 1.07 1.08
CV1 (%)1 28.31 45.01 22.70 17.46 24.37 44.93 30.99 14.72
CV2 (%) 29.72 19.64 21.51 23.80 26.89 17.91 28.49 19.85
Table 3. Summary for the analyses of variance (F-test values) of fresh matter and total dry matter, at different sowing and harvest
times, as a function of row spacing and plant population.
Figure 3. Stem diameter, as a function of plant population, at two sowing and harvest times. ∆SD90DAS: stem diameter at 90 days after sowing; ■SD120DAS: stem diameter at 120 days after sowing. ** and
ns: significant at 1 % and non-significant, respectively.
■SD120DAS= 3.28 - 3.7 10-5X + 1.5 10-10X2
R² = 0.99**
1.0 1.2
1.4
1.6 1.8 2.0
80000 100000 120000 140000
S
tem
d
ia
m
et
er (
cm
)
Plant population (plants ha-1)
∆ SD90DAS= 1.31ns
1.0 1.2
1.4
1.6 1.8 2.0
80000 100000 120000 140000
S
tem
d
ia
m
et
er (
cm
)
Plant population (plants ha-1) ∆ SD90DAS= 1.61ns
■SD120DAS= 1.56ns
413
Row spacing, plant density, sowing and harvest times for sweet sorghum
However, Santos et al. (2014), while
investigating the potential of sorghum for biofuel production, obtained results close to those found in this study. For the total dry matter yield of the
CMSXS 7020 and CMSXS 652 cultivars, they observed 12.46 t ha-1 and 12.50 t ha-1, respectively.
The broth volume had a significant effect
only for the row spacing factor in the second sowing season, with harvest at 120 DAS. This variable decreased proportionally to the increase
of row spacing (from 0.70 m to 0.90 m), resulting in a decrease of 970 L ha-1 (Table 4). This was probably due to the decrease in the total fresh matter (Figure 6).
Similar results were observed by Kumar et
al. (2008), in an experiment conducted at different
locations in India. These authors demonstrated, when evaluating sorghum cultivars under two plant
arrangements (15 cm x 40 cm and 15 cm x 60 cm),
that the highest broth volume was obtained in the smallest spacings and in the largest plant populations.
Studies on the effect of plant density on sorghum yield are contradictory. Some authors point out that high sowing rates lead to increases in the fresh and dry matter yield, and, in other cases, no
effect is observed on both variables (Snider 2012).
The sorghum yield, in response to the sowing density, seems to be dependent on the environment and the
Figure 5. Total dry matter, as a function of plantrow spacing, at two sowing and harvest times. ∆TDM90DAS: total dry matter at 90 days after
sowing; ■TDM120DAS: total dry matter at 120 days after sowing. ** and
ns: significant at 1 % and non-significant, respectively.
Figure 4. Total fresh matter, as a function of plant row spacing, at two sowing and harvest times. ∆TFM90DAS: total fresh matter at 90 days after sowing; ■TFM120DAS: total fresh matter at 120 days after sowing. ** and
ns: significant at 1 % and
non-significant, respectively.
23000 23500
24000 24500
25000
0.70 0.80 0.90
T
o
ta
l fr
es
h
m
a
tte
r
(k
g
h
a
-1)
Row spacing (m)
1st sowing
■TFM120DAS= 60,653 -34,355 X
R² = 0.99**
10000 15000 20000 25000 30000 35000
40000
0.70 0.80 0.90
T
o
ta
l fr
es
h
m
a
tte
r
(k
g
h
a
-1)
Row spacing (m)
2nd sowing
∆TFM90DAS= 24,123ns
■TFM120DAS= 24,579ns
∆TFM90DAS= 27,413ns
2000
4000
6000 8000 10000 12000
0.70 0.80 0.90
T
ot
al
d
ry
m
at
te
r
(k
g h
a
-1)
Row spacing (m)
1st sowing
∆TDM90DAS= 6,299ns
■TDM120DAS= 7,906ns ■TDM120DAS= 17,988 -10,000 X
R² = 0.73**
2000
4000
6000 8000 10000 12000
0.70 0.80 0.90
T
ot
al
d
ry
m
at
te
r
(k
g h
a
-1)
Row spacing (m)
2nd sowing
cultivar (Menezes et al. 2015). Hence, studies like this should always be conducted to adjust the peculiarities of the cropping system.
The variable ºBrix represents an approximation of the total soluble solids content that shows positive correlation with the total sugar concentration (Teetor et al. 2011, Masson et al. 2015), and is
directly influenced by the plant photosynthetic rate.
However, in this study, the total soluble solids were
not influenced by the factors row spacing and plant
population, but the averages obtained in the two sowing seasons are acceptable, because they are within the range considered as desirable, i.e., above 11 ºBrix (Davila-Gomes et al. 2011).
CONCLUSION
The productive behavior of the sweet sorghum BRS 511 cultivar, under the conditions of the Cariri
region, is better when grown using a plant population lower than 120,000 plants ha-1 and row spacing inferior to 0.80 m, with harvest at 120 days after sowing, regardless of the planting season at April or September.
REFERENCES
AVELINO, P. M. et al. Características agronômicas e estruturais de híbridos de sorgo em função de diferentes densidades de plantio. Revista Ciência Agronômica, v. 42,
n. 2, p. 534-541, 2011.
BRASIL. Instituto Nacional de Meteorologia. Estações
convencionais. 2017. Available at: <http://www.inmet.
gov.br/sim/sonabra/dspDadosCodigo.php?ODI3ODQ=>. Access on: 23 Feb., 2017.
CABRAL, P. H. R. et al. Interferência de plantas daninhas na cultura do sorgo cultivado em safrinha. Pesquisa
Agropecuária Tropical, v. 43, n. 3, p. 308-314, 2013.
Figure 6. Broth volume, as a function of plant row spacing, at two sowing and harvest times. ∆BV90DAS: broth volume at 90 days after sowing; ■BV120DAS: broth volume at 120 days after sowing. * and
ns: significant at 5 % and non-significant, respectively.
1 CV1 and CV2: coefficients of variation for plot and subplot, respectively; * significant at 5 %.
Source of variation
1st sowing 2nd sowing 1st sowing 2nd sowing
1st harvest 2ndharvest 1st harvest 2nd harvest 1st harvest 2ndharvest 1st harvest 2nd harvest ___________________ Broth volume (L ha-1) ___________________ _______________ Total soluble solids (ºBrix) _______________
Row spacing (R) 0.55 0.21 2.56 5.42* 0.63 3.62 0.46 0.02
Plant population (P) 1.25 1.12 0.44 0.55 1.27 0.84 0.21 0.24
R x P 0.91 2.28 1.48 0.46 0.47 0.62 1.24 1.61
CV1(%)1 55.97 55.68 33.59 14.66 9.21 3.66 12.68 4.13
CV2(%) 49.83 34.22 30.62 38.57 5.49 3.88 8.90 5.06
2000 3000
4000
5000 6000 7000
0.70 0.80 0.90
B
ro
th v
o
lum
e
(L
ha
-1)
Row spacing (m)
1st sowing
■BV120DAS= 10,298 -5,150 X
R² = 0.95*
2000 3000
4000
5000 6000 7000
0.70 0.80 0.90
B
ro
th v
o
lum
e
(L
ha
-1)
Row spacing (m) 2nd sowing
∆BV90DAS= 5,566ns
∆BV90DAS= 4,139ns
415
Row spacing, plant density, sowing and harvest times for sweet sorghum
CHAVES, M. C. C.; GOMES, C. F. S. Avaliação de biocombustíveis utilizando o apoio multicritério à decisão.
Revista Production, v. 24, n. 3, p. 495-507, 2014.
COMPANHIA NACIONAL DE ABASTECIMENTO (Conab). Cana-de-açúcar safra 2014/2015 - abril/2016: 4º
levantamento. 2016. Available at: <http://www.conab.gov. br/OlalaCMS/uploads/arquivos/16_04_14_09_06_31_ boletim_cana_portugues_-_4o_lev_-_15-16.pdf>. Access on: 03 Nov., 2016.
DAVILA-GOMEZ, F. J. et al. Evaluation of bioethanol production from five different varieties of sweet and forage sorghums (Sorghum bicolor (L.) Moench). Industrial
Crops and Products, v. 33, n. 1, p. 611-616, 2011.
E M P R E S A B R A S I L E I R A D E P E S Q U I S A AGROPECUÁRIA (Embrapa). Sistema de produção do
sorgo. 2009. Available at: <https://ainfo.cnptia.embrapa.br/
digital/bitstream/item/27071/1/Mercadocomercializacao. pdf>. Access on: 23 Jan., 2016.
FERNANDES, P. G. et al. Influência do espaçamento e da população de plantas de sorgo sacarino em diferentes épocas de semeadura. Ciência Rural, v. 44, n. 6, p. 1-10,
2014.
FERREIRA, D. F. Sisvar: a computer statistical analyssis system. Revista Ciência e Agrotecnologia, v. 35, n. 6, p. 1039-1042, 2011.
FIORINI, I. V. A. et al. Influência de populações, de épocas de semeadura e de corte na produtividade do sorgo sacarino BRS 506. Revista Brasileira de Milho e Sorgo, v. 15, n. 1, p. 94-104, 2016.
GUIGOU, M. et al. Bioethanol production from sweet sorghum: evaluation of post-harvest treatments on sugar extraction and fermentation. Biomass and Bioenergy, v. 35, n. 1, p. 3058-3062, 2011.
KUMAR, S. R.; SHROTRIA, P. K.; DESHMUKH, J. P. Characterizing nutrient management effect yield of sweet sorghum genotypes. World Journal of Agricultural
Sciences, v. 4, n. 6, p. 787-789, 2008.
MASSON, I. S. et al. Produção de bioetanol a partir da fermentação de caldo de sorgo sacarino e cana-de-açúcar.
Revista Ciência Rural, v. 45, n. 9, p. 1695-1700, 2015.
MAY, A. et al. Variedades de sorgo sacarino em diferentes espaçamentos e população de plantas. Revista Brasileira
de Milho e Sorgo, v. 11, n. 3, p. 278-290, 2012.
MENEZES, C. B. et al. Adaptabilidade e estabilidade de linhagens de sorgo em ambientes com e sem restrição
hídrica. Revista Brasileira de Milho e Sorgo, v. 14, n. 1,
p. 101-115, 2015.
MONTEIRO, J. S. T.; HAVRLAND, B.; INANOVA, T. Sweet sorghum (Sorghum bicolor (L.) Moench) bioenergy
value: importance for Portugal. Agricultura Tropica et
Subtropica, v. 45, n. 1, p. 12-19, 2012.
PARRELLA, R. A. da C.Melhoramento genético do sorgo sacarino.Agroenergia em Revista, v. 2, n. 3, p. 8-9, 2011.
PEREIRA FILHO, I. A. et al. Avaliação de cultivares de sorgo sacarino [Sorghum bicolor (L.) Moench] em diferentes densidades de semeadura visando a
características importantes na produção de etanol. Revista
Brasileira de Milho e Sorgo, v. 12, n. 2, p. 118-127, 2013.
SANTOS, F. C. et al. Adubações nitrogenada e potássica no sorgo: biomatéria-produtividade e qualidade de fibra.
Revista Brasileira de Milho e Sorgo, v. 13, n. 1, p. 1-13,
2014.
SANTOS, H. G. dos et al. Sistema brasileiro de
classificação de solos. 3. ed. rev. e ampl. Brasília, DF: Embrapa, 2013.
SANTOS, R. F. et al. Sorgo sacarino na produção de agroenergia.Revista Brasileira de Energias Renováveis, v. 4, n. 1, p. 1-12, 2015.
SILVA, A. G. et al. Avaliação dos caracteres agronômicos de cultivares de sorgo forrageiro sob diferentes condições termo-fotoperiódicas. Revista Brasileira de Milho e Sorgo, v. 4, n. 1, p. 28-44, 2005.
SOUZA, V. F. et al. Adaptability and stability of sweet sorghum cultivars. Crop Breeding and Applied
Biotechnology,v. 13, n. 1, p. 144-151, 2013.
TEETOR, V. H. et al. Effects of planting date on sugar and ethanol yield of sweet sorghum grown in Arizona. Industrial
Crops and Products, v. 34, n. 1, p. 1293-1300, 2011.
WHITFIELD, M. B.; CHINN, M. S.; VEAL, M. W. Processing of materials derived from sweet sorghum for biobased products. Industrial Crops and Products, v. 37, n. 1, p. 362-375, 2012.
ZEGADA-LIZARAZU, W.; MONTI, A. Are we ready to cultivate sweet sorghum as a bioenergy feedstock?:
a review on field management practices. Biomass and