Cytogenetic analysis of wheat seeds submitted to artificial aging stress
1Vanessa Ocom Menezes
2, Sidinei Jose Lopes
3, Solange Bosio Tedesco
4,
Fernando Augusto Henning
5, Humberto Davi Zen
2, Liliane Marcia Mertz
5*ABSTRACT - Several studies have been developed to understand the physiology of seed deterioration, however, the initial steps of the deterioration process are not completely clear. Seed vigor and viability losses are also associated with genetic material damage. This study was carried out to detect cytogenetic and physiological alterations occurring during the deterioration process of wheat seeds, due to artificial aging stress. Two cultivars, Ônix and Fundacep Campo Real, were submitted to six different treatments: control (T1), 24 (T2), 48 (T3), 72 (T4), 96 (T5) and 120 (T6) hours under artificial aging conditions: 42 °C and 100% relative humidity. Germination and vigor tests (First Count of Germination, Electrical Conductivity, Seedling Emergence in the Field and Emergence Speed Index) were performed. Cytogenetic evaluations were performed through smear technique for root tips, stained with 2% acetic orcein. Total number of cells under division and mitotic index (MI) were determined. According to results, vigor and mitotic index were affected due to deterioration process induced by artificial aging stress. A reduced number of dividing cells were observed in seeds submitted to prolonged period of aging. Chromosomal abnormalities in mitotic cells of aged seeds were detected with the occurrence of micronuclei, chromosome breaks and bridges.
Index terms: chromosomal abnormalities, mitotic index, seed deterioration, Triticum aestivum, artificial aging stress.
Análise citogenética de sementes de trigo submetidas ao envelhecimento artificial
RESUMO - Inúmeros estudos têm sido desenvolvidos visando entender a fisiologia da deterioração de sementes, entretanto, as etapas iniciais desse processo ainda não estão completamente elucidadas. A perda do vigor e da viabilidade das sementes também têm sido associada aos danos no material genético. Este estudo tem por objetivo avaliar alterações citogenéticas e fisiológicas no processo de deterioração de sementes de trigo , submetidas ao envelhecimento artificial. Duas cultivares foram utilizadas, Ônix e Fundacep Campo Real, submetidas a seis tratamentos: controle (T1), 24 (T2), 48 (T3), 72 (T4), 96 (T5) e 120 (T6) horas, sob envelhecimento artificial a 42 °C e aproximadamente 100% de UR. Foram efetuados os testes de germinação e vigor (Primeira Contagem, Condutividade Elétrica, Emergência de Plântulas e Indice de Velocidade de Emergência). Avaliações citogenéticas foram realizadas em tecidos de pontas de radículas. Determinou-se o número de células em divisão e o índice mitótico. O número de células em divisão e o índice mitótico foram afetados em função da deterioração induzida, pelo envelhecimento artificial. Menor número de células em divisão foi observado em sementes submetidas ao envelhecimento por períodos prolongados. Foram detectadas anormalidades cromossômicas em células mitóticas de sementes envelhecidas artificialmente, como ocorrência de micronúcleos, quebras e pontes cromossômicas.
Termos para indexação: anormalidades cromossômicas, índice mitótico, deterioração de sementes, Triticum aestivum, estresse por envelhecimento artificial.
1Submitted on 10/03/2013. Accepted for publication on 02/25/2014. 2Universidade Federal de Santa Maria, 97105-000 - Santa Maria, RS, Brasil. 3Departamento de Fitotecnia, Centro de Ciências Rurais, Universidade
Federal de Santa Maria, 97105-900 - Santa Maria, RS, Brasil.
4Departamento de Biologia, Universidade Federal de Santa Maria,
97105-900 - Santa Maria, RS, Brasil.
5Embrapa Soja, Caixa Postal 231, 86001-970 - Londrina, PR, Brasil.
*Corresponding author <lilianemertz@hotmail.com>
Introduction
Wheat is the dominant crop in temperate areas, used for human food and livestock feed and it is the third three largest cereal crop, with over 600 million tonnes harvested annually in the world (Shewry, 2009). Among the factors that affect
wheat yield is the quality of seeds used, in respect to the
germination and seedling establishment. Brazil grows more than 2 million hectares of wheat, which demands more than 200.000 tons of seeds (Abrasem, 2013).
Orthodox seeds are characterized by the ability to tolerate
However, seed deterioration occurs during storage under adverse conditions of temperature and humidity reducing germinability and vigor (Murthy et al., 2003).
A sequence of events during seed deterioration which leads to loss of germination and field performance was
proposed by Delouche and Baskin (1973). According to this
model, degradation of membranes is the first event during
seed deterioration process in which the loss of membrane permeability leads to increased leaching of seed cell constituents and electrolyte leakage affecting seed viability.
Oxidative damage is also involved in seed aging; the deleterious role of Reactive Oxygen Species (ROS) in seeds
is due to their high reactivity toward biomolecules, including proteins, sugars, lipids and nucleic acids. Several studies have being developed to better understand the physiology of seed aging showing cellular plasmatic membrane damages, which
showed free-radical-mediate lipid peroxidation, enzyme and
protein degradation, and damages on the nucleic acid structure integrity as major causes of seed deterioration. However, the
primary process and its interactions are not completely explained
(McDonald, 1999). In a study developed by Kizinba et al. (2006)
using sunflower seeds, loss of seed viability was associated with an accumulation of hydrogen peroxide (H2O2), suggesting that seed deterioration is followed by lipid peroxidation, which is related to a decline in the efficiency of the antioxidant seed
defence system. In other study developed by Marini et al. (2013), deterioration process in rice seeds was associated with the increasing in respiration rate and enzymatic activity of malate dehydrogenase and glucose-6-phosphate dehydrogenase.
Chromosome alteration and mutagenic effects are also detected during seed aging. A progressive fragmentation of embryonic nuclear DNA occurs during seed aging (Osborne et al., 1981). DNA damage could be due to an its uncontrolled
degradation following extensive DNA oxidation (Slupphaug
et al., 2003). It was observed that barley and wheat seeds had
a decrease in the frequency of regular dividing cells and an increase in the frequency of abnormal cells related to aging
(Akhter et al., 1992).
Artificial accelerated aging stress is an efficient method
to evaluate seed vigor, used in different species (Ohlson et
al., 2010; Abreu et al., 2013). This evaluation consists in seed exposure to high temperature and relative humidity along a
time course, simulating normal storage conditions, but with factors known to increase deterioration process. Accelerated aging stress also allows the study of biochemical, cytological, and physiological conditions changes in seeds during the deterioration process (Shibata et al., 2012).
The objective of this study was to evaluate some of the cytogenetic and physiological changes that occurred in
the wheat seeds of Ônix e Fundacep Campo Real cultivars submitted to artificial aging stress.
Material and methods
Wheat (Triticum aestivum L.) seeds of two cultivars
(Ônix and Fundacep Campo Real) were used in this study. Seeds were produced by the company Imex Sul Insumos Agrícolas, in Santa Maria, Rio Grande do Sul State,
Brazil, during 2012 growing season. After harvesting and
processing, seeds were stored in a cold chamber (65% of
Relative Humidity (RH) at 10 ºC (T)) for two months. After this, seeds were submitted to accelerated aging stress
according to Delouche and Baskin (1973) using the modified method of gerbox (11 x 11 x 3 cm) adjusted as a 100% humidity chamber using 40 mL of distilled water and approximately 15 g of seeds distributed as a uniform layer. Boxes were evenly placed in a wire mesh,sealed and maintained at 42 °C for: 0 (control)
(T1), 24 (T2), 48 (T3), 72 (T4), 96 (T5) and 120 (T6) hours in a B.O.D chamber (Eletrolab, model EL212/4). In the control samples, seeds were kept in the cold chamber as previously
described. Four boxes were used for each treatment. After each
period of time of incubation, seeds were removed from B.O.D,
stored in the cold chamber at 10 ºC with 65% of RH for 24 hours and subsequently, the physiological and cytogenetic tests
performed.
Germination (G) and First count of germination (FCG):
this test was carried with four replications of 100 seeds each, for each treatment and cultivar. Seeds were distributed in three sheets of germitest paper moistened with distilled
water in a volume equivalent to 2.5 times the mass of the
dry substrate. Paper was rolled up and kept at 20 ºC in a seed germinator. Assessments were performed on the fourth day (FCG) and seventh day (G) after sowing, and results
expressed in percentage of normal seedlings according to
criteria established by Rules for Seed Testing (Brasil, 2009).
Electrical conductivity(EC): this test was carried with
four replications with 50 seeds each, per treatment and cultivar, previously weighed. The seeds were then immersed into 25 mL of distilled water at 20 ºC for 24 h, and the electrical conductivity reading was performed using a conductivimeter (Bel, model W12D). The values of readings were divided by the mass of seeds previously determined and the results
expressed as µS .cm-1.g-1 of seeds.
Emergence speed index (ESI): this index was determined
by the daily record of the number of seedlings that had emerged
until the fourteenth day after the sowing; the data obtained was then used to compute the ESI through the equation proposed
by Maguire (1962): .
Cytogenetic analysis: this evaluation used smear of root
tips (Guerra and Souza, 2002) stained with 2% acetic orcein.
Four replications with 25 seeds for each treatment and cultivar were germinatided in germitest paper, using the same conditions described for the germination test (G). Samples were removed from the germinator when radicles were 1cm long. Due to the stress imposed by accelerated aging, the germination rate varied according to the time period of each treatment. So, different
time periods were required to obtain the radicles with 1cm in length: after 48 hours for T1 and T2; 72 hours for T3 and T4;
and 96 hours for T5 and T6, for both cultivars.
Tip of roots containing the meristem tissue were collected
and maintained in the fixative solution [3:1 (ethanol: acetic acid, v/v)] for 24 hours at room temperature. Subsequently, samples were stored in 70% ethanol at 10 °C temperature,
until the preparation of meristem mitotic cells spreads on microscope slides.
The root tips were hydrolysed in 1N HCl maintained at 60 °C for 10 minutes, washed in distilled water and then stained with 2%
acetic orcein according to the methodology adapted from Guerra
and Souza (2002). The slides were observed in bright filed in a
LEICA microscope using 40X lens. Four replications with 100 cells each were counted, totalizing 400 cells per treatment. Total
cell number under division was determined and the mitotic index
(MI) calculated as the total number of cell under division divided by the total number of cells analysed multiplied by 100.
In the tests performed in laboratory (G, FCG, EC and cytogenetic analysis), completely randomized design was used with the four replications, whereas tests performed in
a field (SEF and ESI), a complete randomized block design
was used. The results obtained and represented as percentage
were transformed by arcsine (x/100)-¹/² to check the ANOVA
assumptions. Data obtained was treated by Anderson-Darling test to check the error normality and, the homogeneity of
variances, by Bartlett’s test at 5% significance level. Scott-Knott test was used at 5% significance level by the statistical
software Sisvar (Ferreira, 2008).
Results and Discussion
Several studies have been developed to understand the mechanisms involved in seed deterioration. However, primary causes of this process are not yet fully clear given for most
plant seeds due to the high number of metabolic alterations that usually occurs. In this study, vigor tests and cytogenetic analyses
were performed to detect modifications that occurred because of
the deterioration process in seeds of two wheat cultivars along
artificial aging process. Our results show that cell division and consequently, the mitotic index alters and therefore, these are
sensitive indicatives of wheat seed deterioration.
The use of artificial aging stress was an efficient method to
study the changes occurring due to seed deterioration process,
because physiological quality of seeds is negatively affected
by accelerated aging stress time (Table 1). Data obtained in germination (G) and vigor tests (First count of germination (FCG), Electrical conductivity (EC), Seedling emergence in
the field (SEF) and Emergence speed index (ESI)), showed
that aging stress altered decreasing rates in all characteristics evaluated (G, FCG, EC, SFE, ESI) (Table 1). Accelerated
aging stress is based on seed exposure to high temperature
and humidity conditions, and has been used to determine seeds deterioration process and vigor in several species such as soybean (Dutra and Vieira, 2004), maize (Basavarajappa
et al., 1991), cauliflower (Kikuti and Marcos-Filho, 2008)
and rice (Kapoor et al., 2011), including forest species as
Dalbergia nigra (Guedes et al., 2011) and Melanoxylon
brauna (Corte et al., 2010).
According to the current physiological tests results, high
G (more than 90%) was maintained even after 72 hours under aging stress. For FCG data of Onix cultivar, on treatments
maintained 24 h and 48 hours under stress (T2 and T3), no differences from the control were observed (Table 1), whilst T4, T5 and T6 presented a decrease in the FCG values due to seed deterioration process (Table 1). FCG in Campo Real cultivar showed differences since the treatment T2 (Table 1). In the EC tests, only T5 and T6 treatments, when an increase in the electrolyte leakage was detected, differed from the control (Table 1). Among the vigor tests used,
the most efficient was SEF, because it could detect earlier, differences on seed quality (T2 for Ônix and T3 for Campo Real -Table 1). ESI stratified seed lots according to the vigor
in three categories, whereas in SEF test, seed lots were
classified in four and five vigor categories for Onix and
Campo Real cultivars respectively (Table 1).
According to the cytogenetic data, the number of cells under division decreased along aging stress time, concerning all cell division phases (Table 2), representing though an
important indicative of seed aging and consequently, a marker
for seed deterioration process. Cell number at interphase stage
ranged from 349 to 388, and from 312 to 385, for Ônix and
Campo Real, respectively. Metaphase cells were not observed
Table 1. Average rates and percentage of the first count of germination (FCG), germination (G), seedling emergence in the field (SEF), emergence speed index (ESI) and electrical conductivity (EC) for two wheat cultivars, Ônix and Fundacep Campo Real, submitted to six different aging treatments.
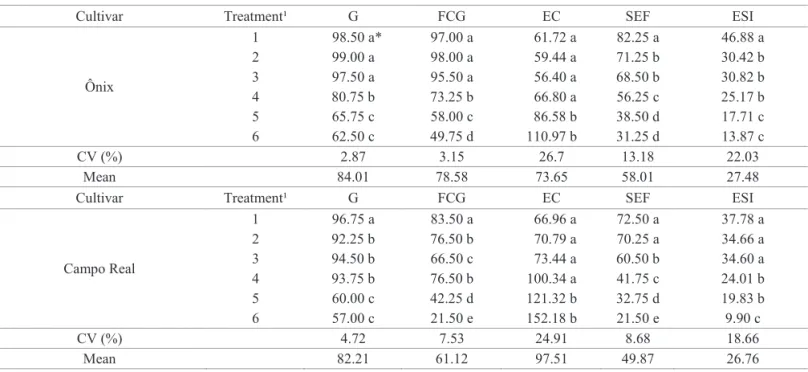
Cultivar Treatment¹ G FCG EC SEF ESI
Ônix
1 98.50 a* 97.00 a 61.72 a 82.25 a 46.88 a
2 99.00 a 98.00 a 59.44 a 71.25 b 30.42 b
3 97.50 a 95.50 a 56.40 a 68.50 b 30.82 b
4 80.75 b 73.25 b 66.80 a 56.25 c 25.17 b
5 65.75 c 58.00 c 86.58 b 38.50 d 17.71 c
6 62.50 c 49.75 d 110.97 b 31.25 d 13.87 c
CV (%) 2.87 3.15 26.7 13.18 22.03
Mean 84.01 78.58 73.65 58.01 27.48
Cultivar Treatment¹ G FCG EC SEF ESI
Campo Real
1 96.75 a 83.50 a 66.96 a 72.50 a 37.78 a
2 92.25 b 76.50 b 70.79 a 70.25 a 34.66 a
3 94.50 b 66.50 c 73.44 a 60.50 b 34.60 a
4 93.75 b 76.50 b 100.34 a 41.75 c 24.01 b
5 60.00 c 42.25 d 121.32 b 32.75 d 19.83 b
6 57.00 c 21.50 e 152.18 b 21.50 e 9.90 c
CV (%) 4.72 7.53 24.91 8.68 18.66
Mean 82.21 61.12 97.51 49.87 26.76
*Means followed by the same letter do not differ by Scott-Knott test (p < 0.05).
¹T1: control ; T2: 24 hours at 42 °C; T3: 48 hours at 42 °C; T4: 72 hours at 42 °C; T5: 96 hours at 42 °C; T6: 120 hours at 42 °C.
Table 2. Number of mitotic cells at different cell cycle phases in two wheat cultivars, Ônix and Fundacep Campo Real, submitted to six different aging treatments.
Ônix Cultivar
Treatment¹ Interphase Prophase Metaphase Anaphase Telophase
RE² IR³ RE IR RE IR RE IR RE IR
T1 351 - 14 - 20 - 7 1 7 -
T2 345 4 18 - 18 - 4 1 10 -
T3 360 1 23 1 5 - 4 1 6 -
T4 368 1 11 1 11 - 3 - 5 -
T5 383 - 1 1 2 2 6 2 3 -
T6 388 - 6 - - - 1 1 3 1
Campo Real Cultivar
Treatment¹ Interphase Prophase Metaphase Anaphase Telophase
RE² IR³ RE IR RE IR RE IR RE IR
T1 311 1 25 1 29 1 10 5 16 1
T2 338 - 23 - 13 - 10 2 14 -
T3 346 1 11 - 16 1 9 1 15 -
T4 352 12 13 3 6 1 1 - 11 1
T5 364 3 13 1 5 - 1 - 7 -
T6 384 1 4 1 3 - 1 - 6 -
¹ T1: control; T2: 24 hours at 42 °C; T3: 48 hours at 42 °C; T4: 72 hours at 42 °C; T5: 96 hours at 42 °C; T6: 120 hours at 42 °C.
² Regular ³ Irregular
In addition, mitotic index (MI) was an efficient indicative
of seed deterioration process. In this evaluation, seed were
stratified in five and six categories, for Onix and Campo Real,
on seed deterioration process can be assessed even in lots
with similar physiological quality. MI ranged from 3 to 12, and from 4 to 22% for Ônix and Campo Real cultivars,
respectively, with a sharp rate decrease along the treatments due to the longer stress period (Table 3). These results are in accordance to Akhter et al. (1992) that studied the effect
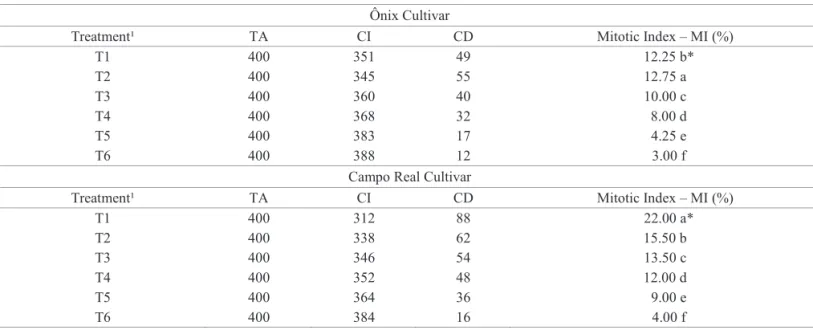
Table 3. Total number of metaphase cells analyzed (TA), at interphase (CI), number of cells under different phases of mitotic
division (CD) and the mitotic index (MI) in two wheat cultivars, Ônix and Fundacep Campo Real, submitted to six
different aging treatments.
Ônix Cultivar
Treatment¹ TA CI CD Mitotic Index – MI (%)
T1 400 351 49 12.25 b*
T2 400 345 55 12.75 a
T3 400 360 40 10.00 c
T4 400 368 32 8.00 d
T5 400 383 17 4.25 e
T6 400 388 12 3.00 f
Campo Real Cultivar
Treatment¹ TA CI CD Mitotic Index – MI (%)
T1 400 312 88 22.00 a*
T2 400 338 62 15.50 b
T3 400 346 54 13.50 c
T4 400 352 48 12.00 d
T5 400 364 36 9.00 e
T6 400 384 16 4.00 f
*Treatments followed by the same letter do not differ by Scott-Knott test (p < 0.05).
¹T1: control ; T2: 24 hours at 42 °C; T3: 48 hours at 42 °C; T4: 72 hours at 42 °C; T5: 96 hours at 42 °C; T6: 120 hours at 42 °C.
of age on wheat and barley seeds. The authors observed
that germination percentage and mitotic index gradually
decreased with the storage time. This corroborates the potential of cytogenetic analysis to distinguish seed lots
accordingly to seeds physiological quality and stage of
deterioration process.
When we compare physiological tests with cytogenetic analyses, here obtained data suggests that seed deterioration process primarily reduces cell division and MI, which
consequently, negatively affects seed vigor, resulting in
reduced FCG, SEF and ESI, and at advanced deterioration stages, affects germination rates (Tables 1, 2 and 3). According to Mahajan and Tuteja (2005), plants submitted to stress condition of salt and drought also showed reduction in
growth, inhibition of cell division and expansion.
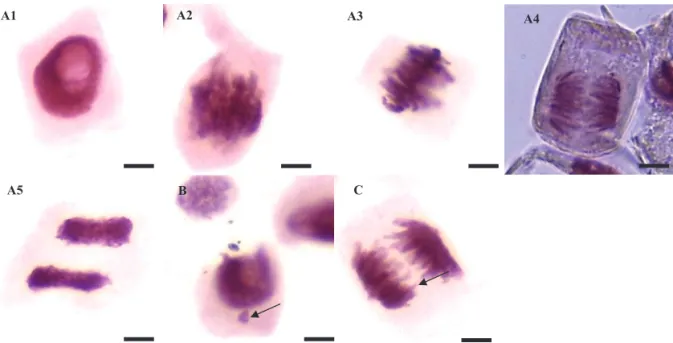
Abnormalities in mitotic cells were detected in both cultivars (Table 4, Figures 1 and 2). In prophase, the chromosomes are already visible, preparing to metaphase, however, when they
exhibit distinct pattern of organization, any irregularities are
occurring, probably related to the mitotic spindle formation and chromosome condensation already duplicated from the interphase. The chromosomes disorganization at this stage will probably interfere with the regularity of metaphase due to disturbances in mitotic spindle. The appearance of disorganized metaphase is due
to diffuse arrangement of chromosomes in the equatorial plane
of the cell. This chromosome aberration is considered a sign of malformation or partial inactivation of the spindle, however, little is known about the activities of the zone are directly regulated (Marcano et al., 2004). Therefore, in the normal cell division, the
metaphase show the chromosomes organized in the equatorial
plate (Tedesco and Languinghouse, 2012).
Only low cell irregularities rates were detected in control whilst in stress treatments, although aberrations were observed, no relation between cell abnormalities and the period of aging
stress could be establish. The most significant irregularities
Table 4. Number of cells under mitotic division (CD), number and types of cell division abnormalities (Choromossome
Breaks and Lost (CBL); Binucleate Cells (BC); Bridge (B); Disorganized Cells (DC)) and Total number of Irregular Cells (TIC) in two wheat cultivars, Ônix and Fundacep Campo Real, submitted to six different aging treatments.
Ônix Cultivar
Treatment¹ CD
Cells Abnormalities
Irregular Cells (%)
Cells MN* CBL BC B DC TIC
Interphase Division
T1 49 - - 1 - - - 1 2.00 e**
T2 55 3 - - 1 1 - 1 1.80 e
T3 40 1 1 - - 1 - 2 5.00 c
T4 32 1 1 - - - - 1 3.10 d
T5 17 - 1 - - - - 1 5.90 b
T6 12 - - 1 1 - 3 5 41.70 a
Campo Real Cultivar Treatment¹ CD
Cells Abnormalities
Irregular Cells (%)
Cells MN* CBL BC B DC TIC
Interphase Division
T1 88 - - - - 2 - 2 2.30 f**
T2 64 - - 2 1 4 2 8 12.50 a
T3 54 1 - - - 1 1 2 3.70 d
T4 48 12 1 2 1 - 1 5 10.40 b
T5 36 3 1 - - - - 1 2.80 e
T6 16 1 - - - - 1 1 6.20 c
*Micronucleated cells.
** Treatments followed by the same letter do not differ by Scott-Knott test (p < 0.05).
¹T1: controll ; T2: 24 hours at 42 °C; T3: 48 hours at 42 °C; T4: 72 hours at 42 °C; T5: 96 hours at 42 °C; T6: 120 hours at 42 °C.
A4
A2 A3
A5 B C
A1
Figure 1. Mitotic cells from the wheat cultivar Ônix at different stages of cell division. Interphase cells (A1) and regular
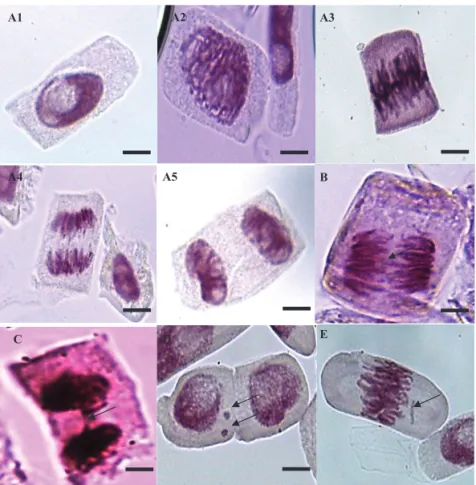
Figure 2. Mitotic cells from the wheat cultivar Campo Real at different stages of cell division. Interphase cells (A1) and regular cell division phases: (A2, A3, A4 and A5: prophase, metaphase, anaphase and telophase respectively). B, C, D and E: nuclei containing characteristics of irregular mitotic division. B: anaphasic bridge. C: telophasic bridge. D: micronuclei and E: metaphase with chromosome lost.
E
A1 A2 A3
A4 A5 B
C D
Conclusions
Vigor and mitotic cell division are affected by deterioration
induced by artificial aging stress.
Mitotic index reduces along prolonged period of aging
stress.
References
ABRASEM. Associação Brasileira de Sementes e Mudas. Estatística da produção. AnuárioAbrasem, Pelotas, 2013.64p.
ABREU, L.A.S.; CARVALHO, M.L.; PINTO, C.A.G.; KATAOKA, V.Y.; SILVA, T.T.A. Deterioration of sunflower seeds during storage. Journal
of Seed Science, v.35, n.2, p.240-247, 2013.http://www.scielo.br/scielo.
php?pid=S2317-15372013000200015&script=sci_arttext
AKHTER, F.N.; KABIR, G.; MANNAN, M.A.; SHAHEEN, N.N. Aging effect of wheat and barley seeds upon germination mitotic index
and chromosomal damage. Journal of Islamic Academy of Sciences, v.5, p.44-48,1992.<http://www.medicaljournal-ias.org/Belgelerim/Belge/
AkhterMVFKGYUEJS71027.pdf
BASAVARAJAPPA, B.S.; SHETTY, H.S.; PRAKASH, H.S. Membrane
deterioration and other biochemical changes, associated with accelerated ageing of maize seeds. Seed Science and Technology, v.19, p.279-286, 1991.
BRASIL. Ministério da Agricultura, Pecuária e Abastecimento. Regras para
análise de sementes. Ministério da Agricultura, Pecuária e Abastecimento.
Secretaria de Defesa Agropecuária. Brasília: MAPA/ACS, 2009. 395p. http:// www.bs.cca.ufsc.br/publicacoes/regras%20analise%20sementes.pdf
CORTE V.B.; BORGES, E.E.L.; LEITE, H.G.; PEREIRA, B.L.C.; GONÇALVES, J.F.C. Estudo enzimático da deterioração de sementes de
Melanoxylon brauna submetidas ao envelhecimento natural e acelerado.
Revista Brasileira de Sementes, v.32, n.1, p.83-91, 2010. http://www.scielo.
br/pdf/rbs/v32n1/v32n1a10.pdf
DELOUCHE, J.C.; BASKIN,C.C. Accelerated ageing techniques for
predicting the relative storability of seed lots. Seed Science and Technology, v.1, p.427-452, 1973.
DUTRA, A.S.; VIEIRA, R.D. Envelhecimento acelerado como teste de vigor
para sementes de milho e soja. Ciência Rural, v.34, n.3, p.715-721, 2004. http://
www.scielo.br/scielo.php?pid=S0103-84782004000300010&script=sci_arttext
FERREIRA, D.F. Sisvar: a computer statistical analysis system. Ciência
e Agrotecnologia, v.35, p.1039-1042,2008.<http://www.scielo.br/scielo.
GUEDES, R.S.; ALVES, E.U.; OLIVEIRA, L.S.B; ANDRADE, L.A.; GONÇALVES, E.P.; MELO, P.A.R.F. Envelhecimento acelerado na
avaliação da qualidade fisiológica de sementes de Dalbergia nigra (Vell.) Fr.
All. Semina: Ciências Agrárias, v.32, p.443-450, 2011. http://www.uel.br/
revistas/uel/index.php/semagrarias/article/view/3247
GUERRA, M.; SOUZA, M.J. Como observar cromossomos – Um guia de
técnicas em citogenética vegetal, animal e humana. Ribeirão Preto: FUNCEP,
2002. 191p.
KHAN, M.M.; IQBAL, M.J.; ABBAS, M.; USMAN, M. Effect of ageing on
viability, vigour and chromosomal damage in pea (Pisum sativum L.) seeds.
Pakistan Journal of Agricultural Sciences, v. 40, p.50-54, 2003.< http://
pakjas.com.pk/upload/92689.pdf>
KAPOOR, N.; ARYA, A.; SIDDIQUI, M.A.; KUMAR, H.; AMIR, A.
Physiological and biochemical changes during seed deterioration in aged seeds of rice (Oryza sativa L.). American Journal of Plant Physiology, v. 6, p.28-35, 2011. <http://scialert.net/abstract/?doi=ajpp.2011.28.35>
KIKUTI, A.L.P.; MARCOS- FILHO, J. Physiological potential of cauliflower
seeds. Scientia Agrícola, v.65, p.374-380, 2008. http://www.scielo.br/scielo.
php?script=sci_arttext&pid=S0101-31222007000100015
KIZINBA, S.;VINEL, D.; CÔME, D.; BAILLY, C.; CORBINEAU, F. Sunflower seed deterioration as related to moisture content during ageing, energy metabolism and active oxygen species scavening. Physiologia
Plantarum, v.128, p.496-506, 2006. http://onlinelibrary.wiley.com/
doi/10.1111/j.1399-3054.2006.00771.x/abstract>.
MAGUIRE, J.D. Speed of germination-aid in selection and evaluation for seedling emergence and vigour. Crop Science, v.2, p.176-177, 1962. https:// www.crops.org/publications/cs/abstracts/2/2/CS0020020176
MAHAJAN, S.; TUTEJA, N. Cold, salinity and drought stresses: an
overview. Archives of Biochemistry and Biophysics, v.444, p.139–158, 2005. http://www.uam.es/personal_pdi/ciencias/solsa/revsaltstress.pdf
MARCANO, L.; CARRUYO, I.; CAMPO, A.D.; MONTIEL, X. Cytotoxicity
and mode of action of maleic hydrazide in root tips of Allium cepa L.
Environmental Research, v.94, p.221-226, 2004. http://www.sciencedirect.
com/science/article/pii/S001393510300121X
MARINI, P.; MORAES, C.L. ; LARRE, C.F.; LIMA, M.C.; MORAES, D.M.; AMARANTE, L. Indicativos da perda de qualidade de sementes de arroz sob diferentes temperaturas através da atividade enzimática e respiratória.
Interciencia, v. 38, p. 54-59, 2013. http://www.interciencia.org/v38_01/054.pdf
McDONALD, M.B. Seed deterioration: physiology, repair and assessment.
Seed Science and Technology, v.27, p.177-237, 1999.
MURTHY, U.M.N.; KUMAR, P.P.; SUN, W.Q. Mechanisms of seed ageing
under different storage conditions for Vigna radiata (L.) Wilczek: lipid
peroxidation, sugar hydrolysis, Maillard reaction and their relationship to
glass state transition. Journal of Experimental Botany, v.54, p.1057-1067,
2003. <http://jxb.oxfordjournals.org/content/54/384/1057.long>
OHLSON, O.C.; KRZYZANOWSKI, F.C.; CAIEIRO, J.T.; PANOBIANCO,
M. Teste de envelhecimento acelerado em sementes de trigo. Revista Brasileira
de Sementes, v.32, p.118-124, 2010. http://ainfo.cnptia.embrapa.br/digital/
bitstream/item/30176/1/Osvaldo-Revista-Brasileira-de-Sementes.pdf
OSBORNE, D. J.; SHARON, R.; BEN-ISHAI, R. Studies on DNA integrity
and NA repair in germinating embryos of rye (Secale cereale). Israel Journal
of Botany, v.29, p.259-272, 1981. < http://www.tandfonline.com/doi/abs/10.1
080/0021213X.1980.10676892>
SHEWRY, P.R. DARWIN REVIEW Wheat. Journaf of Experimental Botany,
v.60, p.1537-1553, 2009. <http://jxb.oxfordjournals.org/content/60/6/1537.
full.pdf+html>
SHIBATA, M.; COELHO, C.M.M; OLIVEIRA, L.M.; GARCIA, C.
Accelerated aging of ipê seeds under controlled conditions of storage. Revista
Brasileira de Sementes, v.34, n.2, p.247-254, 2012. http://www.scielo.br/
scielo. php?script=sci_arttext&pid=S0101-31222012000200009
SLUPPHAUG, G.; KAVLI, B.; KROKAN, H.E. The interaction pathways for prevention and repair of oxidative DNA damage. Mutation Research /
Fundamental and Molecular Mechanisms of Mutagenesis, v.531,
p.231-251, 2003. <http://www.sciencedirect.com/science/article/pii/ S0027510703001738>
TEDESCO, S.B.; LANGHINGHOUSE IV, H.D. Bioindicator of Genotoxicity:
the Allium cepa test. In: Solange Bosio Tedesco & Haywood Dail