A MACHINE LEARNING AND BIG DATA
APPROACH TO PREDICT MULTIDRUG
RESISTANT HOSPITAL ACQUIRED INFECTION IN
THE NEXT 72 HOURS
by
José Pedro Almeida
For the degree of
Master of Science, Data Analytics
Supervised by
Professor João Manuel Portela da Gama
Professor Pavel Brazdil
2016
A
BSTRACTThe use of Advanced Data Analytics Techniques like Machine Learning and its appliance to the medical area has been a long waited promising phenomenon. Electronic Medical Record databases hold out the promise of using the clinical patient data stored in these databases to apply machine learning algorithms that can provide models to better predict patient conditions in advance.
In this thesis we intend to tackle a very serious phenomenon that is Hospital Acquired Infection caused by Multi Drug Resistant bacteria in a General Hospital environment. Based on the automatic extraction of thousands of clinical variables that are stored daily in the patient’s Electronic Medical Record (or that can be calculated from it), combined with Machine Learning techniques we tried to develop predictive models that are able to weight and model the hidden contribution that the correlation and evolution of each of these variables represents to the risk of developing a Multi Drug Resistant bacteria in the following 72 hours of an inpatient day. Therefore, we developed an automated approach that intends to demonstrate that it is possible to generate predictive models with satisfactory predictive power to be used in clinical practice, as a complement of the manual, subjective and biased process that is currently in place, i.e. the physician’s empirical judgement.
S
HORTB
IOGRAPHYThe author of this thesis is a recognized professional in the Health Analytics space, being the mentor of an intelligent decision support system that collects and analyses thousands of patient variables spread out in several hospital systems and allows to predict ICU admissions at least 7 days before they occur. With his work, the author was recognized worldwide, winning the “2014 Microsoft Health Users Group Innovation Award” in Orlando, Florida, the “2013 Big Data & Analytics Solution of the Year”, prize by IT Europa, in London, and the Rotary “Professional of the Year” award in 2014.
The author has over 8 years of experience working in hospital environments.
In his daily work, the author has a lot of responsibilities and works intensively and passionately. This fact represented an additional obstacle to complete this course and this thesis, due to the time restriction that his professional responsibilities impose. It was also an obstacle to the deepness of this thesis as far as Machine Learning algorithm research is concerned, as the author had to focus mainly in using what is available in the community from this perspective.
While writing this thesis, the author also managed to be able to attend and successfully complete the Health Innovation Executive Program in the INSEAD Business School. This program lasted 6 months (January 2016 to May 2016) and the classes were attended in Fontainebleau, Paris.
In this time period, the author was also able to design and obtain funding from the EU, to finance a Big Data project using Machine Learning and Natural Language Processing to assist in clinical decision. This thesis contributes for his growing effort in this area.
A
CKNOWLEDGEMENTSAfter an intensive period of twelve months, today is the day: writing this note of thanks is the finishing touch on my thesis. In fact, these twelve months were actually twenty four months, if I have into account the months related with night classes and exams. It has been a period of great sacrifice for me, as this work was developed in parallel with my already demanding daily job. It involved working late hours during weekdays and a full commitment to this research during the weekends. This made me reflect on the people who have supported and helped me so much throughout this period.
In that sense, my words go entirely to my wife, Raquel Costa. Her support was unbelievable, and, for hundreds of times, she accepted to sacrifice our personal life and our moments together, in detrimental of this work, and the cause that lies beneath. Without her support, this work would be completely unattainable. I will not even mention the long hours she dedicated to review this thesis and the precious advices she gave me in this process. She showed me, once again, that she is the love of my life.
Besides, I cannot forget the help that all the doctors which I interviewed in my research. They were really helpful and gave me the support needed to proceed. Thank you, to all of you.
Finally, a reference to my professor João Gama, who has been a great supervisor. He was always available to help me to address the several challenges I was facing throughout this work and helped me simplify some of the complex tasks I had, with his ability to see the big picture. His positivity was also very inspiring for me.
T
ABLE OFC
ONTENTS ABSTRACT ... 1 SHORT BIOGRAPHY ... 2 ACKNOWLEDGEMENTS ... 3 TABLE OF CONTENTS ... 4 LIST OF TABLES ... 6LIST OF TABLES IN APPENDIX ... 7
LIST OF FIGURES ... 8
LIST OF FIGURES IN APPENDIX ... 12
LIST OF ABBREVIATIONS... 13
1. INTRODUCTION ... 14
1.1PROBLEM OVERVIEW ... 14
1.2RESEARCH QUESTIONS ... 18
1.3LITERATURE REVIEW:MAIN LINES ... 20
1.4PLAN FOR THE THESIS ... 22
2. DATA MINING PROBLEM ... 28
2.1BUSINESS PROBLEM UNDERSTANDING ... 28
2.2UNDERSTANDING THE BUSINESS USER ... 31
2.3BUSINESS USERS INTERVIEW ... 32
2.4BUSINESS PROBLEM MODELLING ... 35
3. DATA EXTRACTION,CORRELATION AND UNDERSTANDING ... 36
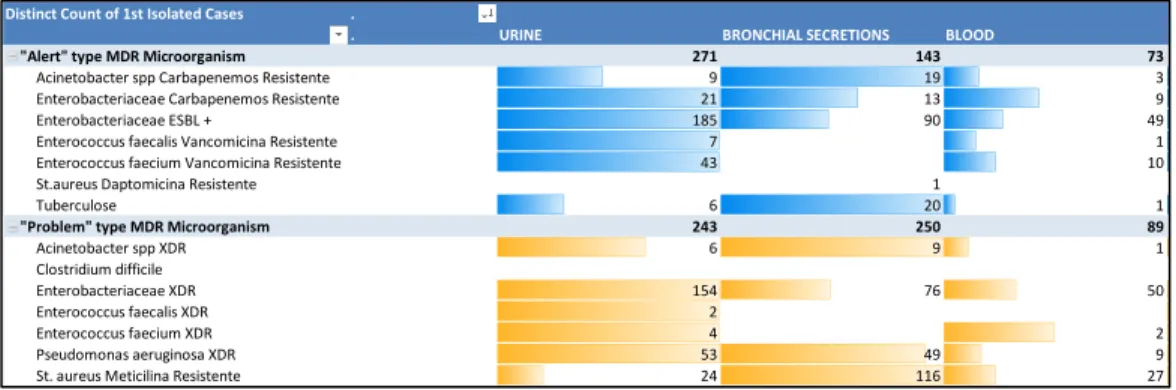
3.1DATA EXTRACTION AND CORRELATION ... 36
3.2QUICK EXPLORATORY DATA ANALYSIS ... 44
3.3DATA PROBLEMS &REDEFINITION OF THE BUSINESS PROBLEM ... 46
3.4FURTHER EXPLORATORY DATA ANALYSIS ... 51
4. DATA PREPARATION (FEATURE ENGINEERING) ... 61
4.1CREATING NEW CALCULATED VARIABLES FROM EXISTING ONES ... 61
4.2FEATURE TRANSFORMATION ... 64
5. MODELING &EXPERIMENTATION METHODOLOGY ... 72
5.1APPROACH TO THE BUSINESS PROBLEM -THE DATA DRIVEN APPROACH ... 72
5.2MODELLING THE DATA –FINAL DATASET COMPOSITION ... 73
5.3R AS THE MACHINE LEARNING TOOLKIT OF CHOICE ... 74
5.4ACCOUNTING FOR UNBALANCED DATASETS ... 77
5.5METHODOLOGY USED FOR TRAINING ... 79
5.6SOME NOTES ON ENSEMBLE METHODS ... 82
5.7TRAINING ALGORITHMS ON BIG DATASETS ... 83
5.8WEKA FOR FAST MODELING ... 85
6. EVALUATION ... 87
6.1EVALUATING MACHINE LEARNING ALGORITHMS ... 87
6.2PERFORMANCE RESULTS ON DIFFERENT BIOLOGICAL SAMPLES ... 88
6.3PERFORMANCE RESULTS ON COMPLETELY UNSEEN DATASET ... 98
6.4VARIABLE IMPORTANCE –DOCTORS FEEDBACK ... 99
7. CONCLUSIONS,DISCUSSION AND FUTURE WORK ... 106
7.1SUMMARY ... 106
7.2CONCLUSIONS AND DISCUSSION ... 107
7.3FUTURE WORK ... 110
8. APPENDICES... 114
8.1APPENDIX 1:ADDITIONAL WORK ... 114
8.2APPENDIX 2:RCODE ... 117
8.3APPENDIX 3:ADDITIONAL REFERENCE TABLES ... 121
L
IST OFT
ABLESTable 1: Illustrative Table of how surgeries registries are stored in hospital operational systems ... 36 Table 2: Illustrative Table of how Biochemistry Lab Results are stored in hospital operational systems ... 37 Table 3: Illustrative Table of how Microbiological Lab Results are stored in hospital operational systems ... 38 Table 4: Illustrative Table of how Microbiological Lab Results are treated by a hospital Algorithm to check if the result is MultiDrug Resistant ... 38 Table 5: Illustrative Table of how Vital Signs are stored in hospital operational systems ... 39 Table 6: Illustrative Table of how Drugs administered are stored in hospital operational systems ... 39 Table 7: Illustrative Table with Patient Demographics and additional calculated variables for each episode ... 40 Table 8: Illustrative Table with the information contained in the EMR that allows us to follow a patient's physical trajectory through the hospital as he/she moves from department to department ... 41 Table 9: Types of Vitals and Lab Results Categories used in the Predictive Model ... 62 Table 10: Some columns of the Multidimensional Dataset built for each patient ... 74 Table 11: Summary of the performance of different algorithms on the dataset used to predict HAI MDR bacteria (blood samples). ... 88 Table 12: Summary of the performance of different algorithms on the dataset used to predict HAI MDR bacteria (blood samples). ... 89 Table 13: Evaluation results for the Blood Samples Model, considering the “Infected” class (HAI MDR bacteria in the next 72 hours). ... 91 Table 14: Evaluation results for the Bronchial Secretions Samples Model, considering the “Infected” class (HAI MDR bacteria in the next 72 hours) ... 96 Table 15: Evaluation results for the Urine Samples Model, considering the “Infected” class (HAI MDR bacteria in the next 72 hours). ... 97
L
IST OFT
ABLES INA
PPENDIXTable A 1: Short description of columns removed from original dataset due to NULL values (all values were NULL). ... 123 Table A 2: Short description of columns removed from original dataset due to zero variance ... 128
L
IST OFF
IGURESFigure 1: Automated Approach to obtain phenotyping information ... 24 Figure 2: Overview of the Architecture of this Automated System ... 25 Figure 3: Timeline of the Thesis Plan with Milestones and Tasks to Accomplish ... 26 Figure 4: World Health Organization’s - 5 Moments for Hand Hygiene in acute care settings. Reproduced from “Five Moments for Hand Hygiene,” World Health Organization, 2009, http://www.who.int/gpsc/tools/Five_moments/en/, accessed February 2016. All rights reserved. ... 28 Figure 5: Centers for Disease Control and Prevention - CDC’s Antibiotic-Resistant Threats in the United States, 2013. Reproduced from “ANTIBIOTIC RESISTANCE THREATS in the United States, 2013” Centers for Disease Control and Prevention, 2013 ... 30 Figure 6: Feedback Loop with the collaboration of the Business Users ... 31 Figure 7: Print of Physicians Drawing while explaining of factors that Physician take into account when presented with patients with Infection Signs ... 32 Figure 8: Empirical Thinking Process of a Physician when facing patients with Infection Signs ... 33 Figure 9: Print of Physicians Notes while explaining what a positive (+) and negative (-) lab result might mean to change clinical decisions ... 34 Figure 10: Example of how DrugIDs were grouped into Pharmacotherapeutic groups ... 44 Figure 11: Exploratory Data Analysis of the most common infections grouped by MDR bacteria ... 45 Figure 12: Exploratory Data Analysis of MDR bacteria occurrence in each of the Body Locations ... 45 Figure 13: Illustrative Diagram of how the Initial Dataset for this work was Split in three different datasets ... 46 Figure 14: Histogram illustrating the Balance of Positive and Negative Cases for each MDR bacteria in blood samples ... 47 Figure 15: Histogram illustrating the Balance of Positive and Negative Cases for each MDR bacteria in respiratory samples ... 47
Figure 16: Histogram illustrating the Balance of Positive and Negative Cases for each MDR bacteria in urine samples ... 48 Figure 17: Illustrative Diagram of how the new calculated columns for the outcome were built ... 50 Figure 18: Illustrative Diagram of the tree final Datasets used in the predictive modelling phase, with a single aggregated outcome column ... 50 Figure 19: Illustrative Diagram of the major groups of predictors involved in this work’s dataset ... 51 Figure 20: Illustrative Diagram WEKA’s scatter plot functionality (Visualize Tab) ... 52 Figure 21: Number of days in the hospital (X Axis) plotted against patient age (Y Axis) .. 53 Figure 22: Several scatter plot graphics. Each graphic has these variables plotted: (0/1) Flag signaling if the patient is hospitalized in a specific Department (X Axis) plotted against hours elapsed since the admission in the current clinical department (Y Axis) ... 54 Figure 23: (0/1) Flag signaling if the patient is hospitalized in the Burns Unit Department (X Axis) plotted against hours elapsed since the patient entered the department (Y Axis) . 55 Figure 24: First Measurement of Hemoglobin in the last 36 hours (X Axis) plotted against Standard Deviation of Systolic Blood Pressure in the last 24 hours ... 56 Figure 25: Cumulative days on Anti-infectious drugs for the skin (X Axis) plotted against consecutive days on genitourinary dysregulation drugs ... 57 Figure 26: Random variables chosen from the dataset (X Axis) plotted against the number of consecutive days on thyroid gland drugs (first plot), number of consecutive days on Genitourinary dysregulation drugs (second plot) and the number of cumulative days on anti-anemic drugs (third plot) (Y Axis) ... 58 Figure 27: Cumulative days on anti-thrombotic drugs (X Axis) plotted against Cumulative days on anti-thrombotic drugs (Y Axis) ... 59 Figure 28: Local Susceptibility of Enterococcus Faecium Bacteria to Daptomycin antibiotic (X Axis) plotted against Hospital Susceptibility of Enterobacter Bacteria to Gentamycin antibiotic (Y Axis) ... 60 Figure 29: Data Science Process used in this Work (Relative Time Lost in each Step) ... 61
Figure 30: Diagram illustrating how we obtained 32 new calculated variables from each lab result and vital sign ... 63 Figure 31: Figure illustrating the results of the transform function (R Caret package) after standardizing our dataset ... 66 Figure 32: Google Refine showing an estimate of 435 minutes to load the Dataset for this problem ... 70 Figure 33: Number of cells affected by removing five columns in the CSV Spreadsheet with the Data for this problem ... 70 Figure 34: Example of the thousands of errors that we needed to debug in R throughout this work ... 71 Figure 35: Workflow used to convert Raw Data into a data format that is prepared to be used by a Machine Learning Model (figure credits to Abhishek Thakur) ... 73 Figure 36: Workflow used to train the Machine Learning Models using the Caret Package resampling and model tuning agile methods ... 77 Figure 37: Diagram of the Training Procedure used for all Algorithms, holding-out a test dataset, with the help of R Caret functions ... 82 Figure 38: Impact of parallelization on the training time of a GBM algorithm (measured on a sample of the dataset used in this work) ... 84 Figure 39: Print Screen of WEKA memory errors due to the Big Data nature of the dataset used in this work ... 85 Figure 40: Print Screen of R Studio memory errors due to the Big Data nature of the dataset used in this work ... 85 Figure 41: Print of R Caret Package doing an automated parameter tuning while training a GBM model on a dataset to predict HAI MDR bacteria on Blood samples ... 87 Figure 42: Selection of the best value for mtry using grid search parameter tuning of Caret Package. ... 90 Figure 43: Histogram of the Outcome variable (“MDRXDRSANGUE72”) in the Blood samples model (some text in Portuguese). ... 90 Figure 44: ROC Curve for the Blood Samples Model. ... 91
Figure 45: Classification Matrix for the Blood Samples Model regarding HAI MDR bacteria in the next 72 hours (some text in Portuguese). ... 92 Figure 46: WEKA cost benefit analysis screen displaying the results of the Blood Samples, with a 0.51 threshold (some text in Portuguese). ... 93 Figure 47: WEKA cost benefit analysis screen displaying the results of the Blood Samples, with a 0.31 threshold, after running the Minimize Cost/Benefit function (some text in Portuguese). ... 94 Figure 48: Histogram of the Outcome variable (“MDRXDRSECRECOES72”) in the Bronchial Secretions model (some text in Portuguese). ... 95 Figure 49: Histogram of the Outcome variable (“MDRXDRURINA72”) in the Urine samples model (some text in Portuguese). ... 96 Figure 50: Evaluation results for the Blood, Bronchial Secretions and Urine Samples Models, considering a 2016 test set. ... 99 Figure 51: Plot illustrating the relative importance of each variable in the Blood samples model ... 100 Figure 52: Description of the top 20 variables of the Blood samples model, in terms of variable importance, together with physician’s notes about some of them ... 101 Figure 53: Box-Plot of the outcome variable (X Axis) and the variable “AVG_7D_CAT6” for the blood sample dataset ... 102 Figure 54: Plot illustrating the relative importance of each variable in the Bronchial secretions samples model ... 103 Figure 55: Description of the top 20 variables of the Bronchial Secretions model, in terms of variable importance, together with physician’s notes about some of them. ... 104 Figure 56: Box-Plot of the outcome variable (X Axis) and the variable “STDEV_36H_CAT12” for the bronchial secretions dataset ... 105
L
IST OFF
IGURES INA
PPENDIXFigure A 1: R code related to the systematic implementation of all Feature engineering tasks – (some text in Portuguese). ... 120 Figure A 2: R code related to a common framework that was used to train all models used in this work, by applying the functions available in the Caret package. ... 120 Figure A 3: R code related to the implementation of parallelization frameworks while training algorithms in R Studio. ... 120
L
IST OFA
BBREVIATIONSAUC - Area Under the ROC Curve
CDC - Centers for Disease Control and Prevention
CRISP-DM - Cross-Industry Standard Process for Data Mining CRM - Customer Relationship Management
CSV - Comma Separated Value DW - Data Warehouse
DGS - Direção Geral de Saúde (in PT) - Portuguese General Health Coordination EMR - Electronic Medical Record
GBM - Gradient Boosting Machine GLM - Generalized Linear Model HAI - Hospital Acquired Infection ICU - Intensive Care Unit
MDR - Multi Drug Resistant ML - Machine Learning
MRSA - Methicillin Resistant Staphylococcus Aureus NB - Naïve Bayes
RF - Random Forest
SQL - Structured Query Language SVM - Support Vector Machines
WEKA - Software Waikato Environment for Knowledge Analysis WHO - World Health Organization
1.
I
NTRODUCTION
This chapter begins with a high-level overview of the problem to be addressed. Next, the research questions that will drive this work are stated. Before moving forward, a literature review regarding the problem to be addressed is exposed, in order to increase the knowledge about the problem and, also, to sign the motivation to develop this work. The chapter ends with a high level description of the plan that is going to be followed to develop this research.
1.1
P
ROBLEMO
VERVIEWIn April 2014, the World Health Organization (WHO) announced the results of its first global report on antimicrobial resistance. The report stated that antibiotic resistance is a worldwide threat to public health and is happening right now, in every region of the world, with the potential to affect anyone, of any age, in any country (World Health Organization, 2014). As a consequence, the appearance of a series of Multi Drug Resistant (MDR) bacteria poses a difficult task for physicians, who have limited therapeutic options. Particularly, Hospital Acquired Infections (HAIs) are frequently caused by MDR bacteria and are a major threat to patient safety (Aranaz et al., 2008; Nascimento et al., 2013). Those infections that are caused by MDR microorganisms are of special concern because they impose additional morbidity, mortality and costs, due to the patient’s immune system vulnerability during his/her hospital stay (Cornejo et al., 2014; Tacoconelli, 2006; Lambert et al., 2011). In Portugal, a study from Fiorentino (2014) reveals that HAIs result in average extra costs, per patient, between 7,930.84€ and 11,230.42€; an extra average length of stay between 20 and 25 days; and expected difference of mortality rate between 8.58% and 18.18%.
The rise of resistance, together with the shortage of new broad-spectrum antibiotics, underlines the urgency of optimizing the use of available drugs. Nevertheless, much of the process that goes from suspecting that the patient has caught a HAI MDR bacteria to choosing the right antibiotic treatment, remains empiric (Burke, 1998; Sedighi et al., 2014).
Usually, even before the patient’s microbiological lab sample is requested, or while these results are still being published, which takes 3 to 5 days after the request, the antibiotic treatment process has already started. Physicians, relying only on their empirical experience, usually start antibiotic therapy before lab results are published. However, HAI MDR bacteria events bring more complexity in the empirical treatment of these infections, as this first-hand approach might not result (Sedighi et al., 2014).
The window of time that goes from the infection suspicion to the lab’s definitive confirmation of the microbiological agent represents an opportunity to develop new data driven approaches that can help physicians to predict the species and resistance profile of a HAI MDR bacteria. Predictive models in these areas could help physicians to be more efficient in their daily activity of treating infections and applying the right antibiotic earlier, even before the lab results are published.
Currently, the clinical practice generates exchanges and stores huge amounts of clinical information about each patient encounter that is not being fully leveraged. In addition to the traditional clinical notes, databases in modern hospitals automatically capture structured data relating to all aspects of care, including laboratory test results, diagnosis, medication and imaging data. With the astonishing capabilities of the more recent Machine Learning Algorithms (Domingos, 2015), this poses a real opportunity to apply Machine Learning (ML) in medical practice and to predict harmful events like a HAI caused by a MDR bacteria.
This thesis intends to demonstrate that, in an acute care general hospital scenario, where patient records are mostly electronic and based on Electronic Medical Record (EMR) software, the use of automated models, that can leverage the systematic and fast analysis of hundreds of patient variables stored in these databases, might be helpful in predicting HAI caused by MDR bacteria earlier. These models can also be important to help identifying potential predictors for the presence of MDR bacteria and, therefore, contribute to the development of new clinical guidelines and systematic approaches to this phenomenon. In that sense, major objectives of this thesis are:
1. To develop a predictive model for HAI MDR bacteria in the next 72 hours of an inpatient episode. This can help clinicians to match high-risk patients with the appropriate interventions or therapies (e.g. antibiotics) earlier than current practice which is heavily dependent on the doctor’s intuition, while waiting for the microbiological lab results that usually take several days to be published.
2. To develop a fully automated approach using BigData, that can extract the patient’s electronic information stored in hospital databases (ex: EMR’s) and automatically feed a predictive model for HAI MDR bacteria with the existing electronic data. This model is meant to be run on every inpatient day and it is expected to update its predictions for every single day the patient is at the hospital.
3. To find new variables that might have predictive power for HAI MDR and which can be unknown to the clinicians, thus contributing to refine clinical guidelines currently in use.
4. To develop an automated approach to build and update a complex and multifactorial clinical dataset, with more than 1500 clinical variables, that may be used to train and develop other predictive models more rapidly in the future. For instance, a predictive model for predicting Intensive Care Unit (ICU) admissions could be built faster, as the dataset used for this thesis will capture much of the multidimensional variables that characterize a patient in several clinical events of interest (vital signs, medication, lab results, previous episode history, among others).
The main goal of this thesis is to build an automated patient risk-stratification model for HAI MDR bacteria in the next 72 hours, based merely on the variables coming from the patients EMR and also relying on ML algorithms capabilities. However, as all the data that will be used to feed this models will come from real EMR data, and not from curated datasets, the successful development of these risk-stratification models will present several challenges as far as accuracy is concerned (Wiens, 2014), namely:
Real Data: The data that will be used to build the predictive models will be real data coming from the patient’s EMR. Therefore, it is expected to obtain several inconsistencies and missing values. The quality of data in EMRs, in which information is often missing from structured fields or is incorrect, poses a serious obstacle to the development of this kind of clinical decision support system.
High Dimensionality: In each inpatient day, a patient can have hundreds of different variables representing his/her episode, from a clinical point of view. Some of these variables will have different degrees of contribution and correlation with the patient’s risk for nosocomial infection.
Temporal Characteristic: Some patient variables will be time-independent (ex: sex) while others will have high importance only in a specific timeframe (ex: blood pressure). Besides, all the patient data are not registered at the same time; for instance, vital signs can be measured every day or three times a day, while blood results might only be requested one time per week for some patients, and 7 times per week for other patients. These time-varying data suggest that, as a patient spends time in the hospital, his/her actual risk of acquiring a HAI MDR bacteria will also vary. All these temporal aspects represent additional challenges.
Unbalanced Data: This thesis intends to predict HAI MDR in the next 72 hours of each inpatient day. The object of interest is very infrequent with relation to the alternate objects (patients without MDR infection). Dealing with this kind of unbalanced dataset and predicting the minority class is frequently a challenge. The absence of strategies to address unbalanced data inevitably leads the algorithms to learn to over identify common-class data and will constrain the efforts to understand meaningful patterns across rare cases or within rare classes of data (Bradley, 2016). Some of the techniques that might be used in this thesis to deal with this kind of challenges are related to 1) corrective data sampling to create a more balanced dataset; or 2) the use of costs to force the modeling algorithm to focus on cost
minimization, rather than on maximizing first-pass accuracy (cost-sensitive learning).
1.2
R
ESEARCHQ
UESTIONSWe address the above-mentioned problem by formulating the following research questions: Question 1: Can we build predictive models using the best ML algorithms and a Big Data (“More Data Beats Better Algorithms”) approach in order to provide insights about hospitalized infected patients with MDR bacteria, in advance, and help clinical teams to anticipate actions on these patients?
Question 2: By only using data coming from electronic medical data stored in hospital databases, will it be possible to assess all hospitalized patients, in every inpatient day and, return a robust prediction about any patient being infected with a MDR bacteria in the following 72 hours? Will the available data be enough in order to teach predictive models how to distinguish patients that will be infected with MDR bacteria from those who will not?
Question 3: In the timeframe of this Research, which models could be built with satisfactory prediction performance, from a clinician standpoint, so that they would be used in clinical practice? What could be a satisfactory model for clinicians?
Question 4: In the timeframe of this Research, while testing and developing predictive models, would we be able to fully automate some predictive models and bring them to production in the day after of presenting this work? Can these models be run every day (24h/7h), in a real-life hospital production scenario, in a short time?
In Question 1 we intend to test if the latest ML algorithms, that are proving to be very successful in terms of their predictive power and generalization capabilities, can also help in predicting infected patients with HAI MDR bacteria, by using Multidimensional Datasets. These datasets will be constructed from the data electronically stored about hospitalized patients. In the search for the answer to this question, we intend to test some of
the algorithms that played a key role in getting a top 10 ranking in more than 15 Kaggle competitions (Kaggle, 2016; Conort, 2014). The datasets used will be “Big Data” datasets with more than 1000 physiological variables stored in electronic databases about each patient, measured in each inpatient day, during one year of inpatient episodes.
In Question 2 the main issue is related with the datasets used to train the models. The definition of case, i.e, Positive (Infected Patients) and Negative (Not infected Patients) is crucial here. If the models start to learn in a biased and inconsistent dataset, the chance to obtain good predictive models is lower. Therefore, this research needed to obtain representative samples of the objective it is was trying to achieve.
In Question 3 the main concern is finding if, throughout this work, it will be possible to build a “good-enough” predictive model from a clinician standpoint. This is absolutely crucial since this work intends to achieve adherence from the clinicians inside a hospital. Therefore, the metrics that assess the predictive power of each model and its robustness to generalization needed to be satisfactory for clinicians and clearly understood by them. To address this question we will not account for model interpretability. We will concentrate all the efforts in trying to find if we can build a model with good predictive performance, and leave interpretability issues for future research.
In Question 4 we hypothesized if a predictive model could be built in order to run every day (24h/7h), in a real-life hospital production scenario, by using only the available data in the electronic databases about each inpatient day. This involves developing a model taking into consideration the need to integrate it with hospital information systems and front-end tools. Besides, we also need to consider the cost of the tool to use, ease of use and learning curve necessary for the development team, and also the potential to further develop these models and benefit from the latest packages being released every day in the ML community. Moreover, there is another very important aspect when building a model to run
live in production everyday: “We need to assure that all the variables used to learn the
This means an increased effort to select the exact time of the day where the model would run and accounting for the variables that would be available for sure.
1.3
L
ITERATURER
EVIEW:
M
AINL
INESA literature review evidences that some previous work about building models for predicting HAI already exists, but most of these models are based on predicting a single microbiological agent, usually Clostridium Difficile related Infections (Wiens, 2014; Wang, 2015). Other experiences and predictive models are focused on detecting only if the patient has a HAI and the specific microbiological agent is not taken into account, thus, the records are only classified into “HAI” and “No HAI” records (Dalianis et al., 2015). Usual approaches for predicting HAI using electronic data are based on variables captured from the clinical text, body temperature data, drug lists data and microbiology reports in the EMR, but there is no evidence of a fully automated system like the one we are proposing. In the simplest data mining tasks, i.e., to classify the patient records into “HAI” and “No HAI” records, some works demonstrate that the Random Forest (RF) algorithm could obtain 87% recall and 83% precision (Ehrentraut, 2014). Other works compared the application of Naïve Bayes (NB), Support Vector Machines (SVM) and a C4.5 Decision Tree to classify the patient records into “HAI” or “No HAI”, and conclude that the results of the three classification tasks were overall similar; while SVM yielded the highest recall 91% with the best overall performance, i.e., a F2-score of 87.4% (Ehrentraut, 2012).
To be helpful in predicting HAI caused by MDR bacteria in a real clinical practice scenario, ML techniques need to be more personalized and to detect the specific type of bacteria and resistance that is causing the HAI. As most of the works that were previously done about this subject tend to focus on predicting a single type of bacteria, they usually become of limited use in real-life scenarios, where serious HAI can be caused by a variety of MDR bacteria.
This thesis intends to introduce a new approach to current practice, i.e., one that will try to build a model to help to predict if the patient will develop a hospital-acquired infection
caused by several kinds of important MDR bacteria, in the next 72 hours. We expect this solution to be more useful to physicians than current decision support algorithms in the area of HAI.
One of the most interesting aspects of the literature review in any work related to HAI is to guide us towards the correct pathway as far as feature selection is concerned. In that sense, some previous works from Wiens (2014), Guillamet and Kollef (2015), Näsman (2013) and Ehrentraut (2012) revealed the most important features that worked in their predictive models for nosocomial infection. Some of these features are shared across all the works. For instance, some of the features commonly used in these previous machine learning studies, are:
Demographics: patient age and gender;
Underlying health status: if the patient status requires hemodialysis;
Current health status: “fever” and “previous colonization by MDR microorganism”;
Invasive devices: what kind of invasive devices are used (central vein, catheter, among others);
Types of drugs administered and therapy duration: special focus on: “days with anti-parasitics”, “days with antibiotics”, “days with corticosteroids”, “days with cytotoxics”, “days with immunosuppressants”. For instance, immunosuppression significantly increases the likelihood of infection with MDR Gram-negative bacteria and Methicillin Resistant Staphylococcus Aureus (MRSA). Moreover, antibiotic history is known to increase the probability of infection.
Physical Area: type of wards where the patient was during his/her hospitalization; Miscellaneous: length of stay, transfer from another hospital, etc.
From the work of Guillamet and Kollef (2015) it becomes clear that, for instance, variables as “previous antibiotic use” appear to be the most important risk factor for MDR infection. This phenomenon is clinically explained as it creates an intricate pattern of resistance, not only by selecting resistant or mutant clones, but also by inducing unexpected defense mechanisms against different classes of antimicrobials in various species of microbes. Given its importance, this feature is a perfect example of one of the first features that will be included in the model that will be developed in this thesis.
The work of Wiens (2014) was very inspiring, in several aspects. One of them was related to an interesting variable that was created in this work, to account for the patient exposure to a disease, called “colonization pressure”. Using an objective and measurable approach, Wiens (2014) demonstrated that we could combine variables and obtain a measure that accounts for the patient exposure to an infection. This could help develop better predictive models for infection and, in that sense, we used this reasoning to include similar variables in our model, with our own approach to the problem.
All the previous features that were mentioned in previous machine learning studies are just an additional insight to approach our problem. In reality, we intend to use several other features and to apply multiple ML algorithms to identify the important features from the data and use them to create predictive classifiers.
1.4
P
LAN FOR THET
HESISHigh-Level Methodology
This thesis intends to follow the Cross-Industry Standard Process for Data Mining (CRISP-DM) methodology (CRISP-DM, 2013). We believe that this is the most correct approach to use in this thesis and, especially, to be applied in the healthcare scenario because it begins by the most fundamental phase at solving a business problem in healthcare: The Business Understanding. In that sense, as this thesis intends to help developing new approaches based on ML to predict HAI MDR bacteria, it is crucial to first get a deep understanding of
the Business Problem and, therefore, we expect to conduct a series of interviews in order to ask clinicians some very important questions, such as:
“What is a MDR bacteria?”
“How do doctors behave in their clinical practice when faced with an infected patient? What part of their actions is still empirical?”
“When do they suspect that the patient caught a HAI infection?”
“What are the signs that the patient presents when he/she has caught a HAI? What part of these signs might already be stored or could be induced from the patient’s EMR?”
This process of Business Understanding will be preceded by a literature review in the clinical area of MDR infection and antibiotics use. This previous knowledge of the Business is essential to have success in interviewing clinicians. Clinicians are usually not prepared to think from an engineering point of view and to explain their usual practice by a set of mathematical rules format, as engineers usually do. Therefore, we should lead them to explain their practice in a way that could help finding out the business rules.
One of the most fundamental challenges in this thesis is that it requires a huge time
investment in the Data preparation phase, as we relied on the assumption seen on the
literature review that “better data often beats better algorithms” (Edwin, 2011). We intend to develop a multidimensional dataset that is going to be based on several variables that will be automatically captured from the EMR, the Lab system and the Pharmacy system of a major acute Hospital (figure 1).
Figure 1: Automated Approach to obtain phenotyping information
We intend to represent each day of a patient’ admission as a high-dimensional feature
vector, composed of both variables collected once at the time of admission, and those that continue to be measured over the course of the hospitalization. Each case in the final dataset (rows) will be defined as a patient ID combined with the patient’s inpatient day (patient ID + inpatient day). With this approach it is expected to obtain a high dimensional view of the patient and increase the probability of developing a successful predictive model based on ML techniques. The dataset will be described in more detail in the following chapters of this thesis.
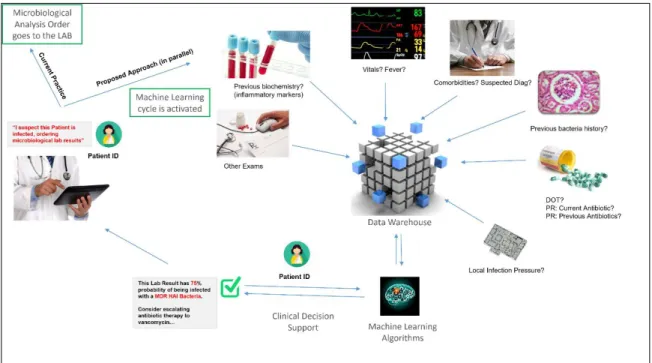
Architecture
As previously exposed in Research Question number 4, one of the main objectives of this thesis is the development of a real live working model for predicting HAI MDR bacteria in the next 72 hours. This model would be run every day (24h/7h), in a real-life hospital production scenario.
We imagine a scenario where the inpatient physician, while suspecting the patient is infected, decides to order for microbiological lab results. In a typical hospital scenario, the physician will wait for at least 3 days for these results. While requesting for microbiological lab analysis, simultaneously, an order would also be sent to our ML
Algorithm requesting an “intelligent” prediction about the results of this microbiological lab analysis being requested.
In terms of the variables needed to train this model for accurate predictions, this would involve using Big datasets coming from several hospital information systems. In our case, the raw data, coming from these information systems, is already being captured in near real-time and centralized in the hospital’s Data Warehouse. In figure 2 we try to give an overview of the architecture of this proposed system.
Figure 2: Overview of the Architecture of this Automated System
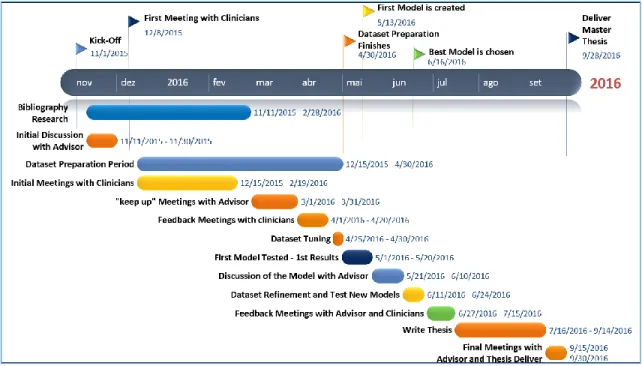
Temporal Plan
To accomplish this thesis objectives, a temporal plan was drawn, considering the huge challenges of developing an automated approach to help doctors tackle some of the most fundamental issues in a hospital’ scenario, i.e. nosocomial infection. The plan also accounts for the author’s lack of time to be fully dedicated to this thesis, as all the work is done after daily business work and during late nights and weekends. In that sense, from a planning and implementation point of view, a lot of time is intended to be dedicated to Business
Understanding. The theme of this thesis involves a very serious, critical and hard to predict problem, “nosocomial infection”, thus, the need to involve the business users (doctors mostly) and to get deep into the subject right from the begging is absolutely crucial.
The Data Extraction, Correlation and Understanding phase is also one of the tasks that will take more time from this thesis. There are a lot of data quality issues at stake, when a real time predictive model is meant to be built and used in a healthcare environment, thus emphasizing the importance of spending a lot of time in the understanding and data preparation phases. Meetings with clinicians will proceed throughout the thesis, clinically reviewing each step results, while the algorithms continue to be tested and tuned with the help of the thesis supervisor.
Figure 3: Timeline of the Thesis Plan with Milestones and Tasks to Accomplish
The final phase of this thesis will be related to the modelling procedures, trying to develop and evaluate a predictive model for HAI caused by MDR bacteria. In this phase we will try to absorb lessons learned from other healthcare prediction models originated from data competitions, clinical studies or clinical models. Also, some ML tricks from the 2011 Knowledge Discovery and Data Mining Competition (KDD, 2011) best industry papers
will be taken into account, together with blogs about machine learning containing tips that focus on the mistakes that should be avoided in the ML process. To speed up the process of developing this model, we will try to exploit some the most used R packages in data science competitions like Kaggle (Kaggle, 2016).
2. D
ATA
M
INING
P
ROBLEM
2.1
B
USINESSP
ROBLEMU
NDERSTANDINGThe prevalence of antimicrobial resistance is skyrocketing and leading to the appearance of the dangerous MDR bacteria. In a hospital’ scenario, frequent usage of antibiotics facilitates the emergence and spread of resistant strains and leads to high resistance levels; at the same time the patients are especially vulnerable, thus, the risk of being infected by a MDR bacteria is higher (Abel et al., 2014). Besides the patient’s clinical condition, which obviously influences the efficiency of his/her immune response to microorganism’s invasion, there are multiple causes that lead the patient to be at risk of getting a hospital-acquired infection.
Most of HAIs are due to a lack of hygiene from clinical staff during the several moments of contact with the patient, where hand hygiene is crucial (Figure 4). For more than 150 years, the correlation between hand hygiene improvement and healthcare-associated infection reduction has been proved and hand hygiene is widely accepted as a main component of infection prevention (Ellingson, 2014).
Figure 4: World Health Organization’s - 5 Moments for Hand Hygiene in acute care settings.
Reproduced from “Five Moments for Hand Hygiene,” World Health Organization, 2009, http://www.who.int/gpsc/tools/Five_moments/en/, accessed February 2016. All rights reserved.
Globally, 8% of hospital stays result in HAI (World Health Organization, 2005). Furthermore, it has been estimated that 70% of these are caused by single- or multiple-resistant bacteria (Livermore, 2003). Patient treatments can be tailored to the infectious agent and its resistance profile as soon as microbiological cultures are available. However, in the meantime, the physician needs to instantaneously initiate the treatment when he suspects the patient has an infection. This treatment phase is called empirical therapy (Abel et al., 2014; Leibovici et al., 1999).
Currently, in single hospitals or wards, population-wide empirical treatment of patients can be coordinated, as well as several other strategies that have been proposed to fight resistance (Abel et al., 2014). When this empirical therapy is not adequate, antibiotic resistance can occur. Besides, the use of antibiotics is not free from risks. Severe side effects have been associated with antibiotic use, thus, they should be used wisely and for short time periods (Leibovici et al., 1999).
The empirical therapy phase of a patient’s treatment is highly biased by the physician’s years of experience and, therefore, represents an opportunity to apply novel predictive models based on the existing electronic data, which might help to predict the species and resistance of a MDR bacteria before the lab results are revealed. If this model worked well, it would complement the physician’s experience and reduce the risk of choosing the wrong antibiotic for a patient. Particularly, the problem to be studied in this thesis will focus on predicting some of the most important MDR bacteria, more specifically on some of the 18 types of MDR bacteria that were outlined as the top 18 drug-resistant threats to the United States, in a report published by the Center for Disease Control and Prevention (CDC) in 2013 (CDC, 2013).
Figure 5: Centers for Disease Control and Prevention - CDC’s Antibiotic-Resistant Threats
in the United States, 2013. Reproduced from “ANTIBIOTIC RESISTANCE THREATS in the United States, 2013” Centers for Disease Control and Prevention, 2013
http://www.cdc.gov/drugresistance/pdf/ar-threats-2013-508.pdf accessed February 2016. All rights reserved.
As this thesis intends to develop a predictive model that is meant to be used in a Portuguese acute general hospital, the concept of MDR bacteria was adapted from the CDC’s report to the European’ Scenario, by using a Portuguese Clinical Norm. On February 02, 2013, a Clinical Guideline implementing the Epidemiologic Surveillance of Antibiotic Resistance (Norm Number “004/2013”, Approved on 21/02/2013) was released by the Portuguese General Health Coordination, i.e. Direção Geral de Saúde (DGS) in Portuguese (DGS, 2013). This norm is aligned with the European Commission efforts to fight Antibiotic Resistance and intends to give insights about how to classify and Report MDR bacteria events into “alert” and “concerning” types.
2.2
U
NDERSTANDING THEB
USINESSU
SERAs with any marketing activity, before choosing the problem to address, we first tried to understand the customer needs. Any innovative idea is only creating value to the extent that it (1) addresses a relevant customer problem and (2) is adopted by the customer. In that sense, before starting to collect data about the business problem, this thesis involved a preliminary work of exploring “value” from the customer perspective.
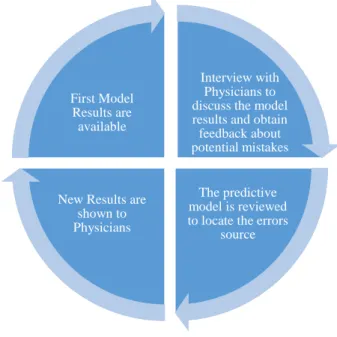
The process of exploring the customer perspective is an ongoing work that happens in several phases throughout this thesis. It begins by a Business Users Interview but, as the time goes one and some results are starting to appear, several follow up interviews are needed in order to get feedback from clinicians for the results that we are exposing. Then, after this feedback loop, the model is reviewed to account for particular errors that it might have, mostly biases that the training data can induce as the model does not have any prior knowledge of the data. This is an ongoing process that should work in loop, delivering several versions of the model to hear, from the physicians’ experience, if we are closer to a model that is useful in clinical practice. This cycle is exposed in Figure 6.
Figure 6: Feedback Loop with the collaboration of the Business Users
Interview with Physicians to discuss the model results and obtain feedback about potential mistakes
The predictive model is reviewed to locate the errors
source New Results are
shown to Physicians First Model
Results are available
2.3
B
USINESSU
SERSI
NTERVIEWWe had the privilege to arrange a meeting with some senior and experienced infectologists in order to improve his knowledge about the Business Process of treating an infected patient after an initial suspicion. In fact, clinical reasoning is complex and there is a mixture of empirical thinking and science when the physician decides to treat a patient. From the very beginning of the meeting, it was possible to obtain from the physicians a written drawing of the factors they get into account when they suspect the patient is infected (figure 7):
Figure 7: Print of Physicians Drawing while explaining of factors that Physician take into account
when presented with patients with Infection Signs
From figure 7 it is possible to understand that physicians try to narrow their choices and exclude hypothesis in a staircase way of thinking. After this process, we tried to draw a diagram of how these physicians apply their empirical thinking in clinical practice scenarios when facing patients with infection signs (figure 8).
Figure 8: Empirical Thinking Process of a Physician when facing patients with Infection Signs
From figure 8 it is possible to understand, for instance, that physicians take history of antibiotics as a very important factor for deciding how to judge the risk and treat a patient with infection signs. Also, the location of the infection seems to be a key aspect that drives all further decisions. This led us to conclude that the predictive model would have to be adjusted to the physical location of the infection, because physicians clearly treat infections differently, accordingly to the infection location.
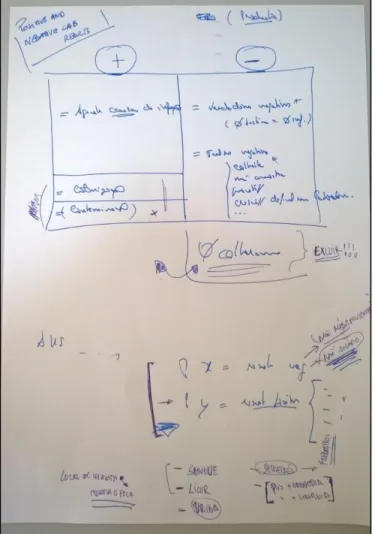
After some time spent with these infectologists, we tried to explain the objective of his research and the idea of applying algorithms to predict if the patient might become infected with a HAI MDR bacteria in advance. Immediately, the infectologists started to ask questions about how we were thinking to distinguish positive from negative cases of infected patients, i.e, the definition of “case” from a Machine Learning perspective. This was really crucial for the definition of the case in our research, because the doctors confirmed that we would make a significant mistake if we considered negative cases as “all cases without lab results or with negative lab results”. It soon became clear that, if we used this concept of “negative cases”, we would have a lot of positive examples among the
negative ones. Although less common, even when talking about patients with negative confirmed lab results, it could also happen that these cases were positive ones. This might happen due to bad collection of blood, urine or respiratory tract samples. We decided to assume this error rate and consider negative cases as those cases which had negative lab results.
Figure 9: Print of Physicians Notes while explaining what a positive (+) and negative (-) lab result
2.4
B
USINESSP
ROBLEMM
ODELLINGTo clearly separate positive instances, i.e., those patients who caught some kind of Hospital Acquired MDR bacteria from patients who were found to be negative and did not caught this bacteria, we faced several doubts during the course of this work. This implied an iterative process of refinement of the problem to be modelled, which is further detailed in Appendix 1.
In the literature, some authors suggest an approach that classifies positive cases as the ones having a culture with a HAI MDR agent; while negative cases as all other patients that had at least one negative culture (Nascimento et al., 2013).
After conducting interviews with the Business Users (Doctors) and reviewing the literature several times, we decided to adopt the following strategy to model this business problem: Positive Cases: All cases having a culture with a positive result for a HAI MDR agent in the following 72 hours from the current inpatient day (case is defined as the combination of the episode ID and the inpatient day), with respect to the biological product in which we are trying to predict (Blood, Urine or Bronchial Secretions).
Negative Cases: All cases having a HAI culture, regardless of its result, in the following 72 hours from the current inpatient day, with respect to the biological product in which we are trying to predict (Blood, Urine or Bronchial Secretions).
The concept of HAI that we choose for the purpose of this thesis was determined by using a fairly common rule for defining hospital versus community acquired infection, i.e., we will only considered positive cultures if they occur 3 days after admission to the hospital (Trick et al., 2004).
In simple terms, technically speaking, our model aims to “predict the probability of a positive result associated with HAI MDR bacteria, if the physician requests for a microbiological analysis in the following 72 hours of the current inpatient day”.
3. D
ATA
E
XTRACTION
,
C
ORRELATION AND
U
NDERSTANDING
3.1
D
ATAE
XTRACTION ANDC
ORRELATIONThe steps related to Data Gathering and Data Modelling for the Final dataset were some of the most time-consuming steps in this thesis, together with the Feature Engineering step. Gathering the data involved, correlating more than 100 relational tables, more than 5000 lines of SQL coding and modelling the Data for the final Dataset, took two working months.
The Raw Data
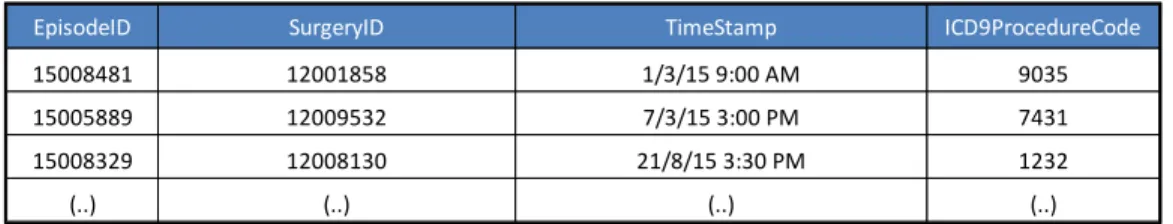
Surgical Procedures: In the EMR, procedures are encoded using ICD-92 procedure codes. Each row entry in the procedures table, records a procedure, the corresponding episode (visit) and a procedure date and time. Usually the surgical team inserts the ICD9 codes in the following hours after the surgery and, a few months after, these ICD9 code are reviewed for financial purposes. As we were trying to use only variables available at the time of prediction, we only used procedures inserted by the surgical teams. For this same reason, ICD9 “diagnosis” codes were not taken into account for our model because they are only inserted in the system months after the patient’s episode.
Table 1: Illustrative Table of how surgeries registries are stored in hospital operational
systems
2 International Classification of Diseases (9th Revision)
EpisodeID SurgeryID TimeStamp ICD9ProcedureCode
15008481 12001858 1/3/15 9:00 AM 9035
15005889 12009532 7/3/15 3:00 PM 7431
15008329 12008130 21/8/15 3:30 PM 1232
Lab results: There are several types of lab results. However, in simple terms, they can be resumed to two major types:
Biochemistry - which refers to clinical biochemistry results; Microbiology - which refers to microbiological cultures.
In this work, we used biochemistry lab results to build variables for the predictors set, while using microbiological results to build the outcome column. Each row entry in the lab results table is related to biochemistry lab results and records a lab result type, a biological location related to the biological product collected (blood, urine, bronchial secretions samples, among others), the corresponding episode (visit), the measured value and a related timestamp, as table 2 illustrates.
Table 2: Illustrative Table of how Biochemistry Lab Results are stored in hospital
operational systems
On the other hand, each microbiological lab result is characterized by several rows in a table, besides having all the fields that are registered in the biochemistry lab results scenario. These microbiological results have two additional columns: antibiotic type (e.g. vancomycin) and type of resistance of bacteria to this antibiotic type (e.g. resistant). As each bacteria needs to have its resistance behavior tested among several types of antibiotics (in order to detect MDR bacteria) there can be more than ten rows for each microbiological result. Table 3 illustrates how this data is stored in the lab systems database:
EpisodeID BiochemistryLabResultType TimeStamp LabResultValue
15008481 C Reactive Protein 1/3/15 9:00 AM 98.2
15008481 Sodium 1/3/15 9:00 AM 131.0
15008481 Haemoglobine 1/3/15 9:00 AM 11.1
15008481 White Blood Cells (WBC) 1/3/15 9:00 AM 6.8
15008481 Platelets 1/3/15 9:00 AM 340.0
15008481 C Reactive Protein 1/3/15 6:00 PM NULL
15008481 Sodium 1/3/15 6:00 PM NULL
15008481 Haemoglobine 1/3/15 6:00 PM 14.3
15008481 White Blood Cells (WBC) 1/3/15 6:00 PM 7.7
15008481 Platelets 1/3/15 6:00 PM NULL
15008481 Sodium 7/3/15 9:00 AM 138.0
15008481 Haemoglobine 7/3/15 9:00 AM 8.7
15008481 Platelets 7/3/15 9:00 AM 257.0
Table 3: Illustrative Table of how Microbiological Lab Results are stored in hospital operational
systems
Regarding Microbiological Data and the objective of this thesis (predicting Multi Drug Resistant Hospital Acquired Bacteria), it must be said that, while extracting microbiological data, a hospital algorithm was used to classify the microbiological lab result and the “drug-pathogen” interaction within two labels (YES and NO) in respect to its Multi Drug Resistant profile (illustration in table 4). The logic of this algorithm is complex and will not be further detailed as it goes beyond the main objective of this work.
Table 4: Illustrative Table of how Microbiological Lab Results are treated by a hospital
Algorithm to check if the result is MultiDrug Resistant
Vitals: Patient vitals are stored in a similarly way when compared to lab results. Each entry in the vitals table corresponds to a visit (episode ID), a timestamp, a type of observation (e.g., Heart Rate) and a value (e.g., 130bpm). Each patient usually gets its vital signs measured several times a day, depending on the severity of each clinical situation.
EpisodeID TimeStamp Type of Sample MicroorganismClass Antibiotic Type of Resistance Drug-Pathogen
15008481 1/3/15 9:00 AM BLOOD Staphylococcus aureus clindamycin Resistant 15008481 1/3/15 9:00 AM BLOOD Staphylococcus aureus daptomycin Sensitive 15008481 1/3/15 9:00 AM BLOOD Staphylococcus aureus erythromycin Sensitive 15008481 1/3/15 9:00 AM BLOOD Staphylococcus aureus gentamicin Sensitive 15008481 1/3/15 9:00 AM BLOOD Staphylococcus aureus linezolid Sensitive 15008481 1/3/15 9:00 AM BLOOD Staphylococcus aureus oxacillin Sensitive 15008481 1/3/15 9:00 AM BLOOD Staphylococcus aureus quinupristin/dalpfopristin Sensitive 15008481 1/3/15 9:00 AM BLOOD Staphylococcus aureus rifampin Resistant 15008481 1/3/15 9:00 AM BLOOD Staphylococcus aureus trimethoprim/sulfamethoxazole Sensitive 15008481 1/3/15 9:00 AM BLOOD Staphylococcus aureus vancomycin Sensitive 15008481 7/3/15 9:00 AM bronchial secretions Klebsiella pneumoniae amikacin Resistant 15008481 7/3/15 9:00 AM bronchial secretions Klebsiella pneumoniae cefepime Sensitive 15008481 7/3/15 9:00 AM bronchial secretions Klebsiella pneumoniae cefotaxime Sensitive 15008481 7/3/15 9:00 AM bronchial secretions Klebsiella pneumoniae ceftazidime Sensitive 15008481 7/3/15 9:00 AM bronchial secretions Klebsiella pneumoniae ceftriaxone Resistant 15008481 7/3/15 9:00 AM bronchial secretions Klebsiella pneumoniae ciprofloxacin Sensitive 15008481 7/3/15 9:00 AM bronchial secretions Klebsiella pneumoniae imipenem Sensitive 15008481 7/3/15 9:00 AM bronchial secretions Klebsiella pneumoniae levofloxacin Sensitive 15008481 7/3/15 9:00 AM bronchial secretions Klebsiella pneumoniae meropenem Sensitive
(..) (..) (..) (..) (..) (..)
EpisodeID TimeStamp Type of Sample MicroorganismClass MultiDrug Resistant-Pathogen 15008481 1/3/15 9:00 AM BLOOD Staphylococcus aureus YES/NO
Table 5: Illustrative Table of how Vital Signs are stored in hospital operational systems
Drugs Administered: Each patient usually has several row entries in the drugs administered table for each timestamp. This occurs because a combination of drugs is given to the patient at specific timeframes during the day. The table records the drug ID that was administered to the patient, the corresponding episode (visit) and an administered date and time.
Table 6: Illustrative Table of how Drugs administered are stored in hospital operational systems
Each database also contains a series of descriptive tables that extend the information given by each ID (DrugID, ProcedureID, VitalSignID, among others). For the sake of simplicity, we did not expose those tables in this thesis but they were combined with the original tables to capture other related interesting variables. In some cases, those additional variables were used instead of the additional variable.
EpisodeID VitalSignType TimeStamp VitalSignValue
15008481 Heart Rate 1/3/15 9:00 AM 65.0
15008481 Heart Rate 1/3/15 3:00 PM 59.0
15008481 Heart Rate 1/3/15 9:00 PM 90.0
15008481 Systolic Blood Pressure 1/3/15 9:00 AM 126.0
15008481 Systolic Blood Pressure 1/3/15 3:00 PM 118.0
15008481 Systolic Blood Pressure 1/3/15 9:00 PM 101.0
15008481 Temperature 1/3/15 9:00 AM 36.0
15008481 Temperature 1/3/15 3:00 PM NULL
15008481 Temperature 1/3/15 9:00 PM 36.0
(..) (..) (..) (..)
EpisodeID DrugID TimeStamp
15008481 A2333 1/3/15 9:00 AM 15008481 A4343 1/3/15 9:00 AM 15008481 A9775 1/3/15 9:00 AM 15008481 A3294 1/3/15 9:00 AM 15008481 A76775 2/3/15 9:00 AM 15008329 A2333 2/3/15 9:00 AM 15008329 A9775 2/3/15 9:00 AM (..) (..) (..)
Patient Demographics
The demographic data used for each patient was the typical data that can be found in a Customer Relationship Management (CRM) system, such as age, gender or address. We also added some clinical variables to each patient, related to previous visits to the hospital; for instance, if the patient was at the hospital in the previous 30 days before the current episode. These variables, that can be available at the time of prediction, are very important because they would give us an approximation to the clinical severity and comorbidities of each patient, since the day 1 of our predictions (“patients that go several times to the hospital, tend to have an increased number of comorbidities”). These variables were codified as binary variables (flags), with 1 stating the patient had the event, and 0 stating otherwise.
Table 7: Illustrative Table with Patient Demographics and additional calculated variables for each
episode
Patient visits (episodes) and Transfers among Clinical Departments
For each hospital admission we have timestamped data about the patient physical location within the hospital. Physical Locations were collected at the Department level. Table 8 shows how we can trace a patient's path through the hospital using the timestamped location data. By having this detailed information we can infer statistics about the local susceptibility to microorganisms of each department, at the time when the patient was physically allocated to that department, and we can also know when the patient was transferred to other department (for instance, an Intensive Care Unit). Each row in the Patient Transfers table reveals how long the patient stayed in each clinical department, and when he was transferred to other departments.
EpisodeID Age Sex Date of Admission
Has been in the Hospital in the past
30 days since last visit?
Has caught a MDR Bacteria, in any episode, for the past 90 days since last
visit?
Has done surgery in any
episode, for the past 90 days since last
visit?
Has done chemoteraphy in any episode, for the past 90 days, since last
visit?
Has done hemodialysis in any episode, for the past 90 days, since last
visit?
Other calculated variables about the
Episode
Has been in the Hospital in the last
30 days?
Table 8: Illustrative Table with the information contained in the EMR that allows us to follow a
patient's physical trajectory through the hospital as he/she moves from department to department Decisions & Assumptions taken while Collecting and Correlating Data
Timestamps and Data Granularity: As previously mentioned, this work involved correlating more than 100 different relational tables. These tables relate to different events and have different levels of data granularity (episode, day, period of inpatient visit and several others). Some events are registered several times a day and each table would have one line per each date and hour event (e.g. vital signs); other events occur randomly in time, for instance medications can be taken once a day, twice a day, ten times a day, once a week - it clearly depends on each clinical case. As in lab results, they also have a random behavior depending on the case complexity; they can be requested only once a week, but sometimes they might be requested several times a day. This means that each table would have different granularities in terms of the data.
In this work we hypothesized that, while joining all the tables, we had to define a timestamp in order to locate each lab result, medication taken or vital sign measured, according to each inpatient day, collecting all the tables by the episode ID key. Therefore, as the dataset would have the granularity of the inpatient day (day 1, day 2,…day n of inpatient episode), we had to choose a specific hour in each inpatient day to combine with all the tables (lab results, medications, vitals) that were at a lower level of granularity (episode ID, timestamp, measured value), as these tables could have several registries, for each patient, in each inpatient day.
The specific timestamp chosen to join all the tables was 1 minute to midnight in each day (23h:59 min). The idea was to choose a timestamp that would replicate and simulate a timestamp in which this algorithm would run when used in a real-world scenario. We
TransferID EpisodeID TimeStamp of Entrance TimeStamp of Exit Clinical Department Surgery? (yes/no) Other variables about the Clinical Department 23032 15008481 20/2/15 6:00 PM 1/3/15 9:00 AM Ortopedics 1 (..) 23033 15008481 1/3/15 9:00 AM 5/3/15 8:00 PM Internal Medicine 0 (..) 23034 15008481 5/3/15 8:00 PM 10/3/15 11:00 AM Intensive Care Unit 0 (..)