www.scielo.br/rbg
SEISMIC SIGNAL ANALYSIS USING MINIMUM PHASE AND
SINGULAR VALUE DECOMPOSITION METHODS.
APPLICATION TO GROUNDROLL ATTENUATION
Anderson Silva Santos and Milton José Porsani
ABSTRACT.A challenge in land seismic data processing is the coherent noise groundroll. This noise is related to the propagation of surface waves of the Rayleigh type, this undesired event has as characteristics: low frequencies, high amplitudes and strong dispersion, which masks the events of interest in the stacked seismic section. The seismic data from the Tacutu Basin, besides having a low signal-to-noise ratio, are also strongly contaminated by groundroll noise, which makes it a challenge to obtain stacked seismic section with high resolution of this sedimentary basin. The 1D and 2D frequency filters are widely used for groundroll attenuation, but these methods besides attenuating the noisy also eliminate part of the signal by rejecting part of the frequency band of the seismic signal. Therefore, we are introducing a new filter to groundroll attenuation that uses two powerful tools for decomposition of the seismic signal together, minimum phase decomposition and singular value decomposition. The proposed method aims to estimate the reflectivity function for each seismic trace and then perform a decomposition of this reflectivity function. Since the low frequency noise is confined in the first portion of the decomposed signal it is possible to make a separation between the noise and the signal. The filtering method was included in the 2D seismic processing flow chart of the Tacutu Basin. The results showed that the proposed method was able to attenuate the groundroll noise and generate at the end a stacked seismic section with a good resolution.
Keywords: minimum phase decomposition, singular value decomposition, groundroll attenuation.
RESUMO.Um desafio no processamento de dados sísmicos terrestres é o ruído coerente groundroll. Este ruído está relacionado à propagação de ondas de superfície do tipo Rayleigh, este evento indesejado tem como características: baixas frequências, altas amplitudes e forte dispersão, o que mascara os eventos de interesse na seção sísmica empilhada. Os dados sísmicos da Bacia do Tacutu, além de apresentar uma baixa relação sinal-ruído, também estão fortemente contaminados pelo ruído do solo, o que dificulta a obtenção de seções sísmicas empilhadas com alta resolução desta bacia sedimentar. Os filtros de frequência 1D e 2D são amplamente utilizados para a atenuação do groundroll, mas esses métodos além de atenuar o ruído também eliminam parte do sinal rejeitando parte da banda de frequência do sinal sísmico. Portanto, estamos introduzindo um novo filtro para a atenuação de groundroll que usa duas ferramentas poderosas para a decomposição do sinal sísmico, decomposição em fase mínima e decomposição em valor singular. O método proposto tem como objetivo estimar a função de refletividade para cada traço sísmico e então realizar a decomposição dessa função refletividade. Uma vez que o ruído de baixa frequência é confinado na primeira porção do sinal decomposto, é possível fazer uma separação entre o ruído e o sinal. O método de filtragem foi incluído no fluxograma de processamento sísmico 2D da Bacia do Tacutu. Os resultados mostraram que o método proposto foi capaz de atenuar o ruído groundroll e gerar ao final uma seção sísmica empilhada com boa resolução.
Palavras-chave: decomposição em fase mínima, decomposição em valores singulares, atenuação do groundroll.
Universidade Federal da Bahia, Centro de Pesquisa em Geofísica e Geologia. Instituto de Geociências, Campus Universitário da Federação Salvador, Bahia, Brazil – E-mails: [email protected], [email protected]
INTRODUCTION
The filtering of seismic reflection data aims to attenuate all undesirable events present in the seismic data. If the filtration was good the result is an increase of the signal to noise ratio, providing a good stacked seismic section. There are many methods to filtering seismic data, but several require some knowledge about the noise and signal that we want, if we apply a filter without criterion it can prejudice the events of interest. For example, frequency filters, which are widely used to attenuation of high and low frequencies noises, create an undesirable effect, when we use these methods, we need cut the frequency band where the noise is located. If we do it, we can attenuate the noise but the interest signal in that region is lost (Santos, 2014).
The coherent noise groundroll is a problem when we need processing seismic land data. This noise is caused by propagation of surface waves called Rayleigh, this noise is characterized by: low frequencies, high amplitudes, low velocity and strong dispersion, which makes it very undesirable in the seismic section. This energetic event masks the reflections and it is a problem to seismic interpreter. The seismic data from Tacutu Basin located in Brazil that we choose to test the new filter has strongly concentration of the groundroll noise, which makes it more difficult to obtain seismic sections with high resolution in this sedimentary basin (Silva, 2004).
There are a lot of methods for groundroll attenuation. The frequency filters 1D and 2D ( f − k filter) are large used to attenuate this noise, but rejecting part of the frequency band where the noise is located, part of the signal of interest also is lost (Santos, 2014). Alves (2015) used the empirical mode decomposition (EMD) and singular value decomposition to attenuate the groundroll noise. Porsani et al. (2009) used the SVD method to groundroll attenuation and Melo et al. (2009) used a 2D time domain derivative filter for groundroll attenuation. Santos (2014) used a radial directional filtering in the time domain to attenuate this noise. Porsani et al. (2013b) used the minimum-delay decomposition method to get a dynamic reflectivity estimation. Using the minimum phase decomposition we can get a reflectivity estimation and using the SVD method we can get a seismic decomposition of reflectivity function.
In order to present a filter that provide an estimate of the reflectivity function as well as a decomposition of the reflectivity function in order to filter the influence of the low frequency noise, we present the filter MPD+SVD (Minimum Phase Decomposition plus Singular Value Decomposition). First we obtain an estimation of the minimum phase wavelets in a
seismic trace, after that we obtain a SVD decomposition of the matrix that contains in its columns all the estimated wavelets in the seismic trace, finally using the convolutional model of the seismic trace and inverting the system generated by this model we can obtain a decomposition of the reflectivity function. With the propose to do this new filter more efficient we implement it using the MPI paradigm (Message Passing Interface) in FORTRAN code. We did a 2D seismic processing of a Brazilian sedimentary basin, the Tacutu Basin, using the software Seismic Unix from CWP (Center for Wave Phenomena from Colorado School of Mines).
THEORY
Minimum Phase Decomposition
The minimum phase decomposition method (MPD) is based on the Wiener-Levinson deconvolution, where for each sliding window taken in the seismic trace, it is estimated minimum phase wavelets.
Take a seismic trace dt with ns samples in time. If we
take a window of length lw we get dlw
t , where lw ≤ ns. The
auto-correlation function rd from the window lw will be given
by: rd= lw
∑
k=1 dtdt+k (1)Once the auto-correlation function has been calculated from inside the window within in the seismic trace, we get the normal equations in (2) which was used to get the Wiener-Levinson’s filter coefficients. r0 r1 · · · rn r1 r0 . .. ... .. . . .. ... r1 rn · · · r1 r0 1 g1 .. . gn = Eg,n 0 .. . 0 (2)
where g is the unitary predict filter or Wiener-Levinson’s filter and n is the number of filter coefficients. Taking into account that the auto-correlation matrix is a Toeplitz matrix, we can solve the system (2) efficiently use the Levinson’s recursion (Porsani, 1986). After we calculated the coefficients of the vector g, we can obtain the minimum phase wavelets w by inversion of the following system of equations (Porsani et al., 2013a):
glw n ∗ w lw n =δ lw n , (3)
whereδ= 1, if t= 0 0, if t6= 0
We can represent the seismic trace through the following matrix-vector notation d0 d1 . . . . . . dns = 1 0 0 0 0 w0(1) 1 0 0 0 . . . . .. . .. 0 0 w0(lw) . .. . .. 1 0 0 . .. . .. wns−1(1) 1 r0 r1 . . . . . . rns (4)
The equation above can be written as follows:
d = Wr (5)
Where d represents the seismic trace, the vector r is the reflectivity function and matrix W contains the minimum phase wavelets in their columns that were estimated within each time-sliding window in the seismic trace.
A next step is to get the singular value decomposition of the matrix W and rewrite the Equation (5) in order to explore the advantages of the seismic trace decomposition using these two powerful tools for seismic signal analysis.
Singular Value Decomposition of matrix W
The singular value decomposition (SVD) is an important theorem from algebra that was used to decompose the matrix containing the minimum phase wavelets W of ns × ns into a sum of rank unitary matrices, where ns is the number of samples of the seismic trace. The theory of SVD theorem with applications in seismic data is well grounded in Freire (1986).
The SVD decomposition of the matrix Wns×nsinto singular
values can be written in the reduced form as follows:
W = UΣVT (6)
where Σ = diag{σ1, . . . ,σns} is a matrix that contains the
singular valuesσ1≥ . . . ≥σns≥ 0 on its main diagonal.
U = [u1, . . . , uns] is an array of the eigenvectors of the
covariance matrix WWTrelated with the time dimension.
V = [v1, . . . , vns] is an array of the eigenvectors of the covariance
matrix WTW related with the space dimension.
The matrices U and V are unitary and orthogonal. Another way to write the Equation (6) is:
W = r
∑
k=1 σkukvTk = r∑
k=1 f Wk, (7)r is the matrix rankW.
According to the Equation (7), the matrix W can be seen as a sum of unitary rank matrices, weighted by their respective singular values (Freire, 1986). Each scalar product ukvTk set
a unitary rank matrix, called by Andrews & Hunt (1977) as eigenimage of W. So fWk =σkukvTk represents the k − th
eigenimage of the matrix W.
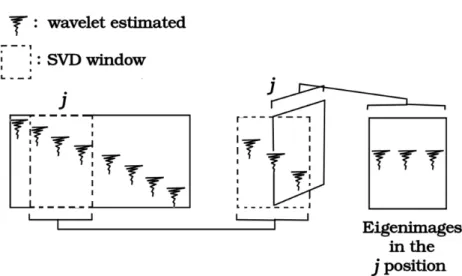
The SVD decomposition is done adaptive where for each column of the matrix W, a subset of N neighboring columns is collected, taking as reference the central column for which we wish to obtain the SVD decomposition. In this way we obtain a sliding window that travel the entire data matrix obtaining the SVD decomposition in the center of the sliding window (Fig. 1). This procedure preserves the amplitudes and highlight the continuity and coherence of reflection events (Silva, 2015). After that, the SVD decomposition of the matrix W can be represent as follows:
W = fW1+ fW2+ . . . + fWL= L
∑
i=1 f Wi (8) fWi is the i − th eigenimage of the matrix W after SVD
decomposition and L is the size of the sliding window (number of traces).
Now we can use the Equation (8) to rewrite the Equation (5) and we get: d = Wr = ( L
∑
i=1 f Wi).r (9)If we know r (by solution of Eq. (5)) and fWi we can
decompose d and we get:
d = ed1+ ed2+ . . . + edL= fW1r + fW2r + . . . + fWLr = L
∑
i=1 e di (10) This results in the following system of equations:e
d = fWr (11)
In the same way if we know ed and fW we can decompose r.
Reflectivity function estimation
The system of Equations (11) allows us to obtain an estimate of the reflectivity function for each edi. When we solve this system to
find r we find:
er = fW
−1
e
d (12)
The matrix fW that has 1 on its main diagonal is lower triangular. This property allows us to solve the system quickly and
Figure 1 – Schematic diagram illustrating the SVD window application in a set of seismic trace to get the SVD decomposition on j position. Geometry Editing MPD+SVD filter Velocity analyses NMO correction Stacked section Migrated stacked section
efficiently by back-substitution. The reflectivity function r can be represented as: r =er1+er2+ . . . +erL= L
∑
i=1 eri (13)As shown above, we can make use of these two powerful tools to decompose the seismic signal in order to obtain an estimate of the reflectivity function, a parameter of extreme importance for the seismic interpreter, since the reflectivity function is related to the behavior of the rocks in subsurface. Using the Equation (13) and knowing that the groundroll noise is located in the first eigenimage of the reflectivity function, we can attenuate it making new filtering method called MPD+SVD filter (Minimum Phase Decomposition plus Singular Value Decomposition filter).
MPD+SVD filter
We chose a sliding window containing 11 traces for the SVD decomposition of the matrix W, which means that we generated 11 eigenimages of this matrix that contain the minimum phase wavelets in their columns. We performed the filtering using two interactions (i.e. the noise of the first filter stage was the input in the next step).This methodology is interesting since it avoids the non-criterion discarding of the first decomposition where the coherent noise is located, since that in this section also have a significant part of the interest signal. At the end of the process we add up all the portions of the signal and apply an AGC (Automatic Gain Control). In the end of the interactive process we will have a filtered seismogram with the attenuation of the noise and a high preservation of the interest signal. The steps of the MPD+SVD filter algorithm can be simplified as follows:
Algorithm 1 MPD+SVD filter algorithm Input: Seismic trace d
Choose a temporal window lw
Gets de auto-correlation function Rdwithin lw (Eq. (1))
Gets the filter coefficients g solving Equation (2). Gets the minimum phase wavelet wisolving Equation (3).
Put wiin a column j of the matrix W (see Eq. (4)).
Move the window lw to one sample and do it again. Do it until fill all columns of the matrix W. SVD decomposition of the matrix W.
We get: W = fW1+ fW2+ . . . + fWL Now we have: d = fW1r + fW2r + . . . + fWLr = ∑ L i=1edi Noise → fW1r = ed1 Signal → fW2r + . . . + fWLr = ∑ L i=2fWir = ∑ L i=2edi Solve: r∗= (∑L i=2fWi)−1(∑ L i=2edi) Output: Reflectivity function filtered r∗
We write the code using the FORTRAN programming language. We parse the code using the paradigm MPI (Message Passing Interface). The MPI paralleling was done only with the
purpose of to send to each node a number of columns of the matrix that stores the seismic traces. After processing from within each node, the result was sent back to the master.
Figure 3 – Common-shot gather without filter application (a) and after MPD+SVD filter application (b).
2D seismic data processing from Tacutu Basin
The MPD+SVD filter separate the coherent noises in the first decomposition, because of that we test it in the groundroll attenuation. We use a 2D seismic data where this noise is predominant. The data is from the Tacutu Basin, an aborted Mesozoic rift located in the state of Roraima and the data about this seismic line are shown in Table 1.
Table 1 – Seismic acquisition parameters of the line 204-RL-247 from Tacutu
Basin.
Seismic acquisition parameters
Line 204-RL-247 Spread 1050-100-0-100-3850 t(s) 4 ∆t(ms) 4 GC(%) 4800 ∆s(m) 50 ∆g(m) 50 Nc 96
We processed this 2D seismic data using the seismic processing package Seismic Unix (SU) with free distribution by CWP (Colorado School of Mines), shell scripts and a FORTRAN code was used to apply the filter MPD+SVD. We applied the processing flowchart described in Figure 2. First we converted the seismic data to SU format and then we done the seismic data geometry. After the mute and the edition of the seismic traces we applied the filter MPD+SVD. We performed the velocity analysis and then obtained the velocity field that was used to do the normal moveout correction and the migration of the seismic data. We applied the MPD+SVD filter with two interactions to groundroll attenuation in this paper.
RESULTS
In Figure 3(a) we can see the effect of groundroll noise on a common-shot gather. The groundroll appears in seismic record as a cone of high amplitudes and low frequencies, it masks the reflections and decreases the signal to noise ratio in the seismic section. The Figure 3(b) shows the same common-shot gather after MPD+SVD filter application. We can see that the MPD+SVD filter was efficient in attenuate the groundroll and reveal the reflections events that was masked by the noise. The continuity
Figure 4 – Amplitude spectrum: common-shot gather without filter application (black) and after MPD+SVD filter application (red).
Figure 5 – Semblance panel: supergather original without filter application (a) and its semblance panel (b), supergather after MPD+SVD filter application (c) and its
semblance panel (d).
of the events between 1.5 seconds and 2.0 seconds shows that this filter is very powerful to groundroll attenuation.
The Figure 4 shows the amplitude spectrum of the original data and the filtered data. If we observe the amplitude spectrum of the original common-shot gather, we notice the presence of the goundroll in the range of 5 Hz to 12 Hz characterized by high amplitudes in this low frequency zone (black curve), the amplitude spectrum of the filtered data after MPD+SVD filter (red curve) shows an attenuation in this band where the noise was located. The reflection events are much more highlighted after
AGC gain in comparison with a zone where was the low frequency noise. The method was efficient in attenuating the groundroll and preserving the interest events.
Furthermore we examined the effect of this filter in the velocity analysis step. For this we assembled a supergather from original data without filter application and a supergather after MPD+SVD filter application and we obtained the velocity spectrum (Fig. 5). Again, the presence of the noise in the form of a cone of low frequencies and high amplitudes is noted in Figure 5(a) and in Figure 5(b) its velocity spectrum.
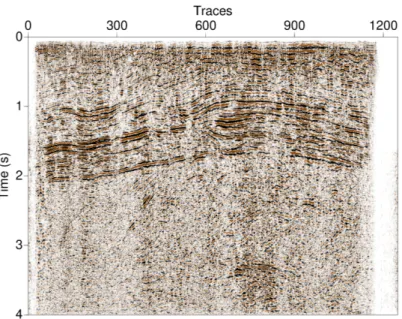
Figure 6 – Stacked seismic section without filter application.
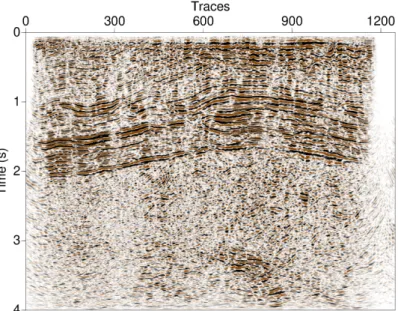
Figure 7 – Stacked seismic section after MPD+SVD filter application.
In Figure 5(c) there is a supergather that was built using CMPs after MPD+SVD filtering and in Figure 5(d) its velocity spectrum. We note that after filtering using the MPD+SVD filter there is an increase in the signal to noise ratio.
The Figure 6 is composed by original stacked seismic section. We note how the coherent noise groundroll makes
it difficult to see seismic reflections and their interpretation in the stacked seismic section. In the Figure 7 there is the stacked section after MPD+SVD filtering. We note the significant attenuation of the noise and a highlight of the reflectors, since without the influence of the noise the reflection events are much more evident. The Figure 8 shows the stacked section after the
Figure 8 – Stacked seismic section after MPD+SVD filter and phase-shift migration.
migration in time using phase-shift method. It is possible to notice an increase in lateral resolution in the stacked seismic section.
CONCLUSION
The minimum phase decomposition method in conjunction with singular value decomposition proved to be a efficient tool for seismic signal analysis. The filtering using the MPD+SVD filter was effective in attenuating the coherent noise groundroll in addition to highlighting the events of interest in the stacked seismic section. The method was also effective in the attenuation of the undesired event without making large cuts in the frequency band of the signal, improved to stage of velocity analysis by increasing the signal to noise ratio in the seismogram and the result was a stacked seismic section with a good resolution.
ACKNOWLEDGEMENTS
This research was supported by FAPESB and INCT-GP/CNPq. The facility support from CPGG/UFBA is also acknowledged.
REFERENCES
ALVES FM. 2015. Aplicação do método de decomposição em modos empíricos e da filtragem SVD na atenuação de ruídos em dados sísmicos de reflexão. Master dissertation. Universidade Federal da
Bahia, Salvador, Brazil. Available on: <http://www.pggeofisica.ufba.br/ media/uploads/publicacoes/310.pdf>. 69 pp.
ANDREWS HC & HUNT BR. 1977. Digital image restoration. Englewood Cliffs. Prentice-Hall. 238 pp.
FREIRE SLM. 1986. Aplicações do método de decomposição em valores singulares no processamento de dados sísmicos. Ph.D. thesis. Universidade Federal da Bahia, Salvador, Bahia, Brazil. 182 pp. MELO P, PORSANI M & SILVA M. 2009. Ground-roll attenuation using a 2D time-derivative filter. Geophysical Prospecting, 57(3): 343–353. PORSANI M, SILVA M, MELO P & URSIN B. 2009. Ground-roll attenuation based on SVD filtering. In: SEG Expanded Abstracts. Houston, Texas, United States of America. Volume 28(3381), 5 pp. PORSANI MJ. 1986. Desenvolvimento de algorítmos tipo-Levinson para o processamento de dados sísmicos. PhD thesis, Universidade Federal da Bahia, Salvador, Brazil, 240 pp.
PORSANI MJ, SILVA MGS & URSIN B. 2013a. Dynamic estimation of reflectivity by minimum-delay seismic trace decomposition. Geophysics, 78(3): 109–117.
PORSANI MJ, URSIN B, SILVA MGS & MELO PEM. 2013b. Dip-adaptive singular-value decomposition filtering for seismic reflection enhancement. Geophysical Prospecting, 61(1): 42–52. SANTOS AS. 2014. Atenuação do groundroll utilizando a filtragem direcional radial. Graduation course work, Universidade Federal da
Bahia, Salvador, Brazil. Available on: <http://www.cpgg.ufba.br/gr-geof/ geo213/trabalhos-graducao/Anderson-Santos.pdf>. 45 pp.
SILVA M. 2015. Empilhamento automático ao longo do mergulho local e novos métodos para processamento de dados sísmicos no domínio
do tempo. Ph.D. thesis. Universidade Federal da Bahia, Salvador, Bahia, Brazil. 111 pp.
SILVA MG. 2004. Processamento de Dados Sísmicos da Bacia do Tacutu. Master dissertation. Universidade Federal da Bahia, Salvador, Bahia, Brazil. 126 pp.
Recebido em 15 junho, 2018 / Aceito em 26 junho, 2019 Received on June 15, 2018 / Accepted on June 26, 2019