Printed version ISSN 0001-3765 / Online version ISSN 1678-2690 http://dx.doi.org/10.1590/0001-3765201720160906
www.scielo.br/aabc | www.fb.com/aabcjournal
Agronomic viability of New Zealand spinach and kale intercropping
ARTHUR B. CECÍLIO FILHO1
, MATHEUS S. BIANCO, CAROLINE F. TARDIVO and GABRIEL C.M. PUGINA
Universidade Estadual Paulista ‘Júlio de Mesquita Filho’, Faculdade de Ciências Agrárias e Veterinárias, Departamento de Produção Vegetal, Câmpus Jaboticabal, Via de acesso Prof. Paulo Donato Castellane, s/n, 14884-900 Jaboticabal, SP, Brazil
Manuscript received on December 23, 2016; accepted for publication on February 13, 2017
ABSTRACT
The intercropping is a production system that aims to provide increased yield with less environmental
impact, due to greater efficiency in the use of natural resources and inputs involved in the production
process. An experiment was carried out to evaluate the agronomic viability of kale and New Zealand spinach intercropping as a function of the spinach transplanting time. (0, 14, 28, 42, 56, 70, 84 and 98 days after transplanting of the kale). The total yield (TY) and yield per harvest (YH) of the kale in
intercropping did not differ from those obtained in monoculture. The spinach TY was influenced by the transplanting time, the earlier the transplanting, the higher the TY. The spinach YH was not influenced by
the transplanting time, but rather by the cultivation system. In intercropping, the spinach YH was 13.5%
lower than in monoculture. The intercropping was agronomically feasible, since the land use efficiency index, which was not influenced by the transplanting time, had an average value of 1.71, indicating that the
intercropping produced 71% more kale and spinach than the same area in monoculture. Competitiveness
coefficient, aggressiveness and yield loss values showed that kale is the dominating species and spinach is
the dominated.
Key words: Tetragonia expansa, Brassica oleracea var. acephala, cultivation system, land use efficiency, competition index.
Correspondence to: Arthur Bernardes Cecílio Filho E-mail: [email protected]
INTRODUCTION
In the last decades, many researches have shown that intercropping of vegetables can be more
efficient in the land and input use than monoculture
(Bezerra Neto et al. 2003, Cecílio Filho et al. 2003, 2010, 2011, 2013, Rezende et al. 2003, 2011), characteristics that make it a more environmentally-friendly production system.
However, the intercropping efficiency depends
directly on the species involved and the management
factors (Cecílio Filho et al. 2011, Bezerra Neto et al. 2012). Among them, and in a special way, is the
planting time of the second species, which defines
the beginning of the coexistence and, therefore, of the intercropping (Cecílio Filho et al. 2003, 2010, 2011).
complementarity when the greatest demands of
the crops for resources occur at different times,
and spatial complementarity when canopies or
roots capture resources in different areas (Liebman
2002). Therefore, reducing the competition between the intercropping species for resources in the environment is the great challenge in order to make it economically interesting to the vegetable producer.
No reports have been found about the intercropping of New Zealand spinach and kale,
which are plants that show different growth habits
and harvest periods. Notwithstanding, there are many researches that studied the transplanting
times of the second crop in relation to the first one,
and found great influence on the agroeconomic feasibility of the intercropping. Among these works, tomato and lettuce (Cecílio Filho et al. 2011, 2013), cucumber and lettuce (Rezende et al. 2010, 2011) and broccoli and lettuce (Oshe et al. 2012) are highlighted, as they are examples of crops of quite contrasting size, as is the case of kale and New Zealand spinach. When evaluating tomato and lettuce intercroppings established as a function of the transplanting time of lettuce in relation to tomato, at two planting times (January to June and April to September), Cecílio Filho et al. (2010, 2011) found that lettuce, regardless of the time it
was transplanted, did not affect tomato yield and
quality. Nonetheless, the reverse occurred for the lettuce, so that the later the lettuce transplanting, the lower its yield. Similar results have been observed by Rezende et al. (2010, 2011) and Oshe et al. (2012). In these cases, the later transplanting of the lettuce established a coexistence period with tomato, cucumber and broccoli plants in a late way, when these were more developed and causing greater shading to the lettuce, impairing photosynthesis and mass accumulation.
The New Zealand spinach, Tetragonia expansa, belonging to the family Aizoaceae, is an herbaceous plant, with indeterminate, prostrate growth, being
able to reach about 0.25 m in height. The leaves, smooth or rough, are dark green, rosette-like, with elongated and pointed limb (Filgueira 2008). In Brazil, there is a single cultivar called ‘Nova Zelândia’. The harvesting of leaves and stems begins about 40 to 60 days after transplanting of the seedlings, with monthly frequency. The form
of consumption is diversified, since besides its use
in natura, it is also an ingredient of omelettes and salt cakes.
For being a species better adapted to higher temperatures than the spinach Spinacea oleracea, of the family Chenopodiaceae (Nonnecke 1989), the ‘New Zealand’ spinach is replacing this other species in some parts of the world, such as Brazil.
This is important because it offers a new choice of
nutrient-rich leafy vegetable. The spinach ‘Nova Zelândia’ has, in 100 grams of raw plant, very few calories (14-16 kcal), 2 g of protein, 2.1 g of dietary
fiber, 220 retinol equivalents (vitamin A), 2.4-30 mg
of vitamin C, 0.1 mg of niacin, 15 μg of folic acid, 25-28 mg of phosphorus, 130-336 mg of potassium, 58-98 mg of calcium, 82 mg of magnesium, 0.4-0.8 mg of iron, 0.3 mg of zinc (Gebhardt et al. 2006, TBCA 2011). Cambie and Fergunson (2003) cite antiulcerogenic and anti-inflammatory effects attributed to cerebrosides and polysaccharides present in this species. Pieniz et al. (2009), in an in vitro study to evaluate the antioxidant potential of fruits and vegetables, observed that spinach had the
highest antioxidant effect compared to kale, onion,
carrot, cabbage and tomato.
Kale, Brassica oleracea L. var. acephala,
like cigars, in which the kale leaves replace the vine leaves (Trani et al. 2015). In Brazil, the consumption of this vegetable is increasing. Compared to other leafy vegetables, kale stands out for its higher
content of proteins, carbohydrates, fibers, calcium,
iron, vitamin A, niacin and vitamin C, in addition to being an excellent source of carotenoids (Lorenz and Maynard 1988, Lefsrud et al. 2007). According to TBCA (2011), in 100 g of raw kale leaves, there are 27 kcal, 2.9 g of protein, 4.3 g of carbohydrate,
3.1 g of dietary fiber, besides 403 mg of potassium,
131 mg of calcium, 55 mg of magnesium, 49 mg of phosphorus, 0.5 mg of iron and 96.7 mg of vitamin C.
In view of the above, the objective was to evaluate the agronomic viability of the intercropping of kale and spinach as a function of the spinach planting time and the interaction between them.
MATERIALS AND METHODS
LOCATION AND CHARACTERIZATION OF THE EXPERIMENTAL AREA
The experiment was conducted under field
conditions, at Unesp - Jaboticabal Campus,
São Paulo state, Brazil, located at 21º15’22” S, 48º15’58” W and with an altitude of 575 meters.
During the experimental period (5/23 to 12/16/2014), the average, maximum and minimum temperatures were 23.1 ºC, 30.8 ºC and 17.3 ºC, respectively, and 461.7 mm of rainfall, occurring predominantly (72%) in November and December.
The soil of the area, according to the
classification of Embrapa (2006), is typical Red
Latosol of very clayey texture, with a smoothly wavy to wavy relief.
EXPERIMENTAL DESIGN AND TREATMENTS
Seventeen treatments were evaluated in a randomized complete block design with four replications. The treatments (Table I) resulted from the combination of the factors: cultivation systems
(intercropping and monoculture) and transplanting times of the New Zealand spinach (0, 14, 28, 42, 56, 70, 84 and 98 days after transplanting (DAT) of the kale).
According to Table I, treatments 1 to 8 refer to the intercropping of kale with spinach, in the
different times of transplanting and intercropping
establishment; treatment 9 corresponded to the kale monoculture, and treatments 10 to 17 refer to the spinach monocultures in the same periods of establishment of the intercroppings, in order to
isolate a possible effect of the factor planting time.
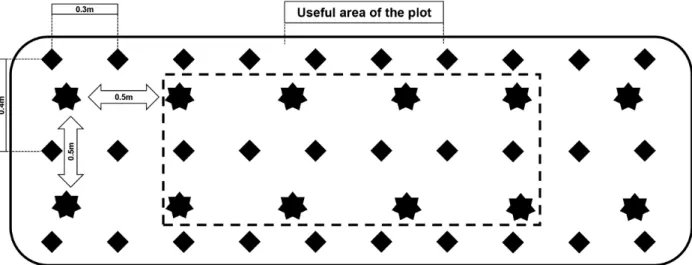
The experimental units, with 3 m2 of total area, were composed of 12 kale plants (kale monoculture), 30 spinach plants (spinach monoculture) and the sum of the two populations in the intercroppings (Figure 1).
The useful area of the experimental unit for data collection comprised the central plants of each cultivation row, eliminating a kale plant from each
TABLE I
Characterization of treatments of ‘New Zealand’ spinach and kale in monoculture and intercropping system.
Treatments Kale Spinach (DAT1 )
01 – Intercropping Present 0 02 – Intercropping Present 14 03 – Intercropping Present 28 04 – Intercropping Present 42 05 – Intercropping Present 56 06 – Intercropping Present 70 07 – Intercropping Present 84 08 – Intercropping Present 98 09 – Monoculture Present Absent
10 – Monoculture Absent 0
11 – Monoculture Absent 14
12 – Monoculture Absent 28
13 – Monoculture Absent 42
14 – Monoculture Absent 56
15 – Monoculture Absent 70
16 – Monoculture Absent 84
17 – Monoculture Absent 98
1
end of the line. For the evaluation of spinach, the center row of the plot was considered as its useful area, excluding two spinach plants at each end (Figure 1).
EXPERIMENT INSTALLATION AND CONDUCTION
The soil of the experimental area was sampled in the 0-20 cm layer and, according to the chemical analysis, showed 17 g dm-3 of organic matter, pH 5.4, 37 g dm-3 of P, 3.4; 27; 8; 29 mmolc dm-3 of K, Ca, Mg and H + Al, respectively, 67 mmolc dm-3 of
cation exchange capacity and 60% base saturation. Liming was performed by applying limestone, 90 days before planting, using plowing and harrowing for the incorporation, in order to increase soil’s base saturation to 80%.
The experiment was installed on May 23, 2014, with the transplanting of kale and spinach according to the treatments. When the spinach was transplanted at 0, 14, 28, 42, 56, 70, 84 and 98 DAT of the kale, the heights of kale plants were 5.0, 11.8, 20.4, 38.0, 53.0, 7.0, 63.6, 71.8 and 85.6 cm, respectively.
According to the soil analysis, on May 23, planting fertilization was carried out. For both monoculture and intercropping systems, 40, 320
and 80 kg ha-1 of nitrogen (urea), phosphorus
(simple superphosphate) and potassium (potassium chloride) were applied, respectively. As there is no
fertilization recommendation for the intercropping of kale and spinach and neither for spinach cultivation, the recommendation of Trani and
Tavares (1997) for kale monoculture was used. In the cover fertilization, 40 kg ha-1 of N (ammonium
sulphate) and 20 kg ha-1 of K
2O (potassium
chloride) were applied to kale and spinach, every 15 DAT of the crops until 45 DAT, and later in both crops, shortly after the spinach harvest.
The cultivars used in the experiment were ‘Top Bunch’ for kale and ‘Nova Zelândia’ for New Zealand spinach.
Kale and spinach seedlings were grown in 200-cell trays. The spinach seedlings were sown on several dates, aiming to have seedlings with six
leaves for transplantings at the times established in the treatments. In the center of the plot, two kale rows were transplanted, spaced 0.50 m between
rows and 0.50 m between plants and three spinach rows were distributed between kale rows, spaced 0.40 m between rows and 0.30 m between plants
(Figure 1). The experimental units of the kale
and spinach monocultures presented the same population distribution.
The irrigation of the experiment was carried out periodically by spraying. Weed control was done by means of manual weeding, carried out biweekly, and phytosanitary control was performed according to the need of the crop, mainly for the
control of aphids (Aphis gossypii) and Brazilian leaf beetles (Diabrotica speciosa).
As of July 1, 2014, the harvests of kale began, and were carried out every 15 days, totaling 13 harvests. The harvests of spinach were made when the soil was completely covered, with the first harvest being performed on July 16, 2014. For the
treatments with spinach transplanting at 0 and 14 DAT of the kale, three harvests were made; for the treatments with transplanting at 28 and 42 DAT, two harvests were performed; and for the remaining treatments, only one harvest was performed due to the closure of the experiment on December 16, 2014.
CHARACTERISTICS EVALUATED
Yield per harvest and total yield (kg ha-1): total yield was obtained by the sum of the harvests made during the whole cycle of the crops, taking into account the yield obtained in the useful area of the plot and transformed to hectare.
Land use efficiency (LUE): for the calculation of this index, the formula proposed by Willey (1979) was used:
LUE = (Yks / Yk) + (Ysk / Ys)
where: Yks = is the yield of the crop “k” (kale) in intercropping with “s” (spinach)
Ysk = is the yield of the crop “s” in intercropping with “k”
Yk = is the yield of the crop “k” in monoculture
Ys = is the yield of the crop “s” in monoculture
For the calculation of the LUE indices, the total yields of kale and ‘New Zealand’ spinach were used.
Competitiveness Coefficient (CC): the competitive relationship was obtained from the formula suggested by Willey and Rao (1980):
CC = CCk + CCs
CCk being calculated by the formula:
CCk = [(LUEk/LUEs) x Zsk/Zks)]
and CCs calculated by the formula:
CCs = [(LUEs/LUEk) x Zks/Zsk)]
where CCk and CCs are the partial indices
calculated for kale and spinach, and Zks is the
ratio of kale:spinach plants and Zsk is the ratio of
spinach:kale plants in intercropping. LUEk and
LUEs are the partial indices of land use efficiency calculated for kale and spinach, respectively.
This is the assessment of competition between crops. It provides a better measure of the competitive capacity of the crops in intercropping. Thus, CC provides the exact degree of competition, indicating the number of times the dominant species is more competitive than the dominated species (Eskandri and Ghanbari 2010, Egbe et al. 2010). The CC shows which crop makes the best use of environmental resources in the intercropping system.
Agressiveness (A): aggressiveness is an index that indicates how much one crop in a intercropping system was superior in yield to another. The index was proposed by Mcgilchrist and Trenbath (1971) to measure the dominance of one crop over the other and was calculated by the formulas:
Ak = (Yks/Yk·Zks) - (Ysk/Ys·Zsk)
where Yks is the yield of kale in intercropping with spinach, Ysk is the yield of spinach in intercropping with kale, and Yk and Ys are the yields of kale and spinach, in monoculture, respectively; Zks and Zsk were described in the CC index.
When the value of A equals zero, both crops compete equally within the intercropping. When the value of A is nonzero, the crop with positive signal is dominant and that with negative signal is dominated.
Actual Yield Loss (AYL): this index was proposed by Banik and Bagchi (1996) and was calculated by the formula:
AYL = AYLk + AYLs
AYLk being calculated by the formula:
AYLk = {[(Yks/Zks)/(Yk/Zk)] – 1}
and the AYLs value calculated by the formula:
AYLs = {[(Ysk/Zsk)/(Ys/Zs)] – 1}
the components of the formulas have been described in the formulas for CC and AYL calculations. The positive and negative values of AYL indicate advantage or disadvantage of the intercropping, that is, it provides a quantitative evaluation of the accumulated advantage and disadvantage in any intercropping system when the main objective is to compare the yield per species present in the intercropping system (Dhima et al. 2007, Yilmaz et al. 2008). The magnitude of the individual AYL for
each crop present in the intercropping reflects the
nature of the competition between the two crops. In obtaining the indices of each plot, homogeneous standardization was used for monoculture, considering the average of all monocultures on the blocks in the index denominator, according to Bezerra Neto and Robichaux (1996) and Federer (2002). This
standardization was used to avoid difficulties with
the possibility of having a complex distribution of
the sum of the quotients, which define the LUE
index and other indices, and thus, of the analysis of variance not having representativity, leading to errors related to the validity of the assumptions of normality, homogeneity and additivity. It was also used to allow the validation of the estimated models, statistically comparing the performance of these indices as a fuction of the transplanting time of New Zealand spinach in relation to kale.
STATISTICAL ANALYSIS
The data on yield per harvest and total yield of kale and spinach were submitted to analysis of
variance (F test), and when significant, the means
of the monoculture and intercropping systems were compared by the Tukey test at 5%. For kale yield, a randomized complete block design was used, with 9 treatments (8 intercroppings and 1 monoculture) and four replications. For the data on spinach yield, a randomized complete block design was used in a 2 x 8 factorial scheme, being two cultivation systems and eight transplanting times. For the
indices of land use efficiency and competitiveness
of the species, a randomized complete block design was used, with 8 treatments (intercroppings).
RESULTS AND DISCUSSION
The yield per harvest and total yield of the kale were
not influenced by the cultivation system. Therefore,
the yields obtained in the presence of spinach did
not differ from those obtained when the kale was in
monoculture, regardless of the transplanting time. The total productivity average in intercropping was 67.09 t ha-1 while in monoculture the kale yielded 68.06 t ha-1.
plants did not suffer reduction in the interception
of incident solar radiation when in intercropping with spinach, when compared to monoculture. The light is, according to Portes et al. (1996), the main resource of the environment in competition for the intercropping species. Notwithstanding, it can also be stated that spinach did not compete with kale for other resources of the environment, such as water and nutrients.
The absence of impairment to the growth and yield of the larger crop (kale) in an intercropping system corroborates the results observed for tomato with lettuce (Cecílio Filho et al. 2010, 2011, 2013), cucumber with lettuce (Rezende et al. 2010, 2011) and broccoli with lettuce (Oshe et al. 2012). These
authors verified that, similar to that observed for
kale and spinach, the lettuce, because of its low
size and slow growth, did not affect the growth and
yield of tomato, cucumber and broccoli, regardless of the transplanting time, since it remained below the photosynthetic canopy of these plants and does not cause shading.
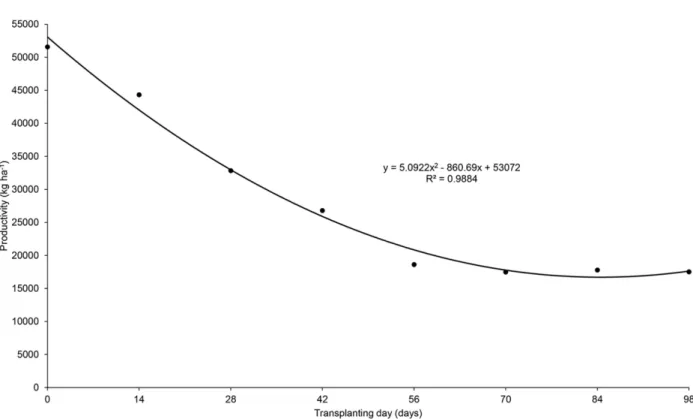
For the total yield of New Zealand spinach, there was a significant effect of the factors cultivation systems and transplanting times,
showing no significant interaction.
The highest spinach yield occurred when the transplanting was done on the same day as kale, 53,072 kg ha-1. The later the transplanting, the
greater was the decrease in yield. Among spinach transplantings performed on the same day and at 56 DAT of the kale, the reduction in yield is similar to the linear decrease, reaching a yield loss of 67%. In subsequent transplantings up to 98 DAT of the kale, yields were similar and remained approximately 18,240 kg ha-1 (Figure 2).
The decreasing adjustment obtained for the total yield is due to the number of harvests performed in the treatments. In treatments 0 and 14, 28 and 42, and from 56 to 98 DAT of the kale, three, two and one harvest were performed, respectively.
The yield per harvest of spinach in intercropping with kale, contrary to what was observed for total
yield, was not significantly influenced by the time
it was transplanted. The average yield per harvest was 16,694 kg ha-1. This result differs from those observed by Cecílio Filho et al. (2010, 2011, 2013) between lettuce and tomato, Rezende et al. (2010, 2011) between lettuce and cucumber, Oshe et al. (2012) between lettuce and broccoli. These authors
verified that the lettuce yield was influenced by the
time of establishment of the intercropping, and that the later it occurred, that is, the later the lettuce transplanting in relation to that of the associated crop, the greater the decrease in lettuce yield.
The average yield per harvest of the spinach in monoculture was 19,296 kg ha-1, being, in all transplanting times evaluated, always higher than the yield of the spinach in intercropping. On average, the yield in intercropping was 13.5% lower than in monoculture. This lower yield in intercropping can be attributed to the competition among the species by light, since the kale plants had their leaves always above the spinach plants causing shading and decreased yield. According to Sinoquet and Caldwell (1995), the higher species
benefit in an intercropping from having leaves in
a stratum higher than their competitor, where the light intensities are superior, without suffering interference from the coexisting species.
However, unlike what was observed in intercroppings of tomato and lettuce, by Cecílio Filho et al. (2010, 2011, 2013), and in intercroppings of cucumber and lettuce, by Rezende et al. (2010, 2011), the delay in the New
Zealand spinach transplanting did not affect yield
the transplantings performed from 20 days after transplanting of the tomato, and from 10 days after transplanting of the cucumber, due to their large size, the lettuce plants showed to be small, etiolated and commercially decharacterized, when compared to the lettuce transplantings. Such fact was not observed for New Zealand spinach, with commercial yields being obtained at all transplanting times. Sinoquet and Caldwell (1995) and Ricklefs (2003)
report that when the interspecific competition for
light is intense, the dominant crop can cause serious damage to the dominated one and can be lethal to it. In the present study, the shading that the kale provided to the spinach, although causing yield damage, was not intense enough to cause greater physiological damage, which can be attributed to
the difference between the architectures, anatomy
and morphology of kale, tomato and cucumber leaves.
Also, the small reduction observed in the yield of the New Zealand spinach in intercropping
in relation to monoculture and the absence of reduction in yield as the spinach was later transplanted can be attributed to the fact that kale leaves were harvested periodically. These were
harvested biweekly, and about five small leaves
remained in the plant, which grew until being harvested. Thus, the shading of kale to spinach occurred for a short time, unlike the intercroppings of lettuce with tomato and cucumber, where the shoots of these plants increased continuously until remaining constant and with intense shading to the lettuce crop.
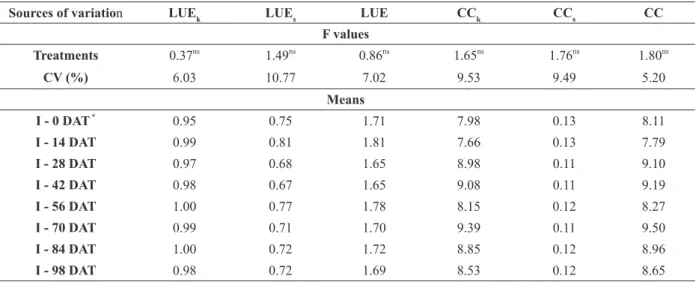
For the land use efficiency of the kale (LUEk),
New Zealand spinach (LUEs) and intercropping
(LUE), no significant effects of treatments were
observed (Table II).
The LUEs indices were always lower than
1, which evidenced the dominance of kale on spinach, and showed a yield loss in relation to the monoculture. The kale plants shaded the spinach plants, reducing the light incidence, which
negatively affected photosynthesis, impairing the
accumulation of biomass by plants (Caron et al. 2014).
The LUEk indices, regardless of the spinach
transplanting time, when they were not 1, were very close to 1 (Table II), with an average value of 0.98, indicating that the kale yield in intercropping is similar to that in monoculture.
The average LUE of the intercropping was
1.71, a high value, which reflected great spatial
and temporal complementarity of the intercropping species, with very low competition for the resources of the environment. According to the index, one hectare of intercropping of kale and spinach yields the same amount of vegetables as 1.71 hectares of their crops when in monoculture, that is, 0.855 ha of
spinach and 0.855 ha of kale. The lack of effect of the transplanting time differed from that observed
by Cecílio Filho et al. (2010, 2011, 2013), Rezende et al. (2010, 2011) and Oshe et al. (2012), who evaluated intercroppings of lettuce with tomato, cucumber and broccoli, and observed that the LUE index decreased as the lettuce transplanting was more delayed in relation to that of the associated
crop. Nevertheless, the absence of influence of the
spinach transplanting time on the LUE index is
justified by the absence of a significant effect on
the yields per harvest of kale and spinach.
There were no significant effects of the transplanting time on the competitiveness
coefficient of kale (CCk) and New Zealand spinach (CCs) and the CC (Table III), with mean values of 8.58, 0.12 and 8.70, respectively. The higher values of CCk in relation to CCs indicate that kale plants, regardless of the transplanting time, had a better use of natural resources, being more competitive in the system in relation to spinach plants.
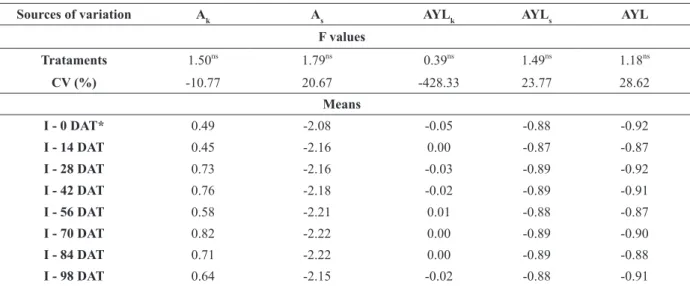
The aggressiveness index of kale (Ak) and
New Zealand spinach (As) evidenced the kale
domain in the system in all the times in which the intercropping was established, with a positive
mean value of 0.65, and there was no significant effect of the index for both crops (Table III). For As, negative values were obtained at all times, showing that the spinach plants were dominated throughout the intercropping, with an average value of -2.17.
The larger the value of A, the greater the difference
between actual and expected yields.
TABLE II
Summary of variance analysis (F values, coefficients of variation and averages) for the indices: efficiency in the use of kale
(LUEk), New Zealand spinach (LUEs) and intercropping (LUE), competitiveness coefficient (CC), of kale (CCk) and New Zealand spinach (CCs) in function of the culture system.
Sources of variation LUEk LUEs LUE CCk CCs CC
F values Treatments 0.37ns
1.49ns
0.86ns
1.65ns
1.76ns
1.80ns
CV (%) 6.03 10.77 7.02 9.53 9.49 5.20
Means
I - 0 DAT * 0.95 0.75 1.71 7.98 0.13 8.11
I - 14 DAT 0.99 0.81 1.81 7.66 0.13 7.79
I - 28 DAT 0.97 0.68 1.65 8.98 0.11 9.10
I - 42 DAT 0.98 0.67 1.65 9.08 0.11 9.19
I - 56 DAT 1.00 0.77 1.78 8.15 0.12 8.27
I - 70 DAT 0.99 0.71 1.70 9.39 0.11 9.50
I - 84 DAT 1.00 0.72 1.72 8.85 0.12 8.96
I - 98 DAT 0.98 0.72 1.69 8.53 0.12 8.65
The values of the actual yield loss of kale (AYLk) were close to zero, showing no significant
difference in relation to the spinach transplanting
times, as well as the actual yield loss of New Zealand
spinach (AYLs) and of the intercropping (AYL)
(Table III). The mean value obtained for AYLk
was -0.01, indicating that the kale did not suffer significant losses in its yield in the intercropping
system, while for AYLs, the values were also
negative, but with a greater magnitude, showing a mean value of -0.88, which characterizes yield loss determined by kale, contributing to the fact that AYL values were also very negative, whose average was -0.90.
According to the indices previously discussed, it can be concluded that the kale exerted dominance in the intercropping in relation to spinach, taking better advantage of the resources of the environment for its development. This fact explains why kale plants had similar yields in intercropping and in monoculture. The New Zealand spinach plants
were influenced directly by the kale due to their
undetermined, creeping growth habit in relation to
the growth of kale, which has vertical growth habit, causing the partial shading of spinach, leading to a decrease in its yield.
CONCLUSIONS
The New Zealand spinach, regardless of the time of its transplanting in relation to that of kale, does
not affect kale yield. On the other hand, kale causes
yield loss to the New Zealand spinach, regardless of the spinach transplanting time, by about 13.5% in relation to the yield obtained in monoculture. Competitiveness Coefficient, Aggressiveness and Yield Loss indices show that, when grown in the same area, regardless of the time when the spinach is transplanted, kale is the dominating species and spinach is the dominated. About the cultivation system, the intercropping of kale and New Zealand spinach is agronomically feasible,
as it provides high land use efficiency, regardless
of the transplanting time of the ‘New Zealand’ spinach, yielding, in 1 hectare, an amount of kale and spinach corresponding to 1.71 hectare of the monocultures.
TABLE III
Summary of the variance analysis (F values, coefficients of variation and means) for kale aggressiveness (Ak), New Zealand spinach aggressiveness (As), kale actual yield loss (AYLk), New Zealand spinach actual yield loss (AYLs), actual
yield loss of intercropping (AYL) as function of the time of transplanting of the New Zealand spinach in relation to the kale.
Sources of variation Ak As AYLk AYLs AYL
F values Trataments 1.50ns
1.79ns
0.39ns
1.49ns
1.18ns
CV (%) -10.77 20.67 -428.33 23.77 28.62
Means
I - 0 DAT* 0.49 -2.08 -0.05 -0.88 -0.92
I - 14 DAT 0.45 -2.16 0.00 -0.87 -0.87
I - 28 DAT 0.73 -2.16 -0.03 -0.89 -0.92
I - 42 DAT 0.76 -2.18 -0.02 -0.89 -0.91
I - 56 DAT 0.58 -2.21 0.01 -0.88 -0.87
I - 70 DAT 0.82 -2.22 0.00 -0.89 -0.90
I - 84 DAT 0.71 -2.22 0.00 -0.89 -0.88
I - 98 DAT 0.64 -2.15 -0.02 -0.88 -0.91
ACKNOWLEDGMENTS
The present work was carried out with the support of
Conselho Nacional de Desenvolvimento Científico
e tecnológico (CNPq), n. 304688/2013-4.
REFERENCES
BANIK P AND BAGCHI DK. 1996. A proposed index for assessment of row-replacement series intercropping system. J Agron Crop Sci 177: 161-164.
BEZERRA NETO F, ANDRADE FV, NEGREIROS MZ AND SANTOS JÚNIOR JJ. 2003. Desempenho agroeconômico do consórcio cenoura × alface lisa em dois sistemas de cultivo em faixas. Hortic Bras 21: 637-643.
BEZERRA NETO F, PORTO VCN, GOMES EG, CECÍLIO FILHO AB AND MOREIRA JN. 2012. Assessment of agroeconomic indices in polycultures of lettuce, rocket and carrot through uni- and multivariate approaches in semi-arid Brazil. Eco Indic 14: 11-17.
BEZERRA NETO F AND ROBICHAUX RH. 1996. Spatial arrangement and density effects on an annual cotton/ cowpea/maize intercrop. I. Agronomic efficiency. Pesq Agrop Bras 31: 729-741.
CAMBIE RC AND FERGUSON LR. 2003. Potential functional foods in the tradicional Maori diet. Mutat Res Fundam Mol Mech Mutagen 523-524: 109-117.
CARON BO, SCHMIDT D, MANFRON PA, BEHLING A, ELOY E AND BUSANELLO C. 2014. Eficiência do uso da radiação solar por plantas Ilex paraguariensis A. St. Hil. cultivadas sob sombreamento e a pleno sol. Cienc Flor 24: 257-265.
CECÍLIO FILHO AB, BEZERRA NETO F, REZENDE BLA, GRANGEIRO LC AND LIMA JSS. 2013. Indices of competition and bio-agroeconomic efficiency of lettuce and tomato intercrops in greenhouses. Aust J Crop Sci 7: 809-819.
CECÍLIO FILHO AB, REZENDE BLA, BARBOSA JC AND GRANGEIRO LC. 2011. Agronomic efficiency of intercropping tomato and lettuce. An Acad Bras Cienc 83: 1109-1119.
CECÍLIO FILHO AB, REZENDE BLA AND COSTA CC. 2010. Economic analysis of the intercropping of lettuce and tomato in different seasons under protected cultivation. Hortic Bras 28: 326-336.
CECÍLIO FILHO AB, TAVEIRA MCGS AND GRANGEIRO LC. 2003. Productivity of beet and roquette cultivation as a function of time of establishing intercropping. Ac Hortic 607: 91-95.
DHIMA KV, LITHOURGIDIS AS, VASILAKOGLOU IB AND DORDAS CA. 2007. Competition indices of common vetch and cereal intercrops in two seeding ratio. Field Crop Res100: 249-256.
EGBE OM, ALIBO SE AND NWUEZE I. 2010. Evaluation of some extra-early- and early-maturing cowpea varieties for intercropping with maize in southern Guinea Savanna of Nigeria. Agric. and Biol. J North America 1: 845-858. EMBRAPA. 2006. Centro Nacional de Pesquisa de Solos.
Sistema brasileiro de classificação de solos. 2ª ed., Rio de Janeiro, 306 p.
ESKANDARI H AND GHANBARI A. 2010. Environmental resource consumption in wheat (Triticum aestivum) and bean (Vicia faba) intercropping: Comparison of nutrient uptake and light interception. Not Sci Bio 2: 100-103. FEDERER WT. 2002. Statistical issues in intercropping. In:
El-Shaarawi AH et al. Encyclopedia of environmetrics. 1st
ed., New York: Wiley, New York, USA, p.1064-1069. FILGUEIRA FAR. 2008. Novo manual de olericultura.
Agrotecnologia moderna na produção e comercialização de hortaliças. 2ª ed., Viçosa, Universidade Federal de Viçosa, 412 p.
GEBHARDT SE ET AL. 2006. Usda national nutrient database for standard reference, release 19. <Home Page www.ars. usda.gov/nutrientdata>.
LEFSRUD M, KOPSELL D, WENZEL A AND SHEEHAN J. 2007. Chances in kale (Brassica oleracea L. var. acephala) carotenoid and chlorophyll pigment concentrations during leaf ontogeny. Sci Hortic 112: 136-141.
LIEBMAN M. 2002. Sistemas de policultivos. In: Altieri M. Agroecologia: bases científicas para uma agricultura sustentável. Guaíba: Agropecuária, p. 347-368.
LORENZ OA AND MAYNARD DN. 1988. Handbook for vegetable growers. 3rd
ed., New York: John Wiley-Interscience Publication, 456 p.
MCGILCHRIST CA AND TRENBATH BRA. 1971. Revised analysis of plant competition experiments. Biom 27: 659-671.
NONNECKE IL. 1989. Vegetable Production. 1st
ed., New York: Springer, p. 476-483.
OSHE S, REZENDE BAL, SILVEIRA LS, OTTO RF AND CORTEZ MG. 2012. Viabilidade agronômica de consórcio de brócolis e alface estabelecidos em diferentes épocas.
Ide 30: 29-37.
PIENIZ S, COLPO E, OLIVEIRA VR, ESTEFANEL V AND ANDREAZZA R. 2009. Avaliação in vitro do potencial antioxidante de frutas e hortaliças. Cien Agrotec 33: 552-559. PORTES TA. 1996. Produção de feijão nos sistemas
consorciados.Goiânia, Embrapa, 50 p.
REZENDE BLA, CANATO GHD AND CECÍLIO FILHO AB. 2003. Productivity of lettuce and radish cultivations as a function of spacing and of time of establishment of intercropping cultivation. Acta Hortic 607: 97-101. REZENDE BLA, CECÍLIO FILHO AB, BARROS JÚNIOR
under greenhouse in the winter-spring. An Acad Bras Cienc 83: 705-717.
REZENDE BLA, CECÍLIO FILHO AB, PORTO DRQ, BARROS JUNIOR AP, SILVA GS, BARBOSA JC AND FELTRIM LF. 2010. Consórcios de alface crespa e pepino em função da população do pepino e época de cultivo. Interc 35: 374-379.
RICKLEFS ER. 2003. A economia da natureza. 5ª ed., Guanabara Koogan, Rio de Janeiro, 503 p.
SINOQUET H AND CALDWELL RM. 1995. Estimation of light capture and partitioning in intercropping systems. In: Sinoquet H and Cruz P. Ecophysiology of tropical intercropping. Paris, INRA, p. 79-98.
TBCA - TABELA BRASILEIRA DE COMPOSIÇÃO DE ALIMENTOS. 2011. NEPA, UNICAMP: Campinas, 4ª ed., Campinas: NEPA- UNICAMP, p. 30-31.
TRANI PE AND TAVARES M. 1997. Couve-manteiga e mostarda. In: Raij BV et al. Recomendações de Adubação e Calagem para o Estado de São Paulo. Campinas, IAC, 179 p. TRANI PE, TIVELLI SW, BLAT S, PRELA-PANTANO A,
TEIXEIRA EP, ARAÚJO HS, FELTRAM JC, PASSOS FA, FIGUEIREDO GJB AND NOVO MCSS. 2015. Couve de folhas: do plantio à colheita. Campinas: Instituo Agronômico, 36 p.
WILLEY RW. 1979. Intercropping – its importance and research needs. Part 1 - Competition and yield advantage. Field Cro Abs 32: 1-10.
WILLEY RW AND RAO MRA. 1980. Competitive ratio for quantifying competition between intercrops. Exper Agric 16: 117-125.