http://www.uem.br/acta ISSN printed: 1679-9275 ISSN on-line: 1807-8621
Acta Scientiarum
Doi: 10.4025/actasciagron.v36i2.16180
Grain yield and baking quality of wheat under different sowing dates
Raphael Rossi Silva1, Giovani Benin2*, Juliano Luiz de Almeida3,Inês Cristina de Batista Fonseca1 and Claudemir Zucareli1
¹Departamento de Agronomia, Centro de Ciências Agrárias, Universidade Estadual de Londrina, Londrina, Paraná, Brazil. ²Departamento de Agronomia, Universidade Tecnológica Federal do Paraná, Rodovia PR-469, km 1, 85503-390, Pato Branco, Paraná, Brazil. ³Fundação Agrária de Pesquisa Agropecuária, Guarapuava, Paraná, Brazil. *Author for correspondence. E-mail: [email protected]
ABSTRACT. Choosing the right sowing dates can maximize the outcomes of the interaction between genotype and environment, thus increasing grain yield and baking quality of wheat (Triticum aestivum L.). The present study aimed at determining the most appropriate sowing dates that maximize grain yield and baking quality of wheat cultivars. Seven wheat cultivars (BRS 179, BRS Guamirim, BRS Guabiju, BRS Umbu, Safira, CD 105 and CD 115) were evaluated at four sowing dates (the 1st and the 15th of June and July) in two harvesting seasons (2007 and 2008). The study was setup in a completely randomized block design with four repetitions. The effects of the year and sowing date when combined explained 93% of the grain yield variance. In 2007, the CD 105 and Safira cultivars had the highest grain yield (GY) for all sowing dates. Only the BRS Guabiju and Safira cultivars possessed high baking quality for all sowing dates assessed. In 2008, the environmental conditions were favorable for superior GY, but the baking quality was inferior. Considering adapted cultivars and sowing dates, it is possible to maximize grain yield and baking quality of wheat.
Keywords: GGE biplot, baking quality, gluten strength, alveograph.
Produtividade de grãos e qualidade industrial de trigo em diferentes épocas de semeadura
RESUMO. A escolha de épocas de semeadura adequadas pode maximizar o aproveitamento da interação genótipo x ambiente e incrementar a produtividade de grãos e a qualidade industrial de trigo (Triticum aestivum L.). Objetivou-se com o estudo identificar épocas de semeadura adequadas que maximizam a produtividade de grãos e a qualidade industrial de cultivares de trigo. Sete cultivares de trigo (BRS 179, BRS Guamirim, BRS Guabiju, BRS Umbu, Safira, CD 105 e CD 115) foram avaliadas em quatro épocas de semeadura (01 e 15 de junho, 01 e 15 de julho) durante duas safras agrícolas (2007 e 2008). Utilizou-se delineamento em blocos ao acaso com quatro repetições. Somados, os efeitos de ano e épocas de semeadura explicaram 93% da variância para produtividade de grãos. Em 2007, as cultivares CD 105 e Safira apresentaram a maior produtividade de grãos (GY) em todas as épocas de semeadura. Apenas as cultivares BRS Guabiju e Safira apresentaram elevada qualidade de panificação em qualquer época de semeadura avaliada. Em 2008, as condições ambientais foram favoráveis ao aumento da GY, contudo de menor qualidade industrial. É possível maximizar a GY e a qualidade industrial do trigo com a escolha de cultivares adaptadas e épocas de semeadura mais adequadas.
Palavras-chave: GGE biplot, qualidade industrial, força de glúten, alveografia.
Introduction
Wheat (Triticum aestivum L.) is an important and extensively used cereal in human and animal diets worldwide. In Brazil, a significant amount of wheat is imported not only because this country produces only half of its internal consumption but also because the wheat produced has inferior baking quality in some regions of Brazil. Increases in grain yield (GY) and baking quality are crucial for wheat crop competitiveness. Such increases may be accessible based upon the selection of adapted cultivars and adequate management practices.
In wheat, GY and baking quality are dependent on the environment, genetic factors and the interaction between them (YAN; HOLLAND, 2010;
COVENTRY et al., 2011). An adequate sowing date positively impacts the GY (SILVA et al., 2011) and baking quality of wheat, causing better adjustment to the physiology, phenology and environmental conditions (WHEELER et al., 1996; RIBEIRO et al., 2009). In addition, the appropriate sowing date also affects the water, temperature and solar radiation available for the crop.
wheat (JIANG et al., 2009). Each sowing date determines the baking quality pattern of the wheat (TRIBOI; TRIBOI-BLONDEL, 2002; MOTZO et al., 2007). However, it is difficult to obtain high GY and baking quality due to a negative association between these characteristics (BLANCO et al., 2011).
Thus, the present study aimed at determining the most appropriate sowing dates that maximize grain yield and baking quality of wheat cultivars for the wheat cropping region of central south of the state of Paraná.
Material and methods
The experiment was performed in the municipality of Guarapuava (25º33’S and 51º30’W; altitude of 1,095 m) in the State of Paraná, Brazil. According to the Köppen climate classification system, the predominant climate type in this area is Cfb, which represents a humid subtropical climate with a temperate summer (MAACK, 1968). The experimental site, which is located at the Value of Culture and Use Region 1 (VCU 1), is a region of interest because of the increased yield potential and the occurrence of severe frost.
The experiment was setup in a completely randomized block design with four repetitions in a factorial scheme. The following three bread wheat cultivars were evaluated: BRS Guamirim (early cycle), BRS Guabiju (mid-cycle) and Safira (mid-cycle). The following four soft wheat cultivars were evaluated: CD 105 (early cycle), CD 115 (mid-cycle), BRS 179 (mid-cycle) and BRS Umbu (late cycle). The cultivars were planted on the 1st and 15th of June (E1 and E2)
and on the 1st and 15th of July (E3 and E4) during
the 2007 and 2008 harvesting seasons. These cultivars were chosen because they are the most representative of that region.
In Brazil, wheat cultivars are classified according to the Normative Instruction No. 7 of the Ministry of Agriculture, Livestock and Food Supply (BRASIL, 2001). The different classes vary according to the alveogramW and falling number (FN) with five classes currently known as follows: soft wheat (W > 50 and FN > 200); bread wheat (W > 180 and FN > 200); improver wheat (W > 300 and FN > 250); wheat for different end uses (W = any and FN < 200); and durum wheat (W = not defined and FN > 250).
The useful area of each plot consisted of six rows (5 m in length with 0.17 m spacing) with a total area
of 5.1 m². Initially, a basal amount of 300 kg ha-1 of
NPK 08-30-20 was applied. At the early stages of
tilling, 40 kg ha-1 of N in the form of urea was
applied for fertilization. GY was estimated (kg ha-1)
after harvesting the useful area of each plot, and it was corrected to 13% moisture. A thousand kernel weight (TKW) measured in grams (g) was obtained after sampling 250 grains in duplicate. The test weight (TW), which corresponds to the mass of 100 liters of grains (kg hL-1), was determined using a
Dalle Molle hectoliter weight balance. The genotypes were characterized using the percentage of pre-harvest sprouting (PHS) with 100 grains randomly collected in each plot. After this, the germinated (rupture of pericarp) and non-germinated grains were counted.
For the analysis of baking quality, individual samples of each treatment were mixed and homogenized resulting in a composite sample. The FN was determined in duplicate using a falling number device from Perten Instruments following method 56-81B of the American Association of Cereal Chemists (AACC, 2000). This test was applied to measure the intensity of the enzymatic activity of the α-amylase enzyme in the grain with the result given in seconds. Low enzymatic activity is associated with elevated values of FN.
The alveogram test (method 54-30A of the AACC, 2000) was performed using a Chopin alveograph. This test refers to the capacity of water absorption by the proteins that comprise gluten and to the capacity to retain carbon dioxide resulting in a quality bread product. Using a manometer, different pressures were recorded, and the alveograph curve was obtained wherein the length, height and a circumscribed area of the curve represent the extensibility (L), tenacity (P) and W-index (W), respectively.
The analysis of joint variance was conducted considering the year effect as random, and the genotype and sowing date were considered as fixed effects. For comparison of mean values, the R computer program was used, and the Scott-Knott test was applied (5%).
it is null if the angle is about 90º (YAN; TINKER, 2006). The singular value is entirely partitioned into the entry eigenvectors. Singular value partitioning 1 (SVP 1) is needed for accurate comparison among the entries, while SVP 2 is needed for accurate visualization of the relationship among the testers (YAN et al., 2000).
Results and discussion
The analysis of variance (ANOVA) showed that the effect of the year (Y), sowing date (D), CxY interaction (cultivar x year) and CxYxD (cultivar x year x sowing date) interaction significantly affected the GY (Table 1). The coefficient of variation was 5.2%, which represented good precision of the experiment. The majority of the variation was due to changes in the environment (year = 87% and sowing date = 6%). These results indicated that proportionally, there was a greater variability in the response between years when compared to the sowing dates and cultivars, which can be explained by irregular precipitation, solar radiation and temperature between years and sowing dates; and the frost effects at booting (Figure 1). According to Jalata (2011), there is a greater effect of the environment as compared to the cultivar in such experiments.
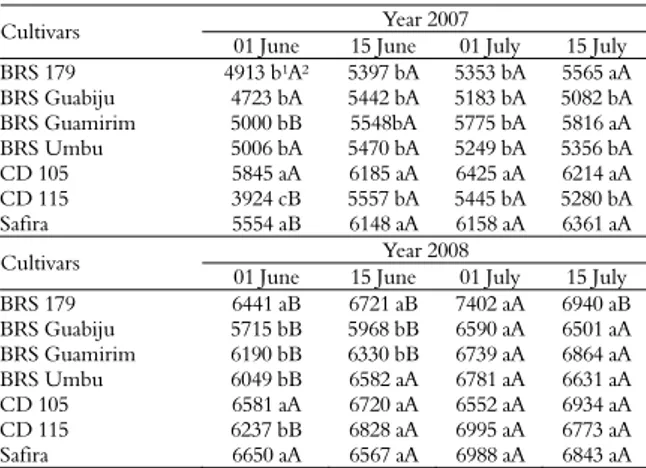
Table 1. Mean of grain yield (kg ha-1) of wheat cultivars with
different sowing dates and comparison of the effect of sowing date and cultivars in Guarapuava - Paraná State.
Year 2007 Cultivars
01 June 15 June 01 July 15 July
BRS 179 4913 b¹A² 5397 bA 5353 bA 5565 aA
BRS Guabiju 4723 bA 5442 bA 5183 bA 5082 bA
BRS Guamirim 5000 bB 5548bA 5775 bA 5816 aA
BRS Umbu 5006 bA 5470 bA 5249 bA 5356 bA
CD 105 5845 aA 6185 aA 6425 aA 6214 aA
CD 115 3924 cB 5557 bA 5445 bA 5280 bA
Safira 5554 aB 6148 aA 6158 aA 6361 aA
Year 2008 Cultivars
01 June 15 June 01 July 15 July
BRS 179 6441 aB 6721 aB 7402 aA 6940 aB
BRS Guabiju 5715 bB 5968 bB 6590 aA 6501 aA
BRS Guamirim 6190 bB 6330 bB 6739 aA 6864 aA
BRS Umbu 6049 bB 6582 aA 6781 aA 6631 aA
CD 105 6581 aA 6720 aA 6552 aA 6934 aA
CD 115 6237 bB 6828 aA 6995 aA 6773 aA
Safira 6650 aA 6567 aA 6988 aA 6843 aA
¹,²compare means between cultivars and between sowing dates, respectively. Médias
seguidas de mesma letra não diferem entre si pelo teste de Scott Knott a 5%. Means followed by same letter do not differ by testing Scott Knott (p < 0.05).
In 2007, the CD 105 and Safira cultivars showed the highest GY in all sowing dates and did not differ from the BRS Guamirim and BRS 179 cultivars in E4 (Table 2). Regarding sowing dates, the CD 115, BRS Guamirim and Safira cultivars showed an inferior GY in E1. In this context, it is important to note that experimental site has a greater occurrence
of lower temperatures during anthesis for early sowing dates (GONÇALVES et al., 1998).
Figure 1. Climate data of rainfall (A), solar radiation (B) and maximum and minimum temperature (C) in Guarapuava-Paraná State for 2007 and 2008 during wheat growth with different sowing dates.
Table 2. Mean of grain yield (kg ha-1) of wheat cultivars with
different sowing dates in Guarapuava-Paraná State.
01 June 15 June 01 July 15 July
Cultivars
2007 2008 2007 2008 2007 2008 2007 2008
BRS 179 4913 B¹ 6441 A 5397 B 6721 A 5353 B 7402 A 5565 B 6940 A
BRS Guabiju 4723 B 5715 A 5442 A 5968 A 5183 B 6590 A 5082 B 6501 A
BRS Guamirim 5000 B 6190 A 5548 B 6330 A 5775 B 6739 A 5816 B 6864 A
BRS Umbu 5006 B 6049 A 5470 B 6582 A 5249 B 6781 A 5356 B 6631 A
CD 105 5845 B 6581 A 6185 A 6720 A 6425 A 6552 A 6214 B 6934 A
CD 115 3924 B 6237 A 5557 B 6828 A 5445 B 6995 A 5280 B 6773 A
Safira 5554 B 6650 A 6148 A 6567 A 6158 B 6988 A 6361 A 6843 A
¹,²compare mean between cultivars and between sowing dates, respectively. Means
followed by same letter do not differ by Scott Knott test (p < 0.05).
There was a more favorable GY for all the sowing dates in 2008 than in 2007 (Table 3), which may be a result of a better distribution of precipitation, specifically during the early stages of plant development (Figure 1A). Moreover, the maximum and minimum temperatures in 2007 were superior to those observed in 2008 (Figure 1B). Elevated temperatures accelerate the development of the grain filling stage (GAJU et al., 2009), thereby resulting in a reduced deposition of carbohydrates, accumulation of starch in the grains and GY (TRIBOI; TRIBOI-BLONDEL, 2002; LABUSCHAGNE et al., 2009).
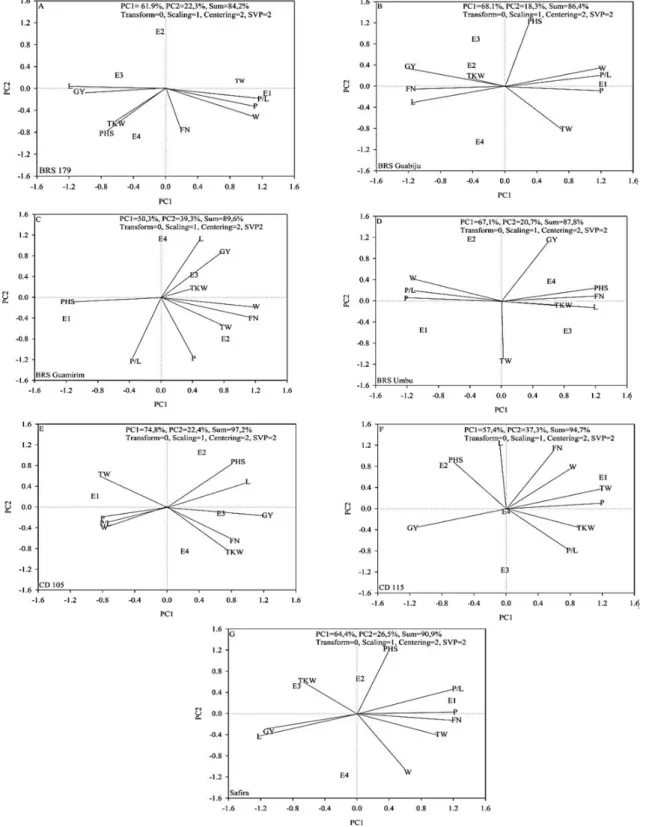
Table 3. Baking quality of wheat cultivars with different sowing dates in Guarapuava-Paraná State in 2007.
Cultivar ST TW TKW PHS FN W P L P/L
E1 83 38 0.1 335 175 85 65 1.31
E2 83 37 0.1 325 138 69 69 1
E3 80 41 0.2 309 141 71 70 1.01
BRS 179
E4 82 41 0.3 356 151 73 70 1.04
E1 84 36 0.1 325 479 119 116 1.03 E2 83 36 0.1 352 424 98 136 0.72 E3 82 39 0.1 352 435 98 125 0.78 BRS Guabiju
E4 84 38 0 354 426 100 132 0.76 E1 82 39 2.3 320 273 108 83 1.3
E2 85 41 0 452 348 120 93 1.29
E3 84 39 0 392 321 103 108 0.95 BRS
Guamirim
E4 81 41 0.8 349 299 98 108 0.91 E1 83 34 0.1 300 247 54 154 0.35 E2 81 35 0.3 304 246 51 160 0.32 E3 83 36 0.5 310 200 45 174 0.26 BRS Umbu
E4 82 34 0.6 313 195 44 165 0.27 E1 83 44 0.3 301 216 71 110 0.65 E2 80 44 0.4 310 140 44 128 0.34 E3 78 45 0.4 317 148 47 126 0.37 CD 105
E4 78 45 0.3 323 171 55 118 0.47 E1 83 39 0.1 325 205 70 122 0.57
E2 81 35 0.5 313 171 54 136 0.4
E3 81 38 0 296 163 60 98 0.61
CD 115
E4 82 39 0.3 314 167 59 114 0.52 E1 85 36 0.1 384 342 130 66 1.97 E2 83 36 0.1 368 296 100 73 1.37 E3 83 38 0.1 350 299 79 106 0.75 Safira
E4 84 36 0 364 353 94 105 0.9
The following abbreviations are used: ST, sowing time; TW, test weight (kg hL -1); TKW, thousand kernel weight (g); PHS, pre-harvest sprouting (%); FN,
falling number; W, W-index (10-4 J); P, tenacity; L, extensibility (mm); and P/L,
tenacity/extensibility ratio.
The different sowing dates affected the performance of the studied parameters. The TW varied between 78 and 85 kg hL-1 in 2007 (Table 4)
and between 75 and 82 kg hL-1 in 2008 (Table 4).
The evaluated cultivars showed different reduction levels of TW as a result of the sowing date effect where the greatest reduction (7%) was observed for the BRS Umbu cultivar. Bordes et al. (2008) also observed different genotype behavior due to environmental variations. In both years, there was a negative association of TW with PHS and TKW (Figures 2 and 3). Moreover, there was an elevated consumption of the grain reserve and elevated respiration with increased PHS and decreased TKW, TW and GY (GUARIENTI et al., 2003), which resulted in reduced baking quality.
Table 4. Baking quality of wheat cultivars with different sowing dates in Guarapuava-Paraná State in 2008.
Cultivar ST TW TKW PHS FN W P L P/L
E1 81 42 0.5 255 128 57 79 0.72
E2 80 39 0.4 242 104 48 91 0.53
E3 79 36 0.5 274 89 40 110 0.36
BRS 179
E4 80 36 0 292 139 68 78 0.87
E1 82 38 0.4 290 363 103 102 1.01 E2 82 38 0.2 254 375 90 132 0.68 E3 82 37 0.6 279 245 54 181 0.3 BRS Guabiju
E4 82 35 0.1 313 319 72 162 0.44
E1 79 43 1.2 272 214 85 88 0.97
E2 78 42 2.7 218 149 64 92 0.7
E3 79 41 7.6 243 168 61 121 0.5 BRS Guamirim
E4 82 38 0.1 297 206 73 111 0.66 E1 81 35 0.6 209 173 42 165 0.25 E2 82 35 0.4 246 113 36 144 0.25 E3 82 34 0.2 286 135 35 186 0.19 BRS Umbu
E4 76 32 0.3 283 146 34 179 0.19 E1 75 47 0.9 287 75 41 77 0.53 E2 75 44 2.4 209 78 38 89 0.43
E3 76 43 1.8 268 75 31 122 0.25
CD 105
E4 80 40 0 301 114 38 135 0.28
E1 78 38 0.3 232 103 46 98 0.47
E2 79 37 0.7 210 80 32 132 0.24
E3 79 37 0.6 248 88 35 147 0.24
CD 115
E4 80 34 0 285 110 43 120 0.36
E1 79 36 0.7 316 223 89 66 1.35
E2 79 35 0.4 273 221 71 92 0.77
E3 79 33 0.2 295 180 47 137 0.34 Safira
E4 80 30 0 334 217 59 109 0.54
The following abbreviations are used: ST, sowing time; TW, test weight (kg hL-1); TKW,
thousand kernel weight (g); PHS, pre-harvest sprouting (%); FN, falling number; W, W-index(10-4 J); P, tenacity; L, extensibility (mm); and P/L, tenacity/extensibility ratio.
In 2007, the TKW was superior in sowing dates that maximized the GY (Figure 2; Tables 2 and 4), which indicated a positive association between GY and TKW, except for the CD 115 cultivar (Figure 2). In contrast, TKW was negatively associated with GY in 2008 (Figure 3). The importance of TKW during the formation of GY has been reported in modern cultivars (BORDES et al., 2008).
This result corroborated the study by Scheuer et al. (2011), which reported that high W can result in lower L. However, the BRS Umbu cultivar had a high level
of L in all sowing dates (Figures 2 and 3). A high level of L is associated with a low production of flour (MÓDENES et al., 2009).
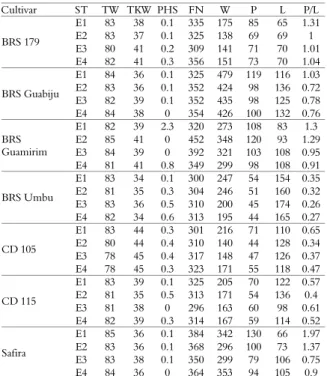
Figure 2. Productivity and baking quality performance of wheat cultivars (A, BRS 179; B, BRS Guabiju; C, BRS Guamirim; D, BRS Umbu; E, CD 105; F, CD 115; and G, Safira) with different sowing dates in 2007 following the GGE biplot methodology. The following abbreviations are used: ST, sowing time; TW, test weight (kg hL-1); TKW, thousand kernel weight (g); PHS,
pre-harvest sprouting (%); FN, falling number; W, strength-index (10-4 J); P, tenacity; L, extensibility (mm); and P/L,
Figure 3. Productivity and baking quality performance of wheat cultivars (A, BRS 179; B, BRS Guabiju; C, BRS Guamirim; D, BRS Umbu; E, CD 105; F, CD 115; and G, Safira) with different sowing dates in 2008 following the GGE biplot methodology. The following abbreviations are used: ST, sowing time; TW, test weight (kg hL-1
); TKW, thousand kernel weight (g); PHS, pre-harvest sprouting (%); FN, falling number; W, W-index (10-4 J); P, tenacity; L, extensibility (mm); and P/L, tenacity/extensibility ratio.
There was a negative association between W and GY for the majority of the cultivars (Figures 2 and 3), except for the CD 115 (Figure 2F) and CD 105 (Figure 3E) cultivars. Sowing dates subsequent to June specifically promoted GY and reduced W (Figures 2A, 2C, 2F and 3B). Likewise, an elevated W is associated with greater accumulated amounts of proteins (PINNOW et al., 2013), which demands an elevated consumption of carbohydrates. An increased content of proteins causes a decreased accumulation of starch and, consequently, a reduction in GY (RHARRABTI et al., 2001; SCHMIDT et al., 2009).
There was an increase in W during sowing dates in which the period of grain filling occurred simultaneously to the increase in mean, minimum and maximum temperatures (Figures 1B, 1C and 1D; Tables 4 and 5). Moreover, a low magnitude of W was observed in E1 and E2 for the BRS 179, CD 105 and CD 115 cultivars (Figures 3A, 3E and 3F). In the same way, Moldestad et al. (2011) reported that elevated temperatures between the silking and grain filling stage
resulted in increased W. However, a temperature increase during this phase leads to a reduction of TKW and GY (RHARRABTI et al., 2003; LABUSCHAGNE et al., 2009; HURKMAN; WOOD, 2011) and promotes a negative association between W and GY. A lower W in E1 and E2 can be attributed to greater precipitation during the grain filling stage (GARRIDO-LESTACHE et al., 2005) and a higher PHS (Figures 2 and 3).
mainly on the genetic factor (GELIN et al., 2006). The BRS Guamirim cultivar showed the highest PHS among all tested cultivars in both years (Tables 3 and 4).
The falling number method is used to quantify the damages caused by PHS. The FN was elevated in sowing performed in E4 (Tables 3 and 4), which indicated a lower PHS (Figures 2 and 3). A low FN is associated with higher enzymatic activity of α-amylase (elevated PHS). Alterations in PHS and FN can affect the baking quality of wheat, particularly the mass volume, which indicates the amount of end-use flour; thus, an increased FN resulted in greater W (Figures 2 and 3).
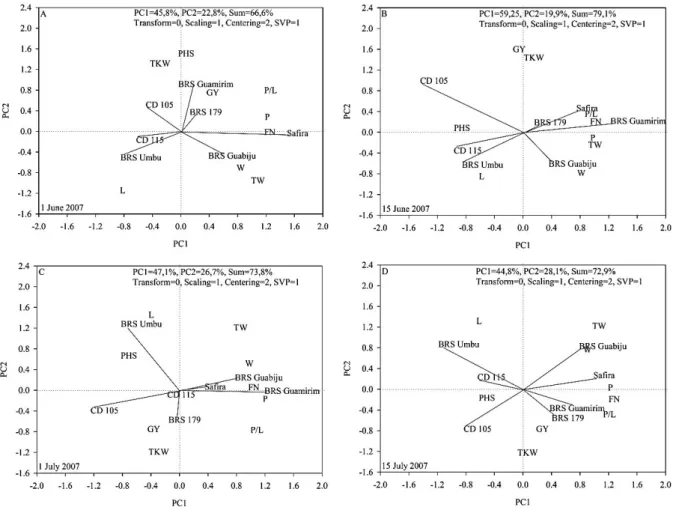
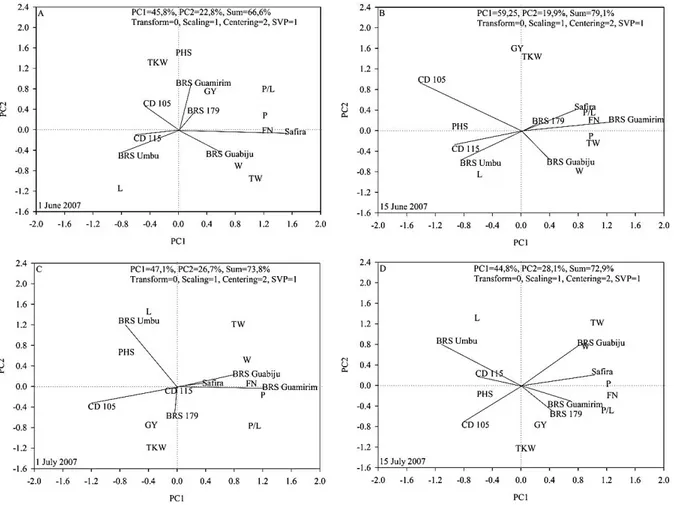
In 2007, the BRS Guamirim, BRS Guabiju and Safira cultivars showed high values for baking quality (W, TW, FN, P and P/L) and GY (Figure 4). However, sowing of the BRS Guamirim and Safira cultivars during E1 should be avoided because they exhibited a reduction in GY (Table 2) and a P/L greater than 1.2 (Table 3). The P/L ratio is important as it defines bread volume and structure, which should be between 0.5 and 1.2 for most types of bread (SEBASTIANO et al.,
2004). Regardless of sowing date, the BRS Guabiju cultivar showed the lowest PHS (0 to 0.1) and the greatest W (426 to 479) and TW (Figure 4). Independent of sowing date, the BRS Guabiju and Safira cultivars showed improver wheat, and the BRS Umbu cultivar showed bread quality. Moreover, the CD 105 and CD 115 cultivars exhibited a bread quality classification for all sowing dates, except in E1, where they produced soft flour. The BRS Guamirim cultivar was categorized as bread quality in E1 and improver baking quality in the remaining sowing dates (Table 3).
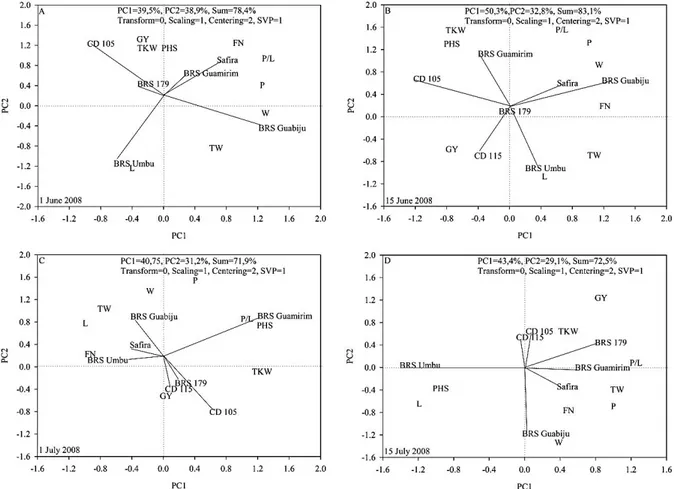
In 2008, the GY was higher than in 2007. The results indicated that it was more difficult to associate elevated grain yield with baking quality independent of the sowing date. Nevertheless, the BRS Guabiju cultivar in E3 and E4 and the Safira cultivar in all sowing dates showed high GY and high baking quality (Table 2 and Figure 5).
The BRS Guamirim and BRS 179 cultivars exhibited high GY and baking quality only in the last sowing date (Figure 5).
Figure 4. Association among cultivars with different sowing dates (A, 1st of June; B, 15th of June; C, 1st of July; and D, 15th of July) and
the quality parameters in 2007 following the GGE biplot methodology. The following abbreviations are used: ST, sowing time; TW, test weight (kg hL-1); TKW, thousand kernel weight (g); PHS, pre-harvest sprouting (%); FN, falling number; W, W-index (10-4 J); P,
Figure 5. Association among cultivars with different sowing dates (A, 1st of June; B, 15th of June; C, 1st of July; and D, 15th of July) and
the quality parameters in 2008 following the GGE biplot methodology. The following abbreviations are used: ST, sowing time; TW, test weight (kg hL-1); TKW, thousand kernel weight (g); PHS, pre-harvest sprouting (%); FN, falling number; W, W-index (10-4 J); P,
tenacity; L, extensibility (mm³); and P/L, tenacity/extensibility ratio.
Therefore, the BRS Guabiju and Safira cultivars stood out in regard to their wide adaptability to the sowing date and years evaluated with elevated productive potential and baking quality to meet the bakery industry needs (Figures 4 and 5). In particular, the BRS Guabiju cultivar was the only cultivar that was categorized as improver wheat, and this result was obtained in E1 and E2. The Safira cultivar showed bread quality, and the remaining cultivars were classified as soft wheat (BRS 179, BRS Umbu, CD 105 and CD 115) (Table 4). Schmidt et al. (2009) observed that the Safira cultivar stood out among 28 tested genotypes with respect to TW, W and FN; thus, they classified the Safira cultivar as improver wheat.
Conclusion
The results indicated that there was a differential response of the cultivars with respect to baking quality and grain yield in response to the evaluated sowing dates. Sowing that occurred in July yielded greater productivity. Sowing in June maximized the baking quality of wheat, and early-cycle cultivars
should be avoided at this sowing date. Sowing dates in which the grain filling occurred under elevated temperature positively affected the W and negatively affected grain yield. Adapted genotypes and an adequate sowing date can maximize the productivity and the baking quality of wheat.
Acknowledgements
The first author acknowledges a fellowship granted by CAPES, Brazil.
References
AACC-American Association of Cereal Chemists.
Approved methods of AACC. 10th ed. St. Paul: AACC, 2000.
BORDES, J.; BRANLARD, G.; OURY, F. X.; CHARMET, G.; BALFOURIER, F. Agronomic characteristics, grain quality and flour rheology of 372 bread wheats in a worldwide core collection. Journal of Cereal Science, v. 48, n. 3, p. 569-579, 2008.
BRASIL. Ministério da Agricultura, do Abastecimento e da Reforma Agrária. Instrução normativa n. 7, de 15 de agosto de 2001. Define as características de identidade e qualidade do trigo. Diário Oficial da União, Brasília, 15 de Agosto de 2001.
COVENTRY, D. R.; GUPTA, R. K.; POSWAL, R. S.; CHHOKAR, R. S.; SHARMA, R. K.; YADAV, V. K.; GILL, S. C.; MEHTA, A.; KLEEMANN, S. G. L.; BONAMANO, A.; CUMMINS, J. A. Wheat quality and productivity as affected by varieties and sowing time in Haryana, India. Field Crops Research, v. 123, n. 3, p. 214-225, 2011.
GAJU, O.; REYNOLDS, M. P.; SPARKES, D. L.; FOULKES, M. J. Relationships between large-spike phenotype, grain number, and yield potential in spring wheat. Crop Science, v. 49, n. 3, p. 961-973, 2009. GARRIDO-LESTACHE, E.; LÓPEZ-BELLIDO, R. J.; LÓPEZ-BELLIDO, L. Durum wheat quality under Mediterranean conditions as affected by N rate, timing and splitting, N form and S fertilization. European Journal of Agronomy, v. 23, n. 3, p. 265-278, 2005. GELIN, J. R.; ELIAS, E. M.; KIANIAN, S. F. Evaluation of two durum wheat (Triticum turgidum L. var. durum) crosses for pre-harvest sprouting resistance. Field Crops Research, v. 97, n. 2/3, p. 188-196, 2006.
GONÇALVES, S. L.; CARAMORI, P. H.; WREGE, M. S.; BRUNETTA, D.; DOTTO, S. Regionalização para épocas de semeadura de trigo no Estado do Paraná. Revista Brasileira de Agrometeorologia, v. 6, n. 2, p. 239-248, 1998.
GUARIENTI, E. M.; CIACCO, C. F.; CUNHA, G. R.; DEL LUCA, L. J. A.; CAMARGO, C. M. O. Avaliação do efeito de variáveis meterológicas na qualidade industrial e no rendimento de grãos de trigo pelo emprego de análise de componentes principais. Ciência e Tecnologia de Alimentos, v. 23, n. 3, p. 500-510, 2003.
HURKMAN, W. J.; WOOD, D. F. High temperature during grain fill alters the morphology of protein and starch deposits in the starchy endosperm cells of developing wheat (Triticum aestivum L.) grain. Journal of Agricultural and Food Chemistry, v. 59, n. 9, p. 4938-4946, 2011.
JALATA, Z. GGE-biplot Analysis of Multi-environment Yield Trials of Barley (Ordeium vulgare L.) Genotypes in Southeastern Ethiopia Highlands. International Journal of Plant Breeding and Genetics, v. 5, n. 1, p. 59-75, 2011.
JIANG, D.; YUE, H.; WOLLENWEBER, B.; TAN, W.; MU, W.; BO, Y.; DAI, T.; CAO, W. Effects of post-anthesis drought and waterlogging on accumulation of high-molecular-weight glutenin subunits and glutenin macropolymers content in wheat grain. Journal of Agronomy and Crop Science, v. 195, n. 2, p. 89-97, 2009.
LABUSCHAGNE, M. T.; ELAGO, O.; KOEN, E. The influence of temperature extremes on some quality and
starch characteristics in bread, biscuit and durum wheat.
Journal of Cereal Science, v. 49, n. 2, p. 184-189, 2009. MAACK, R. Geografia física do Estado do Paraná. Curitiba: Banco de Desenvolvimento do Paraná, 1968. MÓDENES, A. N.; SILVA, A. M.; TRIGUEROS, D. E. G. Avaliação das propriedades reológicas do trigo armazenado.
Ciência e Tecnologia de Alimentos, v. 29, n. 3, p. 508-512, 2009.
MOLDESTAD, A.; FERGESTAD, E. M.; HOEL, B.; SKJELVÀG, A. O.; UHLEN, A. K. Effect of temperature variation during grain filling on wheat gluten resistance.
Journal of Cereal Science, v. 53, n. 3, p. 347-354, 2011. MOTZO, R.; FOIS, S.; GIUNTA, F. Protein content and gluten quality of durum wheat (Triticum turgidum subsp. Durum) as affected by sowing date. Journal of the Science of Food and Agriculture, v. 87, n. 8, p. 1480-1488, 2007. PINNOW, C.; BENIN, G.; VIOLA, R.; SILVA, C. L.; GUTKOSKI, L. C.; CASSOL, L. C. Qualidade industrial do trigo em resposta à adubação verde e doses de nitrogênio.
Bragantia, v. 72, n. 1, p. 20-28, 2013.
RHARRABTI, Y.; ELHANI, S.; NUÑES, V. M.; MORAL, L. F. G. Protein and lysine contente, grain yield, and other technological traits in durum wheat under Mediterranean conditions. Journal of Agricultural and Food Chemistry, v. 49, n. 8, p. 3802-3807, 2001.
RHARRABTI, Y.; VILLEGAS, D.; ROYO, C.; NÚÑEZ-MARTOS, V.; MORAL L. F. G. Durum wheat quality in Mediterranean environments II. Influence of climatic variables and relationships between quality parameters. Field Crops Research, v. 80, n. 2, p. 133-140, 2003.
RIBEIRO, T. L. P.; CUNHA, G. R.; PIRES, J. L. F.; PASINATO, A. Phenological responses of Brazilian wheat cultivars to vernalization and photoperiod. Pesquisa Agropecuária Brasileira, v. 44, n. 11, p. 1383-1390, 2009.
SCHEUER, P. M.; FRANCISCO, A.; MIRANDA, M. Z.; OGLIARI, P. J.; TORRES, G.; LIMBERBER, V.; MONTENEGRO, F. M.; RUFFI, C. R.; BIONDI, S. Characterization of Brazilian wheat cultivars for specific technological applications. Ciência e Tecnologia de Alimentos, v. 31, n. 3, p. 816-826, 2011.
SCHMIDT, D. A. M.; CARVALHO, F. I. F.; OLIVEIRA, A. C.; SILVA, J. A. G.; BERTAN, I.; VALÉRIO, I. P.; HARTWIG, I.; SILVEIRA, G.; GUTKOSKI, L. C. Genetic variability for bread making quality and grain yield among brazilian wheat genotypes. Bragantia, v. 68, n. 1, p. 43-52, 2009.
SEBASTIANO, R.; SIMÓ-ALFONSO, E.; CITTERIO, A.; RAMIS-RAMOS, G. Prediction of wheat dough W and P/L inflation test parameters by cappylary zone electrophoresis of a protein extract followed by multivariate regression.
Electrophoresis, v. 25, n. 17, p. 2970-2977, 2004.
SINGH, S.; GUPTA, A. K.; KAUR, N. Effect of sowing time on protein quality and starch pasting characteristics in wheat (Triticum aestivum L.) genotypes grown under irrigated and rain-fed conditions. Food Chemistry, v. 122, n. 3, p. 559-563, 2010.
TRIBOI, E.; TRIBOI-BLONDEL, A. M. Productivity and grain or seed composition: a new approach to an old problem. European Journal of Agronomy, v. 16, n. 3, p. 163-186, 2002.
WHEELER, T. R.; HONG, T. D.; ELLIS, R. H.; BATTS, G. R.; MORISON, J. I. L.; HADLEY, P. The duration and rate of grain growth, and harvest index, of wheat (Triticumaestivum L.) in response to temperature and CO2.
Journal of Experimental Botany, v. 47, n. 298, p. 623-630, 1996.
YAN, W. GGEBiplot. A windows application for graphical analysis of multienvironment trial data and other types of two-way data. Agronomy Journal, v. 93, n. 5, p. 1111-1118, 2001.
YAN, W.; HOLLAND, J. B. A Heritability-adjusted GGE biplot for test environment evaluation. Euphytica, v. 171, n. 3, p. 355-369, 2010.
YAN, W.; TINKER, N. Biplot analysis of multi-environmet trial data: Principles and applications. Canadian Journal of Plant Science, v. 86, n. 3, p. 623-645, 2006.
YAN, W.; HUNT, L. A.; SHENG, Q. L.; SZLAVNICS, Z. Cultivar evaluation and mega-environment investigation based on the GGE Biplot.
Crop Science, v. 40, n. 3, p. 597-605, 2000.
Received on February 28, 2012. Accepted on June 9, 2012.