W O R K I N G PA P E R S E R I E S
N O. 4 3 8 / F E B R U A RY 2 0 0 5
QUALITY OF
PUBLIC FINANCES
AND GROWTH
In 2005 all ECB publications will feature a motif taken from the €50 banknote.
W O R K I N G PA P E R S E R I E S
N O . 4 3 8 / F E B R U A R Y 2 0 0 5
This paper can be downloaded without charge from http://www.ecb.int or from the Social Science Research Network electronic library at http://ssrn.com/abstract_id=647962.
QUALITY OF
PUBLIC FINANCES
AND GROWTH
1by António Afonso
2,
Werner Ebert
3,
Ludger Schuknecht
4and Michael Thöne
51 We are grateful to the participants at the meeting of the EPC Working Group on the Quality of Public Finances, Brussels, August 2004, for helpful comments, particularly to Frédéric Bobay, Elena Flores, Niels Frederiksen, Heinz Handler, Georges Heinrich, Christian Kastrop, Balázs Romhányi, and Maurice Weber.We are also grateful to Gabriela Briotti,Vítor Gaspar, Rolf Strauch and an anonymous referee for helpful comments and contributions. Any remaining errors are the responsibility of the authors.The opinions expressed herein are those of the authors and do not necessarily reflect those of the author’s employers. 2 European Central Bank, Kaiserstraße 29, D-60311 Frankfurt am Main, Germany; e-mail: [email protected]
© European Central Bank, 2005 Address
Kaiserstrasse 29
60311 Frankfurt am Main, Germany Postal address
Postfach 16 03 19
60066 Frankfurt am Main, Germany Telephone
+49 69 1344 0 Internet http://www.ecb.int Fax
+49 69 1344 6000 Telex
411 144 ecb d All rights reserved.
Reproduction for educational and non-commercial purposes is permitted provided that the source is acknowledged.
The views expressed in this paper do not necessarily reflect those of the European Central Bank.
The statement of purpose for the ECB Working Paper Series is available from the ECB website, http://www.ecb.int.
C O N T E N T S
Abstract 4
Non-technical summary 5
1. Introduction 7
2. Public finances affect growth 8
2.1 Institutional framework 9
2.2 Government spending 10
2.3 Tax systems 12
2.4 Public finances and macroeconomic
stability 14
3. Assessing public finance quality and its
growth impact 15
3.1 Measuring the quality of public
finances indirectly 15
3.1.1 Expenditure policies 15
3.1.2 Tax policies 18
3.1.3 Fiscal institutional framework 21
3.2 Empirical findings on the growth impact 21
3.2.1 Growth effects of government size 22
3.2.2 Growth effects of taxation and the spending composition 24
3.2.3 Institutional linkages 28
3.2.4 Making use of the evidence 28
4. Summary and conclusions 31
Appendix – Long-term growth theoretical
framework 33
References 35
Abstract
In this paper we review the linkages between the quality of public finances, that is, the level and composition of public expenditure and its financing via revenue and deficits, and economic growth. We review the various channels through which public finances affect growth and its underlying determinants (institutional framework, employment, savings and investment, innovation). The paper addresses the approaches used to assess the performance and efficiency of public spending, and surveys the empirical findings on the impact of fiscal variables on sustained economic growth.
Keywords: quality of public finances, efficiency, growth.
Non-technical summary
In this paper we review the linkages between the quality of public finances, that is the level and composition of public expenditure and its financing via revenue and deficits, and economic growth. The importance of high-quality fiscal policies for economic growth has been brought to the forefront by a number of developments over the past decades. Member States of the European Union are bound to fiscal discipline through the Stability and Growth Pact which limits their scope to conduct unfinanced spending. Globalisation makes capital and even tax payers more mobile and exerts pressure on governments’ revenue base.
The study provides arguments and quantitative evidence that fiscal policies are of high quality and support growth if they fulfil the following requirements: (i) provide for an institutional environment that is supportive to growth and sound public finances, (ii) limit commitments to the essential role of government in providing goods and services, (iii) set growth promoting incentives for the private sector and make efficient use of public
resources, (iv) finance government activities and where appropriate private sector activities with an efficient and stable tax system, and (v) support macroeconomic stability through stable and sustainable public accounts.
Some of the main conclusions of the paper are as follows:
A well-defined institutional framework is important to support the long-run growth of the economy and ‘high quality’ public finances play an important role for its functioning;
Fiscal policy can contribute to macroeconomic stability and a sound policy mix and create expectations that foster economic growth;
On the spending side, certain core spending items are essential for the economy to function and to grow. However, these services also must be delivered in a cost-effective way;
A main growth element is public investment, especially in human capital and – under certain conditions - in R&D. The growth effects of physical capital investment are less clear-cut;
Redistributive spending can undermine growth. However, a certain basic level of redistribution and social spending is probably necessary as a social infrastructure.
Taxes should be not distorting and should display low marginal rates while avoiding tax uncertainty and time inconsistency;
The survey of different empirical studies shows that an objective and unambiguous overall catalogue of “high quality”-expenditure items is not feasible. There is no cookbook for growth. Economics gives an idea of the major ingredients, but it does not clearly tell the recipe;
The quality-indicators for public finances developed in the meantime can only be illustrative. Within their methodical limits, indicator-concepts may offer orientation on their respective aspects of quality. But no indicator can in fact measure the comprehensive quality of public finances;
1. Introduction
This study reviews the linkages between the quality of public finances, that is the level and composition of public expenditure and its financing via revenue and deficits, and economic growth. The importance of high-quality fiscal policies for economic growth has been brought to the forefront by a number of developments over the past decades. Member States of the European Union are bound to fiscal discipline through the Stability and Growth Pact which limits their scope to conduct unfinanced spending. Globalisation makes capital and even tax payers more mobile and exerts pressure on governments’ revenue base. At the same time, expenditure pressures do not abate, and countries will soon have to face up to the fiscal consequences of ageing population.
The study reviews the literature and, thereby, provides arguments and quantitative evidence that fiscal policies are of high quality and support growth if they fulfil the following requirements: (i) maintain an institutional environment that is supportive to growth and sound public finances, (ii) limit commitments to the essential role of government in providing goods and services, (iii) set growth promoting incentives for the private sector and make efficient use of public resources, (iv) finance government activities and (regulate) private sector activities with an efficient and stable tax system, and (v) support macroeconomic stability through stable and sustainable public accounts.
If these conditions are fulfilled, fiscal policies boost growth via positive effects directly on employment, savings/investment and innovation and, indirectly, via the institutional framework.6
6
The direct transmission channels to growth are derived from the growth literature whereby fiscal policies can affect “exogenous” growth through its effect on labour, capital accumulation and technological progress and it can create “endogenous” growth effects, for example, when it boosts learning-by-doing effects or contributes to the development of a “knowledge-producing” sector.
By contrast, the measurement of public sector efficiency is a difficult empirical issue and the literature on it, particularly when it comes to aggregate and international data is rather scarce. Recently, progress has been made in this regard by shifting the focus of the analysis from the amount of resources used by a ministry or a programme to the services
delivered or outcomes achieved.
The paper is organised as follows. Section two addresses the various channels through which taxes and spending affect growth. Section three assesses public finance quality and its growth impact by discussing measurement issues and empirical findings. Section four presents the summary and the conclusions of the paper.
2. Public finances affect growth
Public finances affect growth in several ways. In the understanding developed here, growth is primarily defined as long-term growth potential, and not short term or cyclical growth. This section briefly reviews the economic linkages between spending, tax policies and growth, as well as the relevance of the institutional framework, and the contribution of public finances to macroeconomic stability. There is by now a considerable literature of which we provide some general references in the footnote below and more specific references in the text.7
7
2.1. Institutional framework
The institutional framework, that is, the environment within which fiscal policies operate, matters for growth via two main channels. First, the existence of a well-defined institutional framework is key to growth. Public finances, indirectly, play an important role for its proper functioning. Legal constraints and rules, such as well-established property rights or the existence of efficient markets minimise institutional uncertainty, and enhance the control over and security of returns on investment. Rules promoting market exchange (e.g. via contract law, freedom to set prices) are a prerequisite for a market economy. Functioning markets generate information via the price mechanism, which, in turn, induces agents to work, save, invest, specialise and innovate so as to make a profit. Rules must promote competition, secure adequate information and allow efficient risk management. They should also guarantee that government actions do not undermine but rather support the functioning of markets. In that way a well functioning institutional framework minimizes transaction costs for the private economy and helps to internalize externalities and spillovers. This view of the role of government has been
advocated by classical economists such as Adam Smith and advocates of the modern institutional and constitutional economics literature (including e.g. F. Hayek, D. North and J. Buchanan).
High quality public finances can indirectly support growth by supporting the broader institutional framework. With sufficient funds for internal and external security and public administration, well-trained and non-corrupt civil servants, judges, etc secure that the wheels of the economy are well greased. Underfunded, overstaffed administrations by contrast are prone to less well-functioning institutions (see e.g., van Rijckeghem and Weder (2002)). Prohibitive taxation undermines property rights and subsidised public services can destroy private markets.
and overly large public sectors and undermines the sustainability of public finances. Rules can also secure the stability of fiscal policies by preventing erratic changes in deficits, tax laws and expenditure programmes. Furthermore, rules can enhance the efficiency of fiscal policies and reduce the scope for rent seeking.
Budgets rules are particularly important because they determine the aggregation of spending demands and the solution of distributional conflicts. A number of techniques, such as performance budgeting, human resource management tools, market-like mechanisms of pricing, have been developed to provide the necessary information for a
technically sound allocation of resources and enhance the efficiency of the implementation process.8 Other examples of important institutional elements include audit rules, public procurement rules and cost-benefit analysis in the context of deciding on public activities and regulation as well as expenditure targets or sunset clauses.
2.2. Government spending
In the theoretical literature that links public finances with growth, three expenditure variables have been considered: public investment spending, public consumption spending and social welfare or redistributive spending. Some of this literature has also considered public spending that increases human capital and spending that contributes to innovation such as that for research and development as core spending as it enhances the human capital base (investment) and technological progress. Total government spending average about 45% of GDP in industrialised countries but the range from little over 30% of GDP to around 60% suggests enormous differences across countries (European Commission, AMECO, as quoted in Tanzi and Schuknecht (2003)).
There is some governmental activity and related public spending that is essential for the performance of the economy. This “core”, or “essential”, or “productive” spending may be as important to growth as private capital and labour. This core spending can directly raise the human and physical capital stock and technical progress in the economy but it can also do so indirectly by creating synergies for private activities. Without it the
8
economy will not function well and will not grow. The level of this spending depends on how efficient the government is in using the resources available. The more efficient is the government, the lower needs to be the spending level. But government spending depends also on a number of “exogenous” factors: geography, the level of development of the country and on the sophistication of its markets (Tanzi (2004)).
Core spending includes spending for essential administrative services and justice (see also the impact on growth via institutions as discussed above), basic research, basic education and health, public infrastructure, internal and external security and so on. Spending on these categories in industrialised countries are hard to assess precisely.
However, if approximated by public consumption they average about 20 percent of GDP or 45% of total public expenditure (cfr. European Commission, AMECO database).
Public spending on education (via human capital) and research and development (innovation/technical progress) enhances growth. As the new growth theory suggests, public activity is needed as it can compensate for market failure due to network-externalities, non-linearities and monopolistic competition. Public spending (e.g. in the areas of education and R&D) can drive education and R&D to a more efficient level than would prevail in a pure market scenario.
Redistributive spending by contrast can undermine growth by reducing incentives to work, invest in human capital or exercise entrepreneurial talents. Early retirement incentives or generous social assistance reduce labour supply and the incentive to maintain one’s human capital. On the other hand, spending on basic social safety nets reduces the need for precautionary savings and enhances the ability for risk taking and insofar could serve as a growth-promoting institutional factor. All in all, an increase in efficiently executed core spending can promote growth while an increase in non-core spending beyond basic safety nets can be assumed to retard growth. Redistributive spending, nevertheless, is the second most or even most significant expenditure category
Public investment is a narrower concept than productive or core spending. It is more specifically directed to the creation of physical infrastructure. Normally gross fixed capital formation is limited to around 2–3% of GDP (or about 5 percent of total spending) (see also European Commission (2004)).9
There is no question that public investment may contribute to growth. Apart from directly raising an economy’s capital stock, it is often argued that public investment on infrastructure is necessary to crowd in private investment and to reduce some private costs. However, in the theoretical as well as the empirical literature the impact is not clear-cut (see Pfähler et al. (1996)). First, the definition of what is an investment is
somewhat arbitrary and could lend itself to manipulation. Second, the use of strictly objective cost-benefit analysis has yet to enter investment decisions. Inefficient projects, often called “white elephants” can have very significant fiscal costs but with little impact on growth. Third, the increase in public investment could replace/discourage private investment. Still, in spite of these reservations, it must be maintained that properly defined public investment and efficiently executed public projects would contribute to growth.
2.3. Tax systems
Industrialised countries typically have well developed revenue collection system to finance the above-mentioned spending levels. As revenue must remain on average close to spending, the revenue ration also averages nearly 45% industrialised countries with roughly one third of this falling on indirect taxes on consumption, six tenths on direct taxes on incomes, and the remainder on other revenue.
The level of taxation is important because (a) taxes are generally distortive, and (b) taxes transfer resources from the private to the public sector and there is often the presumption that the private sector is more efficient in their use. A high level of taxation is likely, ceteris paribus, to reduce the growth potential of a country because of the negative impact that it might have on work incentives, investment, saving decisions, and on the allocation
9
of resources in general. In a global environment high taxes in one country may also reduce growth in that country by inducing capital flight towards lower taxed countries.
While taxes may reduce growth by being too high, they might also reduce it by being too low. This will happen if the level of taxation is too low to give the public sector of a country the resources necessary to provide essential government services. At least in theory, there must be a level and structure of taxation that could be considered “optimal” from a growth point of view because it would be just sufficient to finance the essential public services in an efficient way. When the tax level of a country exceeds this optimal level, a lowering of it could lead to faster growth. For instance, typical examples of
tax-induced distortions are labour-leisure decisions, savings-consumption decisions or the alternative allocation of consumption among various commodities and investment among various economic sectors.
Over the years, public finance experts have analysed the impact of different taxes and tax structure on economic variables, and have generally concluded that not all taxes have the same impact on the economy. Taxes that are imposed with high marginal rates (for example on the factor labour) are more damaging because economic theory teaches that the dead-weight cost of taxes grows with the square of the marginal tax rate. For this reason, on efficiency grounds, value added taxes (that are basically proportional taxes on consumed income) are preferred by many tax experts to personal income taxes that are
often applied with high marginal tax rates on both consumption and saving. In general, reforms that broaden the base of income taxes and reduce the marginal rates; or that replace income taxes with proportional sales taxes improve the efficiency of an economy.
While there are tax changes that improve the efficiency of the economy, it is also true that when tax systems are changed frequently in their structural and level aspects, these changes introduce “tax uncertainty”, and this could have negative effects on growth. Uncertainty makes economic decisions involving the future more difficult. This can
the incentive will cost revenue to the government, the investors may fear that they may be removed or reduced after the investments have been made.
In structural terms, taxes and subsidies can serve as one possible tool to internalise network-externalities and spillovers in (new growth) models where market price signals are not able to lead to a social optimal level of economic activity, e.g. in research and development (R&D), development of human capital or production of social and physical infrastructure.
2.4. Public finances and macroeconomic stability
Fiscal policies are one factor that can contribute to macroeconomic stability and a sound policy mix and, thereby, also support monetary policy in maintaining stable prices at low interest rates. Low deficits and debt ratios create expectations that public finances are sustainable so that expenditure policies and tax systems and rates will be predictable. This is conducive to economic growth because it creates an environment conducive to long-term-oriented savings and investment decisions (Sargent (1999)). By contrast, if,
over a sustained period of time, government revenue is much lower than total public spending, (thus, creating unsustainable macroeconomic imbalances and public debt accumulation) growth may be reduced because the private sector might come to see the fiscal situation as unsustainable and reduces investment in anticipation of future higher taxes. Moreover, uncertainty about the future tax changes and, thereby, the tax structure may exacerbate the negative effects and, in particular, reduce immobile capital investment that is vulnerable to tax increases.10
Moreover, low deficits prevent the absorption of a large share of savings to finance the public sector (crowding out) which, in turn, benefits investors via lower interest rates and raises the capital stock (see Detken, Gaspar and Winkler (2004)). This argument is based on the presumption that Ricardian equivalence (i.e., lower public saving as reflected in
10
higher deficits is fully offset by higher private savings) does not hold. However, here a number of arguments and empirical evidence that suggests that at least some crowding out of private investment due to public imbalances should be expected (Blanchard (1985), Easterly and Rebelo (1993), Domenech, Taguas and Varela (1999)).
3. Assessing public finance quality and its growth impact
The impact of fiscal policies can be measured in two ways: First, indirectly, by looking at the outcome of public spending that might have a bearing on growth and, thereby, assessing the productivity and efficiency of the public sector; and second directly via statistical/econometric analysis or case studies.
3.1. Measuring the quality of public finances indirectly
3.1.1. Expenditure policies
The adequate measurement of public sector efficiency, particularly when it concerns services provision, is a difficult empirical issue and the literature on it, particularly when it comes to aggregate and international data is rather scarce (for a survey see Afonso, Schuknecht and Tanzi (2003). Recently, academics and international organisations have made progress in this regard by shifting the focus of the analysis from the amount of resources used by a ministry or a programme (inputs) to the services delivered or outcomes achieved (see OECD (2003a)).
There have been a number of attempts to measure public sector performance and efficiency by setting output/outcome measures in relation to inputs.11 Afonso, Schuknecht and Tanzi (2003) compute a composite indicator of public sector performance using several sub-indicators. One group seeks to measure the functioning of the markets and the
11 See Afonso et al. (2003) for public expenditure performance and efficiency in OECD countries,
equality of opportunity for people by taking into account administrative/institutional, education, health and public infrastructure outcomes. They also look at several other indicators to incorporate information on the “Musgravian” functions of the government: stabilisation, redistribution and allocation. Although such structural indicators can give some first indication on the performance, they can only serve as an illustrative tool for assessment because the development of composite indicators that show an adequate weighting of the different aspects of the performance and sufficient comparability faces data and methodological obstacles.
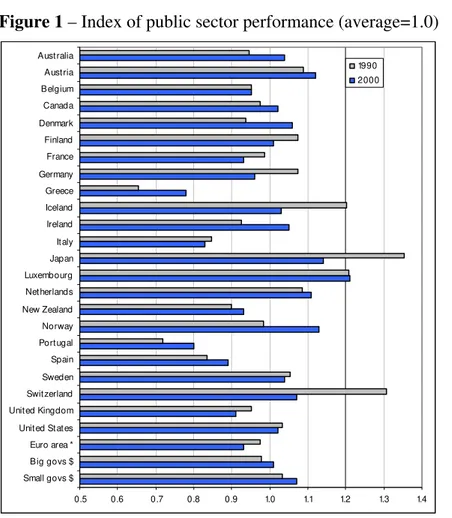
A general pattern that emerges is that countries with lower public spending-to-GDP ratios
show a better performance of their administration/institutions and more growth while large public sectors are correlated with more equal income distribution. Spending on and performance of education and health systems seem to be less correlated. Naturally, trying to determine the “optimal” composition and size of public spending has to be seen in perspective, given the policy options and priorities of each country.
Figure 1 – Index of public sector performance (average=1.0)
0.5 0.6 0.7 0.8 0.9 1.0 1.1 1.2 1.3 1.4 Small govs $
Big govs $ Euro area * United States United Kingdom Switzerland Sweden Spain Portugal Norway New Zealand Netherlands Luxembourg Japan Italy Ireland Iceland Greece Germany France Finland Denmark Canada Belgium Austria Australia 1990 2000
Source: Compiled from Afonso (2004) and partially arranged from Afonso, Schuknecht and Tanzi (2003).
* Weighted average according to the share of each country GDP. $ Small governments: public spending <40% of GDP.
Big governments: public spending >50% of GDP.
Subsequently, in the aforementioned study public sector performance is set in relation to resources used, i.e. public expenditure. Differences in efficiency turned out to be very significant and in particular the costs of more equal income distribution in terms of higher
spending (and taxes) and less favourable economic performance were found to be rather high.
The analysis of public sector productivity and efficiency is usually done by applying non-parametric approaches such as the Free Disposable Hull or the Data Envelopment Analysis.12 With this sort of non-parametric analysis Afonso et al. (2003) show that
12
European countries spend on average 30% more than the most efficient OECD country would have used to attain the same performance. Overall, the results of the study also seem to indicate declining marginal productivity of public spending.
A study of education and health expenditures by Afonso and St. Aubyn (2004) further illustrates these non-parametric approaches and also sheds some light on the shortcomings. The study assesses the efficiency in secondary education and health in OECD countries in 2000 by looking at quantity measures of inputs. For education, the OECD PISA indicator is the output measure and two quantity measures are used as inputs: the number of hours per year spent in school and the number of teachers per
student.13 For health, the quantitatively measured inputs are the number of doctors, nurses and hospital beds, while the outcomes are infant mortality and life expectancy.
3.1.2. Tax policies
Assessing the quality of public finances, one also needs to look at the way governments use taxation to finance their borrowing requirements. Naturally, tax systems play a relevant role in determining not only the efficiency of the public sector but also of the overall economy.
When evaluating the tax policies of particular countries it is necessary to go beyond statutory rates and to develop indicators, which bear a stronger and sounder relation with the taxes actually paid, and assess effective taxation. Since there are quite a few elements of tax-benefit systems that have to be accounted for when making cross-country comparisons, the so-called “effective tax rates” show relative tax burdens resulting from
i
y
i
x yi =F(xi) ( )
i
i F x
y <
public sector performance of country i, measured by an indicator , the output, which depends on a set of factors, , the inputs: . If , it is said that country i exhibits inefficiency. For the observed input level, the actual output is smaller than the best attainable one and inefficiency can then be measured by computing the distance to the theoretical efficiency frontier.
13
the joint operation of taxes, social security contributions and benefits, in a comprehensive fashion.
Therefore, indicators frequently used in this context are “effective” tax rates and “effective” marginal tax rate. For instance, Mendoza, Razin and Tesar (1994) compute aggregate effective tax rates on consumption, capital income and labour income for the G-7 countries, arguing that these tax rates are the appropriate ones to help transform theoretical insights into policy-making. “Effective” marginal tax rates are calculated by taking into account statutory tax rates and tax rules defining the taxable basis. They represent also by now a well-established approach to analyse the influence of taxes on
key macroeconomic variables such as saving, investment and employment.
Studies from the European Commission show that the tax burden on labour in the EU has been steadily increasing over the last thirty years.14 The “effective tax rate on labour” in the EU, defined as non-wage labour cost (employers’ and employees’ social security contributions) and personal labour income tax as a percentage of labour costs, was about 30% in 1970 and increased to reach a peak of 38% in 1996. These figures compare to a tax burden on labour of only 24% in the USA, and some 20% in Japan. Since mid-1990s, the EU average tax burden on labour has started to decline in a number of EU countries, although only very slightly.
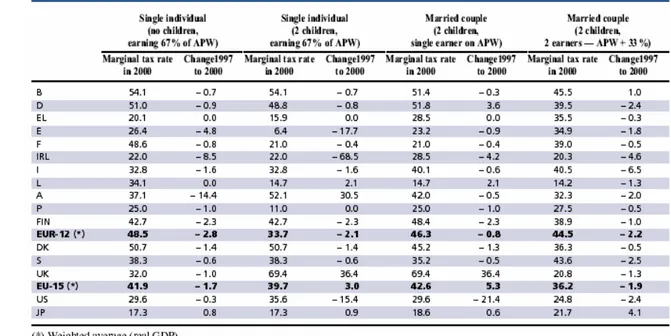
Marginal tax rates are useful indicators in investigating whether Member States face a “poverty trap” problem. According to an OECD (2001) study, over the period 1997-2000 most Member States succeeded in reducing the tax wedge on the low and medium earnings (see Table 1, copied from European Commission (2001, pp. 88)). The so-called poverty trap is due to the existence (and its rapid withdrawal) of income-tested tax allowances and/or a steep progressiveness built into the tax system that leads to
14
particularly high marginal rates at the lower end of the wage distribution.15 With little disposable income from additional work effort, labour supply is reduced.
Table 1 – Marginal tax rates in the EU 1997–2000
(income tax plus employees contributions less cash benefit, as % of gross wage)
The measurement of the tax burden and public expenditure is complicated in particular by the use of so-called tax expenditure. By “spending” via reducing the taxable base or by granting a tax break, they make average taxation and public spending look smaller than they would be if “open” expenditure and taxation were used instead. Brixi, Valenduc and Swift (2004) provide some results for the “forgone” revenues for some countries which can reach up to 4% of GDP.
The EC (2000) shows in simulations that tax distortions would be reduced and growth increased by shifting from direct to indirect taxation since consumption taxes are less distortionary than labour income taxes. Additionally, a tax shift from labour income to indirect taxes is under certain circumstances, a valid alternative to expenditure reduction
15
in terms of fiscal consolidation since by fostering employment and growth such tax shift may also reduce unemployment transfers (see also EC (2000) for further empirical references)).
3.1.3. Fiscal institutional framework
Budgetary institutions also play a key role in the quality of public finances. The measurement of the quality of fiscal institutions is a difficult task. Some progress has been made to measure the quality of institutions to maintain fiscal discipline. The relevant literature has identified two commitment technologies to achieve aggregate fiscal discipline: the delegation of power to a strong minister of finance and the creation of a fiscal contract (see Hallerberg, Strauch and von Hagen (2004)). In the delegation approach, the minister of finance receives strong agenda setting powers in the planning and approval stage, and the necessary discretionary authority to keep the budget on track during the implementation stage. In the contract approach, leading policy makers agree on the overall budget target before the actual budgeting process starts. During the
approval and implementation stage, legislative authorities and the minister of finance need monitoring tools to ensure that the initial contract is kept. The quality of institutions under these approaches has then been assessed via surveys on the relevant parameters.
Empirical work with the resulting measures on the quality of budget institutions have shown that the quality of budgetary institutions differs considerably in Europe and matters for maintaining fiscal discipline. On average, however, institutions have improved over the last decade. Moreover, more stringent multi-annual budgetary targets have helped to contain deficits almost across all countries.
3.2. Empirical findings on the growth impact
govern-ment size and its financing affects growth. In the centre of the analysis presented here are the growth effects of the composition of government activities. While still on the aggregate level, this investigation necessarily takes place one level below the “size effects”. The second and relatively small groups looks at case studies and, thereby, emphasize more the analysis of the policy process in the broader context that reforms take time and concern different policy domains.
3.2.1. Growth effects of government size
Before reviewing the econometric evidence on the growth enhancing (or reducing)
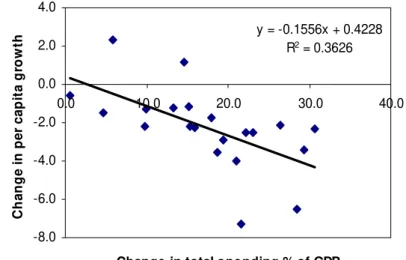
consequences of general government’s total expenditures, a few stylised facts may give a good first impression. For 24 OECD countries, Tanzi and Schuknecht (2003) plot the changes in total government spending in the last 40 years of the 20th century against the changes in per capita GDP growth (Figure 2).
Figure 2 – Change in total spending 1960 –2000 versus change in per capita growth, 1960s –1990s
y = -0.1556x + 0.4228 R2 = 0.3626
-8.0 -6.0 -4.0 -2.0 0.0 2.0 4.0
0.0 10.0 20.0 30.0 40.0
Change in total spending % of GDP
C h a nge i n pe r c a p ita gr ow th Source: AMECO
The illustration of the growth-spending dynamics in the very long run shows a strong
correlation between total spending increases and growth declines. The same applies for a
similar plot of gross fixed capital formation (one of the main growth determinants) and
formation is strongly and negatively correlated with total government expenditure.
These stylised facts lay no claim to statistical significance. Yet, they are supported by most econometric studies in this field. Table 2 gives a brief overview of recent papers.16
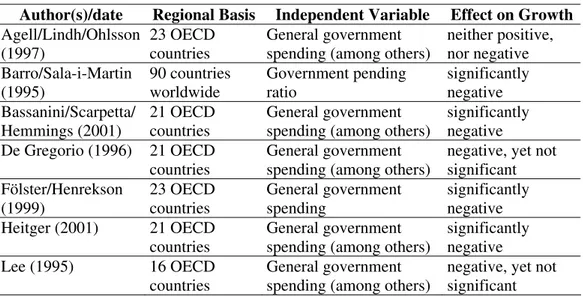
Table 2 – Growth effects of total government expenditure
Author(s)/date Regional Basis Independent Variable Effect on Growth
Agell/Lindh/Ohlsson (1997)
23 OECD countries
General government spending (among others)
neither positive, nor negative Barro/Sala-i-Martin (1995) 90 countries worldwide Government pending ratio significantly negative Bassanini/Scarpetta/ Hemmings (2001) 21 OECD countries General government spending (among others)
significantly negative De Gregorio (1996) 21 OECD
countries
General government spending (among others)
negative, yet not significant Fölster/Henrekson (1999) 23 OECD countries General government spending significantly negative Heitger (2001) 21 OECD
countries
General government spending (among others)
significantly negative
Lee (1995) 16 OECD
countries
General government spending (among others)
negative, yet not significant
The “size effect” of government spending on growth is mostly negative. No study has found a positive relationship between growth and aggregate expenditure. Agell, Lindh and Ohlsson (1997) did not find clear evidence on the nature of the relation between the two variables. De Gregorio (1996) and Lee (1995) could not confirm the significance of the negative spending effects on growth. However, all other studies reviewed assert the significance of these effects.
This negative correlation is not a linear function. The review of composition-effects of public spending below will show that, at the core level, the productive effects of a certain
16
This and further literature reviews below were compiled with additional reference to surveys of empirical research, namely: Agell, Lindh and Ohlsson (1997), Temple (1999), Ahn and Hemmings (2000), David, Hall and Toole (2000), European Commission (2002), Florax, de Groot and Heijungs (2002), Nijkamp and Poot (2003), Lamo and Strauch, R. (2002), OECD (2003), Tanzi and Schuknecht (2003), Thöne (2004), Kirchgässner (2004), and Schuknecht and Tanzi (2005).
direct taxes and employment ratios is noteworthy (see also Prescott (2004)).
level and some components of public expenditure are very high, because government activities set the indispensable framework in which economic growth takes place. But the evidence in Table 2 gives reason to believe, that the governments in OECD countries have outgrown these “purely productive” spending dimensions and now crowd out more productive private sector activities.
3.2.2. Growth effects of taxation and the spending composition
Before analysing further the effect of expenditure components on growth, we look at taxation. The econometric evidence on the growth effects of the means employed to finance the size of government spending supports the argument that a high level of taxation impairs the allocation of resources, mainly by depressing incentives to work, to invest and/or to save. Moreover, if taxation leads to high und sustained government deficits and growing debt, growth is harmed through many channels as discussed above (see Tanzi and Chalk (2000)).
For taxation in OECD countries, quite a few studies find significant negative effects on growth (see Cashin (1995), de la Fuente (1997), Fölster and Henrekson (1999), and Kneller, Bleaney and Gemmell (1998)). Yet other studies cannot find a relationship, be it positive of negative. Again, no study so far has shown positive growth effects of high taxation. The empirical literature also supports the general view on government deficits. Where budget deficits have been tested econometrically, they have often displayed significant negative growth effects (see Martin and Fardmanesh (1990), Easterly and Rebelo (1993), Miller and Russek (1997), de la Fuente (1997), Kneller et al. (1998) and Bleaney et al. (2001)). For aggregate government debt, analogous arguments apply (see European Commission (2004)).
of the composition of government activities clarifies that not all kinds of government spending should be treated alike when consolidating public finances.17
The evidence on differentiated growth effects of “qualitative” spending aspects crucially depends on the quality of the available data. Econometric studies on the macroeconomic level often face the necessity to used highly aggregated components of public spending. This sometimes leads to empirical endeavours that produce seemingly tautological results like: “Specifically we find that (1) distortionary taxation reduces growth, whilst non-distortionary taxation does not; and (2) productive government expenditure enhances growth, whilst non-productive expenditure does not” (Kneller et al. (1998)). When
in-stead looking at the more disaggregated spending level, empirical analyses often must resign themselves to the use of intermediate impact indicators which display a plausible relation to growth, but do not facilitate direct evidence.
The foremost component of government spending traditionally associated with positive growth effects is investment expenditure. Following Aschauer’s (1989) seminal paper many studies have found positive growth effects of the acquisition or the accumulation of physical capital goods by governments (see for OECD countries, e.g., Cashin (1995), Nourzad and Vrieze (1995), Sanchez-Robles (1998), Shioji (2001) and Kamps (2004)). Yet, the size of the effects differs considerable. A large number of authors present evidence that public investment expenditure has no significant impact on growth (see for OECD countries, e.g., Barth and Bradley (1988), Ford and Poret (1991), Holtz-Eakin (1994), Yi and Kocherlakota (1996) and Cassou and Lansing (1999)).18 Moreover,
investment can be productive or unproductive for growth depending on the institutional context in which it is undertaken. Keefer and Knack (2002) show that secure property
17
For brevity’s sake, the evidence on growth effects of different tax regimes cannot be reproduced here. By and large, empirical studies reconfirm the theoretical assertions that (1) indirect taxes harm growth less than direct taxes and that (2) high tax rates of direct taxes are especially damaging for incentives and general allocation.
18
rights and the rule of law significantly affect the growth-enhancing impact of public investment.
But there is less polarity in the discussion than it may seem from these contrasting results. A certain consensus has emerged that public investment still is important for growth, but less important than it used to be (European Commission (2003)). In economic theory, public expenditure on physical capital can enhance growth only, if it is spent on infrastructures that serve as inputs to private investment. This notion is affirmed by empirical evidence, mainly for investments in transport, communication and public
utilities (see e.g. Easterly and Rebelo (1993), Devarajan, Swaroop and Zou (1996)).
For infrastructure spending, there is also evidence that the law of diminishing returns holds. De la Fuente (1997), for example, has shown that public investment is beneficial only up to a level of two percent of GDP. This perspective is endorsed by Kalyvitis and Kalaitzidakis (2002) in their case study for Canada: In this “mature” economy equipped with a high level of infrastructure, its maintenance promises high productivity effects, whereas newly added infrastructure yields low or even negative marginal returns. As a conclusion from the mixed empirical findings, Thöne (2004) advocates to dismiss the “classical” focus on investment spending in favour of a direct focus on spending for infrastructure services.
In contrast, the empirical literature on the significant positive growth effects of public activities in the production of human capital is almost unequivocal (see for OECD countries, e.g. Englander and Gurney (1994), De Gregorio (1996), Keefer and Knack (1997), De la Fuente and Domenech (2000), Bassanini and Scarpetta (2001), Gemmell and Kneller (2001), Heitger (2001), Buysse (2002) and OECD (2003b)). Due to limited data availability, all empirical studies are restricted to formal school education. Thus, the human capital effect of vocational training is not reflected in the findings. A second restriction directly relates to public finances. Most empirical studies do not use public
growth enhancing public expenditures can only be sustained with a strong link to efficiency issues.
In modern industrial or “post-industrial” economies, research and development is undoubtedly one of the major causes of economic growth. But the growth impacts of public R&D-activities are treated controversially in the empirical literature: are public
and private R&D substitutes, or do they complement one another? Only in the latter case public R&D spending can bring about positive effects on economic growth, because it does not crowd out private R&D. The studies of Robson (1993), Park (1995), Busom
(1999), Diamond (1999), Guellec and van Pottelsberghe de la Potterie (2000) give evidence for complementarity, while the studies of Toivanen and Niininen (1998), Wallsten (1999), Bassanini, Scarpetta and Hemmings (2001) indicate crowding out. As only a slight majority of econometric research supports the notion of complementarity, the empirical question should be treated as unsolved.19
Health policy has long been counted among the growth-enhancing government activities, because good health improves human capital and thereby growth. Bleaney, Kneller and Gemmell (2001) find a significant positive impact of health expenditures on growth in OECD countries. Bloom, Canning and Sevilla (2001) support this view in a worldwide study. Yet with respect to the OECD, Rivera and Currais (1999) see evidence for reverse causality: economic growth has created high real incomes which enable people to spend more on the consumption good ‘health’.
There are also other policies that may help to mobilise human capital. In many countries women still have insufficient chances and incentives to combine family life with a long-term professional career. The ensuing low labour utilisation is an important obstacle to satisfactory growth dynamics. As far as government expenditure is concerned, particularly early childcare measures significantly increase female labour market participation. This is supported the empirical evidence on the high negative elasticity of
female labour supply with respect the individual costs of out-of-home childcare (see e.g.
19
Ribar (1992), Averett et al. (1997), Anderson and Levine (1999), Kimmel (1999), Han and Waldfogel (2001)).20
3.2.3. Institutional linkages
Finally, we should look at the transmission from fiscal policies to growth via the institutional framework. There is little modern empirical literature on this issue so far but important work has looked at this dimension from a case study perspective (see also below for the use of case studies to discuss the impact of broader fiscal and institutional reform programs).
North (1990, 1998) provides fascinating accounts of how fiscal policies, institutions and growth interact. North explores how England and Spain from similar starting points went very different ways in their economic development. Both countries needed more money to finance their wars. In England, decentralized decision making with independent courts, secure property rights and a well developed mercantile law including patent law gave rise
to a law-based market economy, with much investment and innovation and rapidly developing capital markets. This also filled the government’s coffers via moderate taxation. In Spain by contrast, the government stifled economic exchanges/trade with over-regulation, the sale of monopoly rights and price controls. Over-taxation and confiscation undermined property rights. The two basic rules supporting investment, innovation and growth could hence not develop. Fiscal revenue, though perhaps initially buoyant, suffered.
3.2.4. Making use of the evidence
How do we interpret the evidence on the growth impact of diverse fiscal instruments and objectives? An ideal econometric study on the growth impact of fiscal variables might come to a conclusion like: “For our panel of 20 OECD countries, an x percent increase of
20
general government spending on the y-item in 1975-1995 increased GDP growth rates by z percent on average.” Of course, this is not a cookbook recipe for future growth. One of those OECD countries now increasing spending on the “y-item” by “x percent” would almost certainly not experience an increase of growth rates by “z percent”.
It goes without saying that, by its very nature, econometric analysis can give ex post evidence on “average” impacts only. Furthermore, the analysis of rather recent developments in OECD or EU countries cannot make allowances for non-linearities that especially become evident for core spending (protection of property rights, internal and external security).
Finally, the econometric foundation of the new growth literature itself is subject to controversial debate. When interpreting the evidence with a view to the quality of public finance, we should bear in mind that, despite its popularity, the “(…) new empirical growth literature remains in its infancy” (Durlauf and Quah (1999, pp. 295)). So far, in standard growth regressions a range of methodological problems are not sufficiently controlled for. On an elementary level, many of the empirical studies on the sources of growth are plagued with measurement error and specification problems (Schulz (1999, pp. 71)). Many variables of growth are endogenous, which raises identification problems. Endogeneity, if not properly dealt with, can easily give rise to the notorious post hoc ergo propter hoc fallacy, i.e. wrongly concluding causality from correlation. Yet, the obvious
answer to simultaneity – using exogenous instrumental variables to proxy for the regressors – requires very strong, in many cases implausible assumptions for the omitted growth determinants (Durlauf (2000, pp. 252)). The multiplicity of proposed variables which offer plausible partial explanations of growth also calls for procedures of variable selection, or, at least, for tests of robustness (see e.g. Levine and Renelt (1992) and Sala-i-Martin (1997)).
These and other problems of the empirical growth literature demonstrate that the above
exist.21 Nevertheless, there is no need to discard the empirical evidence surveyed in this
paper. Growth regressions may not always live up to the very high expectations they once raised. But still they give a good idea of the driving forces of growth. Some of the methodological problems mentioned can be overcome with the use of modern statistical methods.
Other problems of growth econometrics cannot be overcome because they do not reflect statistical or mathematical complications, but our limited understanding of the mechanics of growth. In spite of the major efforts to identify the sources of growth, we still have a simplistic growth concept that ignores many interdependencies and synergies of this
process. From this perspective, “greater eclecticism in empirical work” with a stronger reliance on qualitative case/country studies promises valuable additional insight (see Durlauf (2000)). Tanzi and Schuknecht (2000), for example, examine the fiscal reform in a number of countries in the 1980s and 1990s. They argue that comprehensive (“radical”) rather than piecemeal reforms, which improve the institutional framework and curb the rent seeking incentives of special interests, have been most successful in reducing public expenditure, changing the expectations and outlook of economic actors and re-invigorating economic growth. They provide a detailed account for the experiences of New Zealand and Chile but also make reference to the reforms in OECD countries such as Australia, Ireland, the Netherlands or the UK.
The interdependencies and synergies of all-in-one reforms give a good illustration why the same partial policies may lead to different growth results in different countries. Of course, institutional and political preconditions for radical reform are not alike in all countries. But be it comprehensive reforms, be it piecemeal reforms, a few issues stand out despite all methodological complicacies: it is certainly wise to treat policies that are positively associated with current economic growth differently than other policies which are not. And the returns for these “wisely spent” expenditures do not necessarily come tomorrow, but in the medium and – mainly – in the long-term.
21
4. Summary and conclusions
The present survey has addressed the fact that the “quality of public finances” indeed might have a potential impact on long-term economic growth. One key problem in the whole debate, however, is that the issue of “quality” is very difficult to capture. Moreover, theoretical limitations (economic theory, econometric studies) and data and methodological problems (construction of indicators) prevent exact quantifications handoff the impact of fiscal policies on growth. Some concluding points can now be summarised building on the previous sections.
- A well-defined institutional framework is important to support the long-run growth of the economy and ‘high quality’ public finances play an important role for its functioning;
- Fiscal policy can contribute to macroeconomic stability and a sound policy mix and create expectations that foster economic growth;
- The evidence on size effects of fiscal variables supports the case for quantitative
consolidation with a view to reducing total spending, thus enabling reductions of deficits and taxation. The empirical findings on growth effects of the composition of government activities clarify that not all kinds of government spending should be treated alike when it comes to reforming public finances;
- On the spending side, certain core spending items are essential for the economy to function and to grow. However, these services also must be delivered in a cost-effective way;
- A main growth element is public investment, especially in human capital and – under certain conditions - in R&D. The growth effects of physical capital investment are less clear-cut;
- Redistributive spending can undermine growth. However, a certain basic level of redistribution and social spending is probably necessary as a social infrastructure.
- The survey of different empirical studies shows that an objective and unambiguous overall catalogue of “high quality”-expenditure items is not feasible. There is no cookbook for growth. Economics gives an idea of the major ingredients, but it does not clearly tell the recipe;
- The quality-indicators for public finances developed in the meantime can only be illustrative. Within their methodical limits, indicator-concepts may offer orientation on their respective aspects of quality. But no indicator can in fact measure the comprehensive quality of public finances;
- In spite of all efforts to identify the sources of growth, we still have a simplistic growth concept that ignores many interdependencies and synergies of this process.
Appendix - Long-term growth theoretical framework22
Exogenous growth models first appeared in the 1950s, pioneered by Solow (1956) and Swan (1956). Set within the neo-classical framework, these models include a production function and a capital accumulation equation. The production function in its simpler version has two inputs, capital and labour, exhibit constant returns to scale in production and diminishing marginal productivity of both inputs. Assuming a Cobb-Douglas technology, it the production function can be written as follows
Y= F(K, L) = KαL1-α, (A1)
where Y is output, K is capital, L is the labour force, 0<α< 1. An alternative way of
expressing the production function is: y = kα, where k=K/L and y=Y/L are capital and output per unit of labour.
Capital accumulation obeys the following process:
Kt = sY-δKt-1, (A2)
where s is the aggregate saving rate and δ the depreciation rate of capital, both constant
and exogenous.
These models emphasise the role of physical capital accumulation as the cause of growth, but due to their feature of decreasing returns to capital, the growth process is non-sustainable. For fixed labour, each additional unit of capital gives a lower return than the previous one, and gradually the economy moves to a point where savings provide investment only to cover depreciation.
Sustainable growth requires “technological progress” which augments capital (and labour) productivity. An index of technical efficiency, A, which captures technical progress, is then introduced in the production function:
Y=A KαL1-α. (A3)
With such a production function specification, economies exhibit a long-run per-capita growth rate at the rate of technological change.
Technological change is not explained within the model, but taken as exogenous, and the model does not explain the determinants of long-term growth. According to the exogenous growth models policy changes only have impact on determining the level of output, they do not affect long-run growth rates, and they can raise the output growth but only during a transition period to a new steady state level of output.
22
Endogenous growth models, which were first pioneered in the 1980s by Romer (1986) and Lucas (1988), account for the introduction of endogenous mechanisms of technological change. These models constitute a useful framework to study the effects of fiscal policy on long-term growth. They allow sustained growth and policy changes have effects not only on the level of output but also on the growth rates. Perpetual growth of output is possible as capital has externality effects and or is defined in a broader way, i.e. diminishing returns do not apply. Accordingly, growth can permanently be raised by increasing aggregate savings, by inputs accumulation (labour, human and physical capital), by higher efficiency in the production process and by supporting technological progress and research and development (R&D) investment.
A basic framework is to assume that the capital is the only input in the production function and that output varies proportionally with capital, i.e. the production function exhibits constant returns to capital instead of diminishing. In this setting, as long as net investment is positive, output grows. This model is known as the AK model because of its production function is written as Y=AK.
Another approach is to define capital broadly including human capital (skills and knowledge in the labour force). There may be two investment processes in the model, investment in physical capital and in human capital with a production function which has constant returns to both capitals jointly.
References
Afonso, A. (2004). “A Note on Public Spending Efficiency,” CESifo DICE Report, Journal for Institutional Comparisons, 2 (1), spring, 35-39.
Afonso, A. and St. Aubyn, M. (2004). “Non-parametric Approaches to Public Education and Health Efficiency in OECD Countries.” (ISEG-UTL, Working Paper nº
1/2004/DE/CISEP/UECE) forthcoming in Journal of Applied Economics.
Afonso, A., Schuknecht, L. and Tanzi, V. (2003). “Public Sector Efficiency: an Inter-national Comparison,” ECB Working Paper n. 242, forthcoming in Public Choice. Agell, J., Lindh, T. and Ohlsson, H. (1997). “Growth and the public sector: a critical
review essay.” European Journal of Political Economy Vol. 13, 33-52.
Ahn, S. and Hemmings, P. (2000). “Policy influences on economic growth in OECD countries: an evaluation of the evidence,” OECD Economics Department Working Paper 246, Paris.
Alesina, A. and Perotti, R. (1995) “The Political Economy of Budget Deficits,” IMF Staff Papers, 42, 1-31.
Anderson, P. and Levine, P. (1999). “Child Care and Mothers’ Employment Decisions,” NBER Working Paper No. 7058, Cambridge M.A.
Aschauer, D. (1989). “Is public expenditure productive?” Journal of Monetary Economics, 23, 177-200.
Averett, S., Peters, H. and Waldman, D. (1997). “Tax Credits, Labor Supply and Child Care.” Review of Economics and Statistics, Vol. 79, 125-135.
Barro, R. and Sala-i-Martin, X. (1995). Economic growth, New York.
Barth, J. and Bradley, M. (1988). The impact of government spending on economic activity, The National Chamber Foundation, Washington D.C.
Bassanini, A. and Scarpetta, S. (2001). “Does human capital matter for growth in OECD countries? Evidence from pooled mean-group estimates,” OECD Economics Department Working Paper 282, Paris.
Blanchard, O. (1985). “Debts, deficits and finite horizons,” Journal of Political Economy, 93, 223-247.
Bleaney, M.; Gemmell, N. and Kneller, R. (2001). “Testing the Endogenous Growth Model: Public Expenditure, Taxation and Growth Over the Long Run.” Canadian Journal of Economics, Vol. 34 (1), 36-57.
Bloom, D.; Canning, D. and Sevilla, J. (2001). “The Effect of Health on Economic Growth: Theory and Evidence,” NBER Working Paper No. 8587, Cambridge MA.
Busom, I. (1999). “An Empirical Evaluation of the Effects of R&D Subsidies,” Working
Paper No. B99-05, Universitat Autonoma de Barcelona.
Buysse, K. (2002). “Human Capital and Growth in OECD Countries: the Role of Public Expenditure on Education,” mimeo, paper presented at the 4th Public Finances Workshop of the Banca d’Italia.
Brixi, H.; Valenduc, C. and Swift, Z. eds (2004). Tax Expenditures – Shedding Light on
Government Spending through the Tax System: Lessons from Developed and
Transition Economies, the World Bank, Washington D.C.
Brock, W. and Durlauf, S. (2001). “Growth Empirics and Reality,” University of Wisconsin, SSRI Working Paper No. 2024R, Madison WI.
Carey, D. and Tchilinguirian, H. (2000). “Average effective tax rates on capital, labour and consumption,” OECD Economics Department Working Paper 258.
Carone, G.; Salomäki, A.; Immervoll, H. and Paturot, D. (2003). “Indicators of
unemployment and low-wage traps (marginal effective tax rates on labour),” European Economy, Economic Papers 197, December, EC.
Cashin, P. (1995). “Government spending, taxes and economic growth.” IMF Staff Papers, Vol. 42, 237-269.
Cassou, S. and Lansing, K. (1999). “Fiscal Policy and Productivity Growth in the OECD.” Canadian Journal of Economics, Vol. 32, 1215-1226.
Clements, B. (2002). “How Efficient is Education Spending in Europe?” European Review of Economics and Finance, 1 (1), 3–26.
De Gregorio, J. (1996). “Inflation, Growth and Central Banks: Theory and Evidence,” The World Bank, Working Paper 1575, Washington D.C.
De la Fuente, A. (1997). “Fiscal Policy and Growth in the OECD.” CEPR Discussion Paper 1755, London.
De la Fuente, A. and Domenech, R. (2000). “Human Capital in Growth Regressions: How Much Difference Does Data Quality Make?” OECD Economics Department Working Paper No. 262.
Detken, C.; Gaspar, V. and Winkler, B. (2004). “On Prosperity and Posterity: The Need for Fiscal Discipline in a Monetary Union.” Frankfurt: Mimeo.
Devarajan, S.; Swaroop, V. and Zou, Z. (1996). “The composition of public expenditure and economic growth.” Journal of Monetary Economics, Vol. 37, 313-344.
Diamond, A. (1999). “Does Federal Funding “Crowd In” Private Funding of Science?” Contemporary Economic Policy, Vol. 17, 423-431.
Domenech, R.; Taguas, D. and Varela, J. (2000). “The Effects of Budget Deficit on National Saving in the OECD,” Economics Letters, 69(3): 377-83.
Durlauf, S. (2000). “Econometric Analysis and the Study of Economic Growth: A Skeptical Perspective.” In Backhouse, R. and Salanti, A. (eds), Macroeconomics and the Real World. Vol. I: Econometric techniques and macroeconomics, 249-261.
Durlauf, S. and Quah, D. (1999). “The New Empirics of Economic Growth. In: Taylor, J. and Woodford, M. (eds.): Handbook of Macroeconomics Volume 1A. Amsterdam (North Holland), 231–304.
Easterly, W. and Rebelo, S. (1993). “Fiscal Policy and Economic Growth: An Empirical Investigation.” Journal of Monetary Economics, Vol. 32 (3), 417-458.
ECB (2001). “Fiscal Policies and Economic Growth.” Monthly Bulletin, August, 41-57.
Englander, S. and Gurney, A. (1994). “Medium-term determinants of OECD productivity”, OECD Economic Studies, No. 22, Paris.
European Commission (2000). Public finances in EMU - 2000, European Economy 3/2000.
European Commission (2002). Public Finances in EMU - 2002, European Economy 3/2002, Luxembourg.
European Commission (2003). Public Finances in EMU - 2003, COM(2003) 283 final, Brussels.
European Commission (2004). Public Finances in EMU - 2004. A report by the Commission services, SEC(2004) 761. Brussels.
Florax, R.; de Groot, H. and Heijungs, R. (2002). “The Empirical Economic Growth Literature,” Tinbergen Institute Discussion Papers 2002-040/3, Amsterdam.
Fölster, S., Henrekson, M. (1999). “Growth and the Public Sector: A Critique of the
Critics.” European Journal of Political Economy, Vol. 15, 337-358.
Ford, R. and Poret, P. (1991). “Infrastructure and private-sector productivity,” OECD Economics Department Working Paper 91, Paris.
Freedman, D. (1997). “From association to causation via regression. In: McKim, V. and Turner, S. (eds.), Causality in Crisis? Indiana (University of Notre Dame Press), 113-161.
Easterly, W., Rebelo, S. (1993) Fiscal Policy and Economic Growth: an Empirical Investigation. Journal of monetary economics 32(3), 417-58.
Gemmell, N., Kneller, R. (2001). “The impact of fiscal policy on long-run growth,” European Economy No. 1-2001, 97-129
Guellec, D. and van Pottelsberghe de la Potterie, B. (2000). “The Impact of Public R&D
Expenditure on Business R&D,” OECD STI Working Paper 2000/4, Paris.
Hallerberg, M.; Strauch, R. and von Hagen, J. (2004). “The Design of Fiscal Rules and Forms of Fiscal Governance in Europe,” ECB, mimeo.
Han, W. and Waldfogel, J. (2001). “The Effect of Child Care Costs on the Employment of Single and Married Mothers.” Social Science Quarterly, 82(3), 552-568.
Heitger, B. (2001). “The Scope of Government and Its Impact on Economic Growth in OECD Countries,” Kiel Working Paper No. 103, Kiel.
Her Majesty’s Stationery Office (2004). Atkinson Review: Interim report. Measurement
of Government Output and Productivity for the National Accounts. London, July.
Holtz-Eakin, D. (1994) “Public sector capital and the productivity puzzle.” Review of Economics and Statistics, Vol. 76, 12-21.
Kalyvitis, S., and Kalaitzidakis, P. (2002). “Financing ‘New’ Public Investment and/or Maintenance in Public Capital for Long-run Growth? The Canadian Experience,” Athens University of Economics and Business, Athens.
Kamps, C. (2004). “New Estimates of Government Net Capital Stocks for 22 OECD Countries 1960-2001.” IMF Working Paper 04/67. International Monetary Fund. Washington D.C.
Kirchgässner, G. (2004). “Zum Zumsammenhang zwischen staalicher Aktivität und
wirtschftlicher Entwicklung“, University of St. Gallen, Department of Economics,
Discussion paper n. 2004-16.
Keefer, P., Knack, S. (1997). “Why don’t poor countries catch up? A cross-country test
of an institutional explanation,” Economic Inquiry, Vol. 35, 590-602.
Keefer, P. and Knack, S. (2002). “Boondoggles and Expropriation: Rent-Seeking and Policy Distortion when Property Rights are Insecure”. World Bank Working Paper 2910, Washington D.C.
Kimmel, J. (1999). “The Effectiveness of Child Care Subsidies in Encouraging the Welfare to Work Transition of Low-Income Single Mothers,” American Economic Review, Vol. 85, 271-275.
Kneller, R.; Bleaney, M. and Gemmell, N. (1998). “Growth, Public Policy and the Government Budget Constraint: Evidence from OECD Countries”. School of Economics, University of Nottingham, Discussion Paper No. 98/14, Nottingham.
Lamo, A. and Strauch, R. (2001). “Fiscal balances and growth,” ECB, mimeo.
Lamo, A. and Strauch, R. (2002). “The Contribution of Public Finances to the European Growth Strategy,” in The impact of Fiscal Policy, ed. Banca d’Italia, 479-519.
Lee, J-W. (1995). “Capital goods imports and long-run growth.” Journal of Development Economics, Vol. 48, 91-110.
Martin, R. and Fardmanesh, M. (1990). “Fiscal variables and growth: A cross-section analysis.” Public Choice, Vol. 64, 239-251.
Martinez-Mongay, C. and Fernandez, R. (2001). “Effective taxation, spending and employment performance,” in Buti, M.; Sestito, P. and Wijkander, H. (eds.), Taxation, welfare and the crisis of unemployment in Europe, Edward Elgar.
Mendoza, E.; Razin, A. and Tesar, L. (1994). “Effective tax rates in macroeconomics: Cross-country estimates of tax rates on factor incomes and consumption,” Journal of Monetary Economics, Vol. 34 (3), 295-602.
Miller, S. and Russek, F. (1997). “Fiscal structures and economic growth: International evidence.” Economic Inquiry, Vol. 35, 603-613.
Nijkamp, P. and Poot, J. (2003). “Meta-Analysis of the Impact of Fiscal Policies on
Long-Run Growth,” March 2003, Tinbergen Institute Discussion Papers 2002-028/3, Amsterdam.
North, D. (1990). Institutions, Institutional Change and Economic Performance (Cambridge: Cambridge University Press).
North, D. (1998). “The Rise of the Western World,” in Bernholz, P., Streit. M. and Vaubel, R. (eds) Political Competition, Innovation and Growth, Berlin, New York: Springer.
Nourzad, F. and Vrieze, M. (1995). “Public Capital Formation and Productivity Growth: Some International Evidence.” Journal of Productivity Analysis, Vol. 6, 283-295.
OECD (1995). Budgeting for Results, Paris, OECD.
OECD (2001). Taxing Wages, 1999/2000, 2000 edition, OECD, April.
OECD (2002). Babies and Bosses, Reconciling Work and Family Life, Vol. 1. Australia, Denmark, the Netherlands, Paris.
OECD (2003a). “Enhancing the Cost Effectiveness of Public Spending,” in Economic Outlook, vol. 2003/02, n. 74, December, OECD.
OECD (2003b). The Sources of Economic Growth in OECD Countries. Paris: OECD.
OECD (2004). Babies and Bosses, Reconciling Work and Family Life, Vol. 2 Austria, Ireland, Japan, Paris.