Screening the effects of emerging
pollutants using embryo bioassays:
triclosan,
methyl-triclosan
and
perfluoroalkyls chemicals.
Ana Sofia Duarte Macedo
TESE DE MESTRADO APRESENTADA
AO INSTITUTO DE CIÊNCIAS BIOMÉDICAS ABEL SALAZAR
DA UNIVERSIDADE DO PORTO EM
TOXICOLOGIA E CONTAMINAÇÃO AMBIENTAIS
ANA SOFIA DUARTE MACEDO
SCREENING THE EFFECTS OF EMERGING POLLUTANTS USING
EMBRYO BIOASSAYS: TRICLOSAN, METHYL-TRICLOSAN AND
PERFLUOROALKYLS CHEMICALS.
Thesis candidature to master’s degree in Environmental Contamination and Toxicology submitted to Abel Salazar Biomedical Institute, University of Porto
Supervisor – Miguel Santos
Category – Assistant Researcher / Invited Assistant Professor
Affiliation – Interdisciplinary Centre of Marine
and Environmental
Research (CIIMAR/CIMAR) / FCUP -
Acknowledgments
First of all, I would like to express my sincere gratitude to my supervisor Dr. Miguel Santos, for the opportunity to perform my master thesis on the EDEC (Endocrine Disruptors and Emergent Contaminants) group in CIIMAR (interdisciplinary center for marine and environmental research). I am grateful for the guidance, patience and motivation when things were not going as planned. Thank you for all the support and readiness to answer to my endless questions.
I owe a huge thanks to my fellow labmates, especially to Ana Capitão, Ana André, Cristina, Aurélie and Ricardo, for all the help, conversations and laughs that made my everyday work easier! To my colleague Tiago, thank you for being not only a labmate but also a friend that comforted me when I needed the most. You made my work amusing, even when things were not going as well. I could not ask for a better “co-supervisor/maestro”.
To my friends Carolina, Mafalda, Bruno, Nelson and all the TCA master class, thank you so much for the lunches, laughs, coffees, shares and outpourings. We made it!
A special thanks to my girls Patrícia, Ana and Diana, for the three amazing years that we shared. I have learned so much about what friendship means with you! All the laughs, long lunches, studying sleepovers… So many memories that I will carry for my life! To all of my older friends, especially to Ana and Catarina, a huge thanks for all the years of trust and sharing.
Abstract
The presence of emerging compounds in the environment is a worldwide concern, not only because of the potential negative impact in human health, but also due to the potential toxicity to non-target organisms. The Personal and Care Products (PCPs) are referred as emerging pollutants since they encompass a major class of compounds detected in the waters, with limited available information on their environmental impact. Within the PCPs class, the disinfectant triclosan (TCS) is one of the most concerning compounds. TCS is an antimicrobial used in many products of our daily life such as toothpastes, shampoos, deodorants or skin care products. It is produced to kill bacteria by blocking the fatty acid synthesis, inhibiting the cell growth. It is a photodegradable compound originating several by-products once in the water systems. One of its metabolites, methyl-triclosan (M-TCS), is known to bioaccumulate and to be resistant to photodegradation. M-TCS has been reported in the aquatic environments, although the information on its (eco)toxicity and mode of action is scarce.
Perfluorinated compounds (PFCs) are another class of emerging chemicals and include de perfluoroalkyls acids (PFAAs) which have been extensively used in the chemical industry. Although some of PFAAs have been banned, i.e., perfluorooctane sulfonate (PFOS) and perfluorooctanoic acid (PFOA), several other homologues have been produced to substitute the formers, i.e., perfluorobutane sulfonate (PFBS) and perfluorobutanoic acid (PFBA). Most of these PFCs are extremely resistant to degradation, accumulating in the organisms and so, there is the need to improve ecotoxicological data.
In this work we aimed to improve the ecotoxicological data of TCS and its metabolite M-TCS and also of several selected PFAAs, i.e, PFOS, PFOA, PFBS, PFBS, PFDA and PFUnA using sea urchin (Paracentrotus lividus) and zebrafish (Danio rerio) embryos as
models for ecotoxicity assessment. We performed bioassays with embryos for 144 hpf (hours-post-fertilization) for zebrafish (early larva) and 48h for sea urchin (larva pluteus
stage).
Resumo
A presença de compostos emergentes no ambiente é um problema a nível mundial, não só por causa do impacto negativo na saúde humana, mas também devido à potencial toxicidade em organismos não-alvo. Os produtos de uso pessoal são referidos como poluentes emergentes já que englobam uma enorme classe de compostos detetados nas águas, para os quais a informação sobre o possível impacto ambiental ainda é limitada. Dentro da classe dos produtos de uso pessoal, o desinfetante triclosan é um dos compostos mais alarmantes. O triclosan (TCS) é um antimicrobiano usado nos mais variados produtos do quotidiano, como as pastas de dentes, shampoos, desodorizantes ou cremes para cuidados da pele. Este composto é produzido para eliminar bactérias, e a sua função é bloquear a síntese de ácidos gordos, inibindo assim o crescimento da célula. Este composto é fotodegradável e uma vez na água pode originar vários subprodutos. Um desses metabolitos, metil-triclosan (M-TCS), é conhecido pela sua capacidade de bioacumulação e resistência à fotodegradação e embora tenha sido detetado nas águas, a informação sobre a sua toxicidade e modo de ação é escassa.
Os compostos perfluorados (PFCs) são outra classe de compostos emergentes, que incluem os ácidos perfluoroalquilos (PFAAs) que têm sido vastamente usados na indústria química. Embora alguns destes compostos tenham sido banidos, como é o caso do ácido perfluorooctano sulfónico (PFOS) e do ácido perfluorooctanoico (PFOA), outros compostos homólogos têm sido produzidos com o intuito de substituir os anteriores, como o ácido perfluorobutano sulfónico (PFBS) e o ácido perfluorobutanoico (PFBA). Grande parte destes compostos perfluorados são extremamente resistentes à degradação, acumulando-se nos organismos e por esse motivo, tem-se verificado uma grande necessidade em melhorar a informação ecotoxicológica destes compostos.
Neste trabalho teve-se como principal objetivo contribuir para a avaliação ecotoxicológica do triclosan, do seu metabolito, metil-triclosan e ainda de vários compostos perfluorados que foram selecionados, como o PFOS, PFOA, PFBS, PFBA, PFDA e o PFUnA, usando embriões de ouriço-do-mar (Paracentrotus lividus) e de peixe-zebra (Danio rerio) como modelos de avaliação ecotoxicológica. Realizaram-se ensaios com embriões
de peixe-zebra até 144 horas pós fertilização (estádio larvar) e até 48 horas pós fertilização para o ouriço-do-mar (estádio de larva pluteus).
Contents
Abstract……..………...……….………...1
Resumo……….………...3
Contents……….………...5
List of Figures………...……….………...….…10
List of Tables………...……….……….….……16
List of Abbreviations and Acronyms……….………...………..…….…....18
Index 1. Introduction ... 19
1.1. Emergent Chemicals of concern in the environment ... 21
1.1.1. Personal Care Products: triclosan (TCS) and methyl-Triclosan (M-TCS) ... 21
1.1.1.1. State of knowledge on triclosan and methyl-triclosan toxicity ... 23
1.1.2. Synthetic chemicals: perfluorinated compounds (PFCs) ... 23
1.1.2.1. Background and applications ... 23
1.1.2.1.1. Perfluorinated compounds properties ... 25
1.1.2.1.2. State of knowledge on the PFAAs selected to the present study ... 26
1.1.2.1.2.1. Perfluorooctane sulfonate (PFOS) and perfluorooctanoic acid (PFOA) ... 26
1.1.2.1.2.2. Perfluorobutane sulfonate (PFBS) and perfluorobutanoic acid (PFBA) ... 29
1.1.2.1.2.3. Perfluorodecanoic acid (PFDA) and perfluoroundecanoic acid (PFUnA) ... 30
1.2. Aim of the study ... 31
2. Materials and Methods ... 33
2.1. Tested chemicals ... 35
2.2. Artificial salt water ... 35
2.3. Test organisms ... 36
2.3.1. Sea urchin (Paracentrotus lividus) ... 36
2.3.1.1. Experimental design ... 37
2.3.2. Zebrafish (Danio rerio) ... 38
2.3.2.1. Experimental design ... 40
2.4. Statistical Analysis ... 42
3.1. Disinfectant Triclosan ... 45
3.1.1. Zebrafish embryos bioassay ... 45
3.1.1.1. Cumulative mortality ... 45
3.1.1.2. Abnormal cell growth ... 45
3.1.1.3. Embryo development delay ... 46
3.1.1.4. Hatching rate ... 46
3.1.1.5. Head and eyes abnormalities ... 47
3.1.1.6. Tail abnormalities ... 48
3.1.1.7. Yolk-sac abnormalities ... 48
3.1.1.8. Pericardial edema ... 49
3.1.1.9. Hemorrhages ... 50
3.1.1.10. Muscular involuntary contractions ... 50
3.1.1.11. Total abnormalities ... 51
3.1.1.12. Heart rate ... 52
3.1.2. Sea urchin embryos bioassay ... 52
3.1.2.1. Larval length and abnormalities ... 52
3.2. Methyl-triclosan ... 54
3.2.1. Zebrafish embryos bioassay ... 54
3.2.1.1. Cumulative mortality ... 54
3.2.1.2. Abnormal cell growth ... 55
3.2.1.3. Embryo development delay ... 55
3.2.1.4. Hatching rate ... 56
3.2.1.5. Head and eyes abnormalities ... 56
3.2.1.6. Tail abnormalities ... 57
3.2.1.7. Yolk-sac abnormalities ... 57
3.2.1.8. Pericardial edema and hemorrhages... 58
3.2.1.9. Muscular involuntary contractions ... 59
3.2.1.10. Total abnormalities ... 59
3.2.2. Sea urchin embryos bioassay ... 61
3.2.2.1. Larval length and abnormalities ... 61
3.3. Perfluorooctane sulfonate (PFOS) ... 62
3.3.1. Zebrafish embryos bioassay ... 62
3.3.1.1. Cumulative mortality ... 62
3.3.1.2. Abnormal cell growth and embryo development delay ... 62
3.3.1.3. Hatching rate ... 63
3.3.1.4. Head abnormalities ... 63
3.3.1.5. Eyes abnormalities ... 63
3.3.1.6. Tail and yolk-sac abnormalities ... 64
3.3.1.7. Pericardial edema and hemorrhages ... 64
3.3.1.8. Muscular involuntary contractions ... 64
3.3.1.9. Total abnormalities and heart rate ... 65
3.3.2. Sea urchin embryos bioassay ... 65
3.3.2.1. Larval length and abnormalities ... 65
3.4. Perfluorooctanoic acid (PFOA) ... 67
3.4.1. Zebrafish embryos bioassay ... 67
3.4.2. Sea urchin embryos bioassay ... 67
3.4.2.1. Larval length and abnormalities ... 67
3.5. Perfluorobutane sulfonate (PFBS)... 69
3.5.1. Zebrafish embryos bioassay ... 69
3.5.2. Sea urchin embryos bioassay ... 69
3.5.2.1. Larval length and abnormalities ... 69
3.6. Perfluorobutanoic acid (PFBA) ... 71
3.6.1. Zebrafish embryos bioassay ... 71
3.6.2. Sea urchin embryos bioassay ... 71
3.6.2.1. Larval length and abnormalities ... 71
3.7. Perfluorodecanoic acid (PFDA) ... 72
3.7.1.1. Cumulative mortality ... 72
3.7.1.2. Abnormal cell growth and embryo development delay ... 72
3.7.1.3. Hatching rate ... 73
3.7.1.4. Head and eyes abnormalities ... 73
3.7.1.5. Tail and yolk-sac abnormalities ... 73
3.7.1.6. Pericardial edema and hemorrhages... 74
3.7.1.7. Muscular involuntary contractions ... 75
3.7.1.8. Total abnormalities and heart rate ... 75
3.7.2. Sea urchin embryos bioassay ... 76
3.7.2.1. Larval length and abnormalities ... 76
3.8. Perfluoroundecanoic acid (PFUnA) ... 77
3.8.1. Zebrafish embryos bioassay ... 77
3.8.1.1. Cumulative mortality ... 77
3.8.1.2. Abnormal cell growth and embryo development delay ... 77
3.8.1.3. Early hatching and hatching rate ... 78
3.8.1.4. Head and eyes abnormalities ... 78
3.8.1.5. Tail and yolk-sac abnormalities ... 79
3.8.1.6. Pericardial edema and hemorrhages... 79
3.8.1.7. Muscular involuntary contractions ... 80
3.8.1.8. Total abnormalities and heart rate ... 80
3.8.2. Sea urchin embryos bioassay ... 81
3.8.2.1. Larval length and abnormalities ... 81
4.Discussion... 83
5.Conclusion and future perspectives ... 93
List of Figures
Figure 1 - Chemical structure of TCS and its methylation by-product M-TCS. ... 22
Figure 2 - Environmental fate of Perfluorinated compounds. ... 24
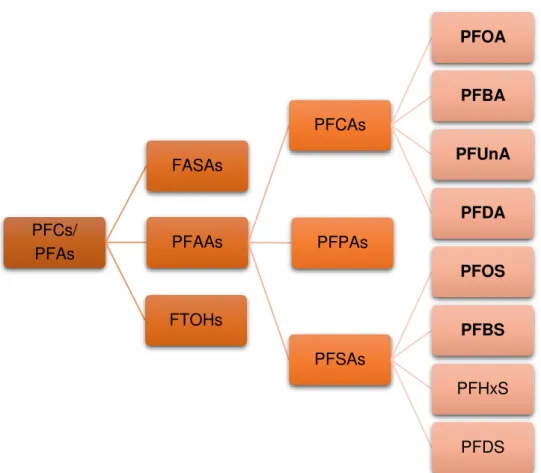
Figure 3 - Some examples of Perfluorinated compounds. In bold are the Perfluoroalkyls acids selected for the present work. ... 25
Figure 4 - Perfluorooctane sulfonate (PFOS) chemical structure. ... 26
Figure 5 - Chemical formula of PFAAs.. ... 27
Figure 6 - Perfluorooctanoic acid (PFOA) chemical structure. ... 27
Figure 7 - Perfluorobutane sulfonate (PFBS) and Perfluorobutanoic acid (PFBA) chemical structures. ... 29
Figure 8 - Perfluorodecanoic acid (PFDA) chemical structure. ... 30
Figure 9 – Perfluoroundecanoic acid (PFUnA) chemical structure. ... 31
Figure 10 - Sea urchin (Paracentrotus lividus). ... 36
Figure 11 - (A) Sea urchin adults dissected (male and female, respectively). (B) Sea urchin eggs post fertilization. ... 37
Figure 12 - Experimental design for sea urchin bioassay.. ... 38
Figure 13 – Zebrafish (Danio rerio). ... 39
Figure 14 – Representation of zebrafish breading box. ... 40
Figure 15 – Experimental design for zebrafish bioassay. ... 41
Figure 16 – Zebrafish embryonic development.. ... 41
Figure 17- Cumulative mortality rates (%) of D. rerio exposed to different concentrations of the disinfectant Triclosan for 144 h in the first assay (A) and second assay (B). ... 45
Figure 19 - Embryo development delay at 32 hpf (%) of D. rerio exposed to different
concentrations of the disinfectant Triclosan for 144 h. ...46
Figure 20 - Hatching rate at 80 hpf (%) of D. rerio exposed to different concentrations of
the disinfectant Triclosan for 144 h in the first assay (A) and second assay (B).. ...47
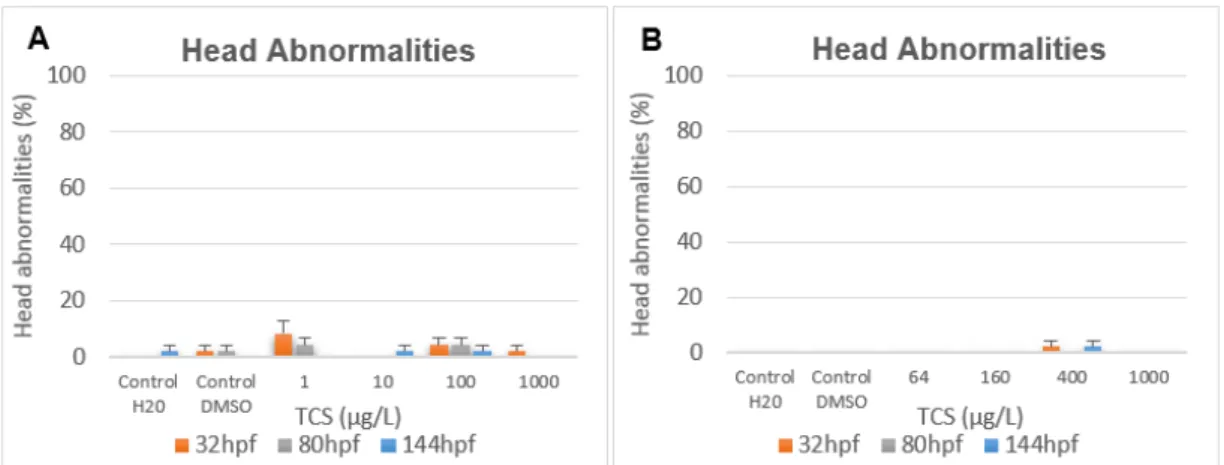
Figure 21 - Head abnormalities (%) of D. rerio exposed to different concentrations of the
disinfectant Triclosan for 144 h in the first assay (A) and second assay (B). ...47
Figure 22 - Eyes abnormalities (%) of D. rerio exposed to different concentrations of the
disinfectant Triclosan for 144 h in the first assay (A) and second assay (B). ...48
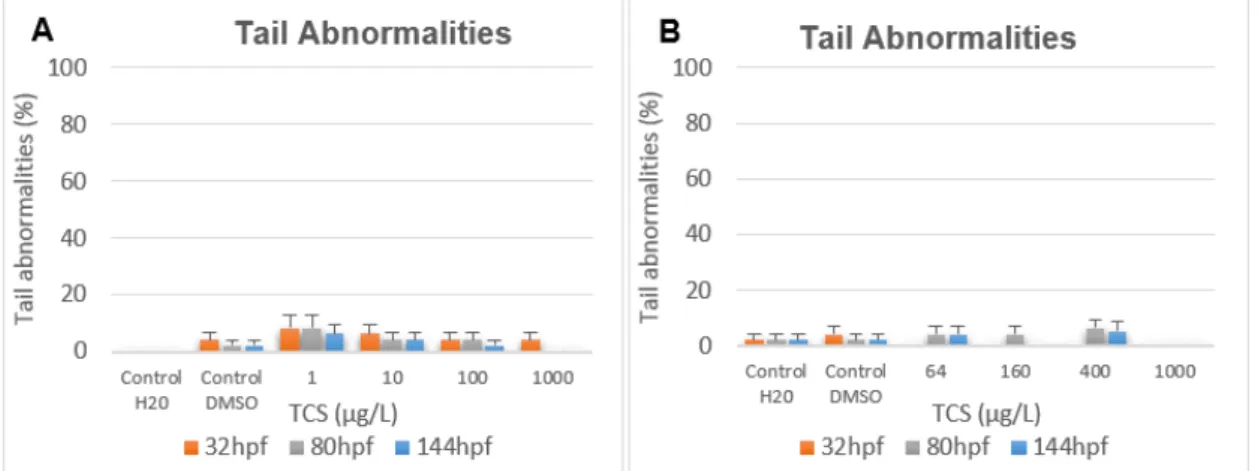
Figure 23 - Tail abnormalities (%) of D. rerio exposed to different concentrations of the
disinfectant Triclosan for 144 h in the first assay (A) and second assay (B). ...48
Figure 24 - Yolk-sac abnormalities (%) of D. rerio exposed to different concentrations of the
disinfectant Triclosan for 144 h in the first assay (A) and second assay (B). ...49
Figure 25 - Pericardial edema abnormalities (%) of D. rerio exposed to different
concentrations of the disinfectant Triclosan for 144 h in the first assay (A) and second assay (B). ...49
Figure 26 - Hemorrhages (%) of D. rerio exposed to different concentrations of the
disinfectant Triclosan for 144 h in the first assay (A) and second assay (B). ...50
Figure 27 - Muscular involuntary contractions at 144 hpf (%) of D. rerio exposed to different
concentrations of the disinfectant Triclosan for 144 h in the first assay (A) and second assay (B).. ...50
Figure 28 - Total abnormal embryos (%) of D. rerio exposed to different concentrations of
the disinfectant Triclosan for 144 h in the first assay (A) and second assay (B). ...51
Figure 29 - D. rerio at 144 hpf in the control group (A) and exposed to 400 µg/L of the
disinfectant Triclosan (B). The black arrows point the malformations on embryos’ yolk-sac and pericardial edemas. ...51
Figure 30 - Heart rate (bpm) of D. rerio exposed to different concentrations of the
disinfectant Triclosan for 144 h in the first assay (A) and second assay (B). ...52
Figure 31 - Larval length (µm) and abnormalities rate (%) of P. lividus (A and B,
Figure 32 –P. lividus at 48 hpf in the control group (A), and exposed to 400 µg/L (B) and
1000 µg/L of triclosan. ... 53
Figure 33 - Cumulative mortality rates (%) of D. rerio exposed to different concentrations
of methyl –triclosan for 144 h in the first assay (A) and second assay (B). ... 54
Figure 34 - Abnormal cell growth at 8 hpf (%) of D. rerio exposed to different concentrations
of methyl-triclosan for 144 h in the first assay (A) and second assay (B). ... 55
Figure 35 - Embryo development delay at 32 hpf (%) of D. rerio exposed to different
concentrations of methyl-triclosan for 144 h in the first assay (A) and second assay (B).. 55
Figure 36 - Hatching rate at 80 hpf (%) of D. rerio exposed to different concentrations of
methyl-triclosan for 144 h in the first assay (A) and second assay (B). ... 56
Figure 37 - Head and eyes abnormalities (%) of D. rerio exposed to different concentrations
of the disinfectant Triclosan for 144 h in the first assay (A) and second assay (B). ... 56
Figure 38 - Tail abnormalities (%) of D. rerio exposed to different concentrations of
methyl-triclosan for 144 h in the first assay (A) and second assay (B). ... 57
Figure 39 - Yolk-sac abnormalities (%) of D. rerio exposed to different concentrations of
methyl-triclosan for 144 h in the first assay (A) and second assay (B). ... 57
Figure 40 –Pericardial edema (%) of D. rerio exposed to diferent concentrations of
methyl-triclosan for 144 hpf in the first assay (A) and second assay (B). ... 58
Figure 41 - Hemorrhages (%) of D. rerio exposed to different concentrations of
methyl-triclosan for 144 hpf in the first assay (A) and second assay (B). ... 58
Figure 42 - Muscular involuntary contractions (%) of D. rerio exposed to different
concentrations of methyl-triclosan for 144 h in the first assay (A) and second assay (B). 59
Figure 43 - Total abnormal embryos (%) of D. rerio exposed to different concentrations of
methyl-triclosan for 144 h in the first assay (A) and second assay (B). ... 59
Figure 44 - D. rerio at 144 hpf in the control group (A), exposed to 400 µg/L (B) and 1000
µg/L (C) of methyl-triclosan. The black arrows point the embryos malformations. ... 60
Figure 45 - Heart rate (bpm) of D. rerio exposed to different concentrations of
Figure 46 - Larval length (µm) and abnormalities rate (%) of P. lividus (A and B,
respectively) exposed to different concentrations of methyl-triclosan for 48h. ...61
Figure 47 –P. lividus at 48 hpf in the control group (A) and exposed to 1000 µg/L of
methyl-triclosan (B). ...61
Figure 48 - Cumulative mortality rates (%) of D. rerio exposed to different concentrations
of PFOS for 144 h. ...62
Figure 49 - Abnormal cell growth at 8 hpf and embryo development delay at 32 hpf (%) of D. rerio exposed to different concentrations of PFOS for 144 h (A and B, respectively). ..62
Figure 50 - Hatching rate at 80 hpf (%) of D. rerio exposed to different concentrations of
PFOS for 144 h ...63
Figure 51 - Head abnormalities (%) of D. rerio exposed to different concentrations of PFOS
for 144 h. ...63
Figure 52 -Tail and yolk-sac abnormalities (%) of D. rerio exposed to different
concentrations of PFOS for 144 h (A and B, respectively). ...64
Figure 53 - Pericardial edema and hemorrhages (%) of D. rerio exposed to different
concentrations of PFOS for 144 h (A and B,respectively). ...64
Figure 54 - Total abnormal embryos (%) and heart rate (bpm) of D. rerio exposed to
different concentrations of PFOS for 144 h.. ...65
Figure 55 - Larval length (µm) and abnormalities rate (%) of P. lividus (A and B,
respectively) exposed to different concentrations of PFOS for 48h. ...65
Figure 56 - Larval length (µm) and abnormalities rate (%) of P. lividus (A and B,
respectively) exposed to different concentrations of PFOA for 48h. ...66
Figure 57 - Larval length (µm) and abnormalities rate (%) of P. lividus (A and B,
respectively) exposed to different concentrations of PFBS for 48h. ...68
Figure 58 - Larval length (µm) and abnormalities rate (%) of P. lividus (A and B,
respectively) exposed to different concentrations of PFBA for 48h. ...70
Figure 59 - Cumulative mortality rates (%) of D. rerio exposed to different concentrations
Figure 60 - Abnormal cell growth at 8 hpf and embryo development delay at 32 hpf (%) of D. rerio exposed to different concentrations of PFDA for 144 h (A and B, respectively). .. 72
Figure 61 - Hatching rate at 80 hpf (%) of D. rerio exposed to different concentrations of
PFDA for 144 h (A and B, respectively). ... 73
Figure 62 - Tail and yolk-sac abnormalities (%) of D. rerio exposed to different
concentrations of PFDA for 144 h (A and B, respectively). ... 74
Figure 63 –D. rerio embryos at 144 hpf exposed to 10000 µg/L of PFDA. The black arrow
points the abnormal embryo, exhibiting spinal curvature. ... 74
Figure 64 - Pericardial edema and hemorrhages (%) of D. rerio exposed to different
concentrations of PFDA for 144 h (A and B, respectively). ... 75
Figure 65 – Total abnormal embryos (%) and heart rate (bpm) of D. rerio exposed to
different concentrations of PFDA for 144 h (A and B, respectively).. ... 75
Figure 66 - Larval length (µm) and abnormalities rate (%) of P. lividus (A and B,
respectively) exposed to different concentrations of PFDA for 48h. ... 76
Figure 67 - Cumulative mortality rates (%) of D. rerio exposed to different concentrations
of PFUnA for 144 h. ... 77
Figure 68 - Abnormal cell growth at 8 hpf and embryo development delay at 32 hpf (%) of D. rerio exposed to different concentrations of PFUnA for 144 h (A and B, respectively). 77
Figure 69 –Early hatching at 24 hpf and hatching rate at 80 hpf (%) of D. rerio exposed to
different concentrations of PFUnA for 144 h (A and B, respectively).. ... 78
Figure 70–D. rerio embryos at 32 hpf exposed to 10000 µg/L of PFUnA. The black arrow
points the early hatched embryo. ... 78
Figure 71 - Head abnormalities (%) of D. rerio exposed to different concentrations of PFUnA
for 144 h. ... 79
Figure 72 - Tail and yolk-sac abnormalities (%) of D. rerio exposed to different
concentrations of PFUnA for 144 h (A and B, respectively). ... 79
Figure 73 - Pericardial edema and hemorrhages (%) of D. rerio exposed to different
Figure 74 - Total abnormal embryos (%) and heart rate (bpm) of D. rerio exposed to
different concentrations of PFUnA for 144 h (A and B, respectively). ...80
Figure 75 - Larval length (µm) and abnormalities rate (%) of P. lividus (A and B,
respectively) exposed to different concentrations of PFUnA for 48h. ...81
Figure 76 - P.lividus at 48 hpf in the control group (A) and exposed to 1000 µg/L of PFUnA
List of Tables
Table 1 –Referencesof the chemicals tested. ... 35
Table 2 - Artificial seawater composition. ... 35
Table 3 - Effects of PFOA exposure in zebrafish embryos at 144 hpf. Data are expressed
as mean ± se (n=8). ... 67
Table 4 - Effects of PFBS exposure in zebrafish embryos at 144 hpf. Data are expressed
as mean ± SE (n=8). ... 69
Table 5 - Effects of PFBA exposure in zebrafish embryos at 144 hpf. Data are expressed
as mean ± SE (n=8). ... 71
Table 6 – Overview of the overall results, highlighting the significant effects (p<0.05) on
both model embryo bioassays, for each compound. ... 82
Table 7 - Overview of the NOECs and LOECs reported in this study (µg/L). ... 82
Table 8 – Comparison of the LOEC values reported on this study and maximal
List of Abbreviations and acronyms
µg Microgram
bpm Beats Per Minute
CECs Contaminants of Emerging Concern
DMSO Dimethylsulfoxide
EC50Effect Concentration for 50% of the population
ECF Electrochemical fluorination
g Gram
hpf Hours Post Fertilization
LC50Lethal Concentration for 50% of the population
LOEC Lowest Observed Effect Concentration
log Koc Soil Organic Carbon-Water Partition Coefficient
log Kow Octanol-Water Partition Coefficient
mg Milligram
M-TCS Methyl-triclosan
ng Nanogram
NOEC No Observed Effect Concentration
OECD Organization for Economic and Co-operation and Development
PCP Personal Care Products
PFAAs Perfluoroalkyls Acids
PFBA Perfluorobutanoic acid
PFBS Perfluorobutanesulfonic acid
PFCAs Perlfuoroalkyls carboxyls Acids
PFCs Perfluorinated Compounds
PFDA Perfluorodecanoic acid
PFOS Perfluorooctane Sulfonate
PFPAs Perfluoroalkyls Phosphonates Acids
PFSAs Perfluoroalkyl Sulfonates Acids
PFUnA Perfluoroundecanoic acid
TCS Triclosan
U.S. EPA United States Environmental Protection Agency
VP Vapor Pressure
INTRODUCTION AND
OBJECTIVES
1. Introduction
1.1. Contaminants of emerging concern (CECs) in the environment
Nowadays it is acknowledged that the Wastewater Treatment Plants (WWTP) stations are not fully efficient when it comes to the removal of compounds present in the waters. Hence, a large group of chemicals will ultimately reach the aquatic environment. Although most of these chemicals are present at low concentrations, there is a paucity of data on the effects of low exposure doses and mixture effects, thus sorting them as emerging contaminants.
The term “emerging” is applied to compounds present in the waters on which very
little is known about potential impact in the environment (Deblonde et al., 2011). Moreover,
data on its toxicity and potential risk is scarce or still unknown. Such chemicals have been a worldwide concern, not only for human health but also for the ecosystems.
1.1.1. Personal and care products: triclosan (TCS) and methyl-mriclosan (M-TCS)
metabolite
The so called Personal Care Products (PCPs) are one of the groups that raise major concerns since it encompasses a large number of compounds that are produced for external use. The increase use of PCPs together with the inefficiency of the WWTP stations to complete removal of some of these chemicals, has been rising the levels of these compounds in the environment. Hence, an increase number of studies focus on their occurrence in the water systems. Yet, there is a lack of knowledge about its toxicity to non-target organisms (Brausch and Rand, 2011).
This is the case for the disinfectant triclosan (TCS) (Figure 1) which has been in use for over 40 years (Dann and Hontela, 2011; Pintado-Herrera et al., 2014) in the most varied
toiletries such as toothpaste, soaps, skin care products and also in many other industries as textile and plastic industries (Bedoux et al., 2012; Rüdel et al., 2013).
As reviewed in 2011 by Brauch and Rand, this disinfectant in one of the most detected compounds in the WWTP, although there is still a lack of data on possible effects in non-targeted organisms and the underlying mechanism(s) of action. Hence, there is a need to improve risk assessment of this compound.
of the surface waters analyzed (Brausch and Rand, 2011) including in Portugal (Lygina et al., 2013).
Triclosan is an organochlorine compound and due to its chemical properties, bioacumulates (Figure 1). Once entering the WWTP stations, triclosan can be chemically transformed, resulting mostly chlorophenols (Bedoux et al., 2012) or biologically
transformed, being metabolized into a more persistent, lipophilic and non-photodegradable byproduct known as methyl-triclosan (M-TCS) (Figure 1) (Balmer et al., 2004; Heidler and
Halden, 2007; Bedoux et al., 2012). As reviewed by Bedoux in 2012, M-TCS can be
produced in major quantities when biodegradation of TCS occurs in soil.
Regarding TCS and M-TCS occurrence in the water systems it is known that the metabolite is much less prevalent than the parental compound. While TCS concentrations in surface waters where detected up to 22 µg/L in treated water in Spain (Agüera et al.,
2003), or even more recently up to 5,16 µg/L in Vellar, India (Ramaswamy et al., 2011),
M-TCS has been detected up to 190 ng/L in Cadiz, Spain (Pintado-Herrera et al., 2014).
Although its occurrence is much less noticed, its hydrophobic characteristics and persistence in the environment along with the scarcity of data, highlights the need for additional research on its ecotoxicity.
Figure 1 - Chemical structure of TCS and its methylation by-product M-TCS.
Source: CSID:5363, http://www.chemspider.com/Chemical-Structure.5363.html (accessed 21:58, May 11, 2015); CSID:545009, http://www.chemspider.com/Chemical-Structure.545009.html (accessed 21:57, May 11, 2015).(1)Boehmer et al., 2004; (2)Ying et al.,
2007; (3)Chen et al., 2011. TCS
C12H7Cl3O logKow: 4.7(1)
VP: 4.65x10⁻⁶ mmHg(2)
M-TCS
C13H9Cl3O2 logKow: 5.2(1)
1.1.1.1. State of knowledge on triclosan and methyl-triclosan toxicity
Many studies have been conducted in order to better understand the mechanism of action and the No Observed Effect Concentration (NOEC) of this bactericide. In
Scenedesmus vacuolatus, triclosan inhibited cell reproduction at 1.9 µg/L (Franz et al.,
2008). A recent study with the sea urchin Strongylocentrotus nudus, showed that triclosan
affected reproduction and embryonic development of pluteus larva at 113 µg/L (Hwang et al., 2014). On zebrafish, triclosan was lethal to 50% of the embryos at 420 µg/L (Oliveira et al., 2009) and significantly decreased heart rate of embryos at 20 ng/L and at 100 µg/L
(Schmidt et al., 2013). Also in Japanese medaka, an 8 days exposure to triclosan at
0.17mg/L, decreased the swimming velocity of the fish (Nassef et al., 2010).
Gaume et al. (2012), in an in vivo study showed that not only TCS had an inhibiting
effect on cells but also M-TCS reveled to be toxic to hemocytes of Haliotis tuberculata, at
low concentration range. Other studies have been conducted on M-TCS toxicity on algae (Batscher, 2006b) and bacteria (Farré et al., 2008; Villa et al., 2014) and only one conducted
on the invertebrate Daphnia magna (Batscher, 2006a). To our knowledge, no other studies
have been reported on aquatic organisms.
Taking all these data into account, there is the need for research on this subject, especially on M-TCS toxicity. Given the sensitivity of the embryonic development of model fish zebrafish (Danio rerio) and the invertebrate sea urchin (Paracentrotus lividus) to a range
of contaminants, including TCS, make them ideal models to investigate the toxicity of TCS and M-TCS.
1.1.2. Synthetic chemicals: perfluorinated compounds (PFCs)
1.1.2.1. Background and applications
Perfluorinated compounds (PFCs) are synthetic chemicals produced by electrochemical fluorination (ECF) or telomerization and have been used for over 60 years (Simcik, 2005; Lindstrom et al., 2011; Lau, 2012). They encompass a large number of
chemicals useful in the most varied industries, mainly in textile industries where they are used as repellants for carpets or clothes (Ulhaq et al., 2013a). Moreover they can be used
as surfactants and lubricants, in paints, fire-fighting foams, food packaging, floor polishes, in some products of personal care such as shampoos, cosmetics and also as pesticides, among many others (Lindstrom et al., 2011).
by 2010 and complete elimination by 2015 (US EPA, 2009). Given that in 2010 some PFCs were discontinued (Hagenaars et al., 2011), other homologues with shorter carbon chains
have been used in large quantities as alternative and have been released to the environment. Although some studies revealed that these new homologues have low adsorption potential, they seem to be very persistent and more mobile than the original ones (Zhou et al., 2013).
Non-target organisms are continuously exposed to these chemicals which are discharged in the waters through WWTPs (Ulhaq et al., 2013) (Figure 2). Very limited data
is available concerning the potential impact of some of these new derivatives to the ecosystems and so it is urgent to deepen knowledge on this subject.
The PFCs class encompass a large number of sub-classes. Perfluoroalkyls acids (PFAAs) belong to the PFCs class and include about 30 environmentally relevant chemicals (Lau, 2012). There are 5 different subfamilies within the PFAAs, distinguished by their functional group which can be a carboxylic, sulfonic, phosphonic, sulfinic or phosphinic acid (Schedin, 2013).The main sub-families which have gained more attention are the Perfluoroalkyl sulfonates acids (PFSAs) and Perlfuoroalkyls carboxyls acids (PFCAs) and more recently the Perfluoroalkyls phosphonates acids (PFPAs) (Figure 3) (Lau et al., 2012).
Production and usage of PFC products WWTPs Sludge Landfill River Soil Plants Aquatic animals Ocean Groundwater Land animals Sediment Air Humans
1.1.2.2. PFCs chemical properties
Perfluorinated compounds are organic substances whose structure usually consists in a (4 - 14) carbon chain where all hydrogen molecules in the carbon chain were substituted with fluorines (Figure 4). They are extremely chemically stable due to their strong carbon-fluorine bonds. Their distinctive hydrophobic and lipophobic properties allow them to repel oil and water (Lau et al., 2007). Also, they are nonflammable, non-reactive, and hardly
degraded, possibly bioaccumulating and consequently persisting in the environment (Lindstrom et al., 2011). Furthermore, some of these substances have long-range transport
in the waters due to their ionic nature (Sinclair and Kannan, 2006), and so, after discharges, the PFCs can easily reach rivers, soils, ground waters, oceans, and consequently affect the aquatic and land life, including humans (Figure 2).
Figure 3 - Some examples of Perfluorinated compounds. In bold are the Perfluoroalkyls acids selected for the present work.
1.1.2.3. State of knowledge on the PFAAs selected for the present study
Perfluoroalkyls acids (PFAAs) is the main group responsible for studies conducted on Perfluorinated compounds distribution, occurrence or toxicity. They are extensively used, mostly due to their unique chemical properties.
They have been classified as chemicals of concern and after the decreased production of PFOA and PFOS, several other substitutes have been released in large quantities to the environment (Lau, 2012).
One of the main problems is the possibility of increased toxicity of these chemicals when in mixture. In 2002, after an accidental release of fire-fighting foam in Canada, the PFCs concentration in the surface waters reached up to 17mg/L (Moody et al., 2002).
Moreover, in west coast of Korea in 2012, concentrations of several PFAAs from the estuarine and coastal area were detected up to 130 ng/L (Hong et al., 2015). In China, the
total concentrations of PFAAS was measured, reaching values of 70.4 µg/L (Zhou et al.,
2013).
Some long-chained PFAAs (e.g. PFOS) have a high potential for bioaccumulation and biomagnification along the trophic chain (Kannan et al., 2005; Hong et al., 2015).
Furthermore, PFAAs are usually extremely resistant to high temperatures, photolysis or even microorganisms, due to their strong fluorine-carbon chain (Schedin, 2013). Figure 5 displays the perlfuoroalkyl compounds chemical formula.
Regarding their distribution, PFAAs are ubiquitous in the environment, being already found in some remote areas such as the Artic or in Antarctica (Butt et al., 2010; Benskin et al., 2012; Cai et al., 2012). Lau (2012) reviewed two possibilities for PFAAs worldwide
distribution: atmospheric transport of PFAAs or simply a long-range transport of the PFAAs along the water systems, thus reaching isolated areas.
Figure 4 - Perfluorooctane sulfonate (PFOS) chemical structure.
Source: CSID:67068, http://www.chemspider.com/Chemical-Structure.67068.html (accessed 12:04, May 20, 2015). (1)Higgins and Luthy, 2006; (2)3M, 2008c.
PFOS
C8HF17O3S logKoc: 2.57 ± 0.13 L/kg(1)
1.1.2.3.1. Perfluorooctane sulfonate (PFOS) and perfluorooctanoic acid
(PFOA)
Perfluorooctane sulfonate (PFOS) (Figure 4) and Perfluorooctanoic acid (PFOA) (Figure 6) are an 8 carbon long chained PFAAs, with a sulphonic and carboxylic acid as function group, respectively. In industry they were used mainly as byproducts of other fluorochemicals (Simcik, 2005).
They gained much attention due to their useful characteristics and so, countless studies were conducted on their occurrence and toxicity. Regarding their occurrence in surface waters, before regulation, PFOA concentrations ranged from <25 to 598 ng/L while PFOS ranged from 16.8 to 144 ng/L in Tennessee (Hansen et al., 2002). In Japan, PFOA
and PFOS concentrations reached up to 67000 and 526 ng/L, respectively (Nakayama et al. 2004).
Although their producing has been reduced after regulation, their bioaccumulative and persistent properties still raise concern on its possible impact in the organisms. Houde
et al. (2011) reviewed that PFOS was still the major PFC found in animal tissues.
Furthermore, PFOS and PFOA were found in artic species tissues, evidencing their worldwide distribution (Butt et al., 2010).
More recently, in Liaoning, China, concentrations up to 31 and 82 ng/l of PFOS and PFOA, respectively, where detected in surface waters (Wang et al., 2012). Also, in Tangxun
Lake, China, concentrations of PFOS and PFOA in surface waters of up to 21.3 and 26.3 µg/L, respectively (Zhou et al., 2013).
Figure 6 - Perfluorooctanoic acid (PFOA) chemical structure.
Source: CSID:9180, http://www.chemspider.com/Chemical-Structure.9180.html (accessed 12:02, May 20, 2015). (1)Dekleva, 2003; (2)Bhhatarai and Gramatica,
2010.
PFOA
C8HF15O2
logKoc: 1.31-2.35 L/kg(1)
VP: -1.04 mmHg(2)
Figure 5 - Chemical formula of PFAAs. n– number of carbon
Regarding toxicity studies on these two chemicals, several studies have been conducted recently on zebrafish embryos (Shi et al., 2008; Huang et al., 2010; Hagenaars et al., 2011; Zheng et al., 2012; Ding et al., 2013; Ulhaq et al., 2013a,b; Hagenaars et al.,
2014). PFOS appears to be more toxic than PFOA possibly due to the presence of a sulphonic functional group (Zheng et al., 2012; Ulhaq et al., 2013a). Hagenaars et al. (2011)
detected an increase in the fish heart rate above 0.5 mg/L for PFOS and above 75 mg/L for PFOA, with a significant decrease at 250 mg/L. Furthermore, PFOA significantly delayed hatching above 100 mg/L. In Zheng et al. (2012) study, PFOS Lowest Observed Effect
Concentration (LOEC) for malformations on zebrafish embryos was established at 12.5 mg/L and at 6.5 mg/L for hatching delay at 72 hpf.
Moreover, PFOS along with perfluorobutane sulfonate (PFBS) and Perfluorodecanoic acid (PFDA)seemed to increase swimming speed of zebrafish larvae in comparison with other PFAAs (Ulhaq et al., 2013b). More recently, PFOS significantly
reduced the swim bladder, caused spinal curvature and reduced zebrafish larvae length above 2.5 mg/L (Hagenaars et al., 2014).
Concerning studies on invertebrates, PFOA exposure during 48h had an Effect Concentration on 50% of Daphnia magna and Chydorus sphaericus population (EC50) at
211.6 and 348.7 mg/L, respectively (Ding et al., 2012).
Sea urchin embryos have also been used as ecotoxicological models for studying the effects of some PFCs (Anselmo et al., 2011; Mhadhbi et al., 2012; Gunduz et al., 2013). Paracentrotus lividus seems to be relatively sensitive to these particular compounds,
showing an increasing number of malformations on the larvae above 0.5 mg/L of PFOS (Gunduz et al., 2013) and a LOEC for PFOS and PFOA of 2 and 20 mg/L, respectively
(Mhadhbi et al., 2012). Moreover, Anselmo et al., 2011 detected a slight acceleration on
larvae development 9 days post-fertilization (dpf) at 371.6 µg/L.
The fact that the potential for bioaccumulation of PFAAs in costal organisms has not been study in detail (Hong et al., 2015) along with the lack of data on the potential toxicity
to marine species (Mhadhbi et al., 2012; Gunduz et al., 2013) make this subject of concern.
All these previous studies were conducted with concentrations above environmental relevance. However, since these chemicals are extremely stable and not easily degraded in the environment (Lindstrom et al., 2011), they may bioaccumulate, hence it is urgent to
1.1.2.3.2. Perfluorobutane sulfonate (PFBS) and perfluorobutanoic acid
(PFBA)
The short-chained perfluorobutane sulfonate (PFBS) and perfluorobutanoic acid (PFBA) have a skeleton constituted by 4 carbons and have been considered the main substitutes of PFOS and PFOA, respectively (Figure 7). Their toxicity seems to be much less noticed due to their short carbon chain length (Shi et al., 2008; Hagenaars et al., 2011;
Zheng et al., 2012). Yet, due to their exponential production increase, they are much more
prevalent than PFOS and PFOA (Zhou et al., 2013), although the information on their
potential toxicity is not well established.
In river Rhine the concentrations of PFCs were measured and PFBA was dominant, reaching concentrations up to 335 ng/L followed by PFBS at 181 ng/L (Möller et al., 2010).
In China, concentration of PFBA and PFBS were prevailing, reaching up to 47.8 and 15.3 µg/L, respectively (Zhou et al., 2013).
Concerning toxicity assessment, it is known that these chemicals are not as toxic as the long-chained PFAAs. A study conducted on zebrafish embryos found an EC50 of 450 mg/L and 2200 mg/L for PFBS and PFBA, respectively (Ulhaq et al., 2013a). Moreover,
PFBS showed reduced zebrafish heart rate at 3000 mg/L (Hagenaars et al., 2011).
In Daphnia magna the EC50 at 48h for PFBA was reached at a concentration of 181.5
mg/L. As for Chydorus sphaericus, the EC50 value for PFBA was only reached at 462.3
mg/L (Ding et al., 2012).
PFBA and PFBS growing discharges in the environment along with their great mobility throughout the water systems is concerning. The fact that there is still a massive lack of data on the potential toxicity of these new substitutes on marine organisms makes urgent a detailed toxicity screening.
Figure 7 - Perfluorobutane sulfonate (PFBS) and Perfluorobutanoic acid (PFBA) chemical structures.
Sources: PFBS: CSID:61132, http://www.chemspider.com/Chemical-Structure.61132.html (accessed 12:15, May 20, 2015). PFBA: http://www.chemspider.com/Chemical-Structure.9394.html (accessed 12:14, May 20, 2015). (1)Wang et al., 2011; (2)Bhhatarai and Gramatica, 2010.
PFBS
C4HF9O3S logKow, dry: 2.82(1)
VP: 2.80 Pa(1)
PFBA
C4HF7O2 logKow,dry: 3.90(1)
1.1.2.3.3. Perfluorodecanoic acid (PFDA) and perfluoroundecanoic acid
(PFUnA)
Perfluorodecanoic acid (PFDA) (Figure 8) and perfluoroundecanoic acid (PFUnA) (Figure 9) are a 10 and 11-carbon chain perfluorocarboxylates (PFCAs), respectively. They are widely used in manufacturing of fluorinated polymers (Prevedouros et al., 2006).
Concerning their occurrence, it is known that these two PFAAs are much less prevalent in the waters in comparison with the previous four PFAAs. In Shenyan, China, PFUnA and PFDA were detected in Donghou River at 1.2 and 0.66 ng/L, respectively (Sun et al., 2011).
Also in Touchien, Taiwan, PFDA was found in concentrations of up to 58.2 ng/L (Lin et al.,
2009). Furthermore, concentrations of up to 15.4 and 3.52 ng/L were detected in west coast of Korea for PFDA and PFUnA, correspondingly (Naile et al., 2010). Moreover, PFDA was
found up to 160 ng/L in Conasauga River, USA (Knowick et al., 2008) and more recently up
to 1.2 ng/L in Australia (Thompson et al., 2011).
As mentioned before, Ding et al., 2012 assessed the toxicity of several
Perfluorinated compounds on Dapnia magna and Chydorus sphaericus during 48h. In D. magna, a fifty percent inhibition effect at 163.5 mg/L for PFDA and 133.13 mg/L for PFUnA
were reported. In Chydorus sphaericus, the fifty percent inhibition effect was detected at
45.2 mg/L for PFDA and 19.2 mg/L for PFUnA. This compounds show greater toxicity in comparison with PFBS and PFBA, possibly due to their longer C-F chains. To our knowledge, this is the only study assessing PFUnA toxicity in aquatic organisms.
As long-chained compounds, there is propensity to become more bioaccumulative in the organisms (Lindstrom et al., 2011). However, there is a massive lack when it comes
to their potential impact in the environment (Jo et al., 2014). Some studies revealed that
PFDA is in the range of PFOS toxicity (Ulhaq et al., 2013a). Yet, toxicity data on these two
compounds is very limited.
Figure 8 - Perfluorodecanoic acid (PFDA) chemical structure.
Source: CSID:9181, http://www.chemspider.com/Chemical-Structure.9181.html (accessed 12:10, May 20, 2015). (1)Higgins and
Luthy, 2006; (2) Bhhatarai and Gramatica, 2010.
PFDA
C10HF19O2
logKoc: 2.76 ± 0.11 L/kg(1)
VP: -2.12 mmHg(2)
1.2. Aim of the study
In the present study we aimed to improve ecotoxicological information of several emerging contaminants on which available data is scarce. The selected compounds were the disinfectant triclosan and its metabolite methyl-Triclosan and also 6 perfluoroalkyls acids such as perfluorooctane sulfonate (PFOS), perfluorooctanoic acid (PFOA), perfluorobutane sulfonate (PFBS), perfluorobutanoic acid (PFBA), perfluorodecanoic acid (PFDA) and perfluoroundecanoic acid (PFUnA). To achieve this goal, the well validated embryo development bioassays with zebrafish (Danio rerio) and sea urchin (Paracentrotus lividus)
embryos were conducted.
Figure 9 – Perfluoroundecanoic acid (PFUnA) chemical structure.
Source: CSID:69649, http://www.chemspider.com/Chemical-Structure.69649.html (accessed 12:08, May 20, 2015). (1)Higgins and Luthy, 2006; (2)Kaiser et al., 2005.
PFUnA
C11HF21O2
logKoc: 3.30 ± 0.11 L/kg(1)
2. Materials and Methods
2.1. Tested chemicals
The chemicals tested in this study were obtained from Sigma-Aldrich Company (Table 1). All stock solutions were prepared in Dimethylsulfoxide (DMSO) obtained from Merck.
Table 1 –Referencesof the chemicals tested.
2.2. Artificial seawater
The artificial water was prepared according to Zaroogian et al. (1969) (Table 2).
Sodium chloride and Sodium bicarbonate were both obtained from Merck, whereas Magnesium sulfate, Magnesium chloride hexahydrate and Calcium chloride were all obtained from Sigma-Aldrich.
Table 2 - Artificial seawater composition. Source: Zaroogian et al., 1969
Abbreviation Name CAS number
TCS Triclosan 3380-34-5
M-TCS Methyl-triclosan 4640-01-1
PFOS Perfluorooctanesulfonic acid 2795-39-3
PFOA Perfluorooctanoic acid 335-67-1
PFBS Perfluorobutanesulfonic acid 375-73-5
PFBA Perfluorobutanoic acid 375-22-4
PFDA Perfluorodecanoic acid 335-76-2
PFUnA Perfluoroundecanoic acid 2058-94-8
Molecular formula Name CAS number
NaCl
Sodium chloride
7647-14-5
NaHCO
3Sodium bicarbonate
144-55-8
MgSO
4Magnesium sulfate
7487-88-9
MgCl
2·6H
2O
Magnesium chloride hexahydrate
7791-18-6
2.3. Test organisms
2.3.1. Sea urchin (Paracentrotus lividus)
Paracentrotus lividus is a benthic invertebrate, very common in the Mediterranean
Sea (Tomas et al., 2004) and eastern Atlantic (Boudouresque and Verlaque, 2013; Jacinto et al., 2013). They usually live in seas ranging temperatures from 10-15ºC in winter to
18-25ºC in the summer (Boudouresque and Verlaque, 2013). In the adult stage they can reach about 7 cm of diameter (Boudouresque and Verlaque, 2013) (Figure 10).
Regarding reproduction, these organisms have a specific timing on gonadal growth, occurring once a year. It is stimulated by the photoperiod and the rising of temperature during the summer, usually between May and September (Byrne, 1990).
There is a growing economical relevance of this species in Europe. Furthermore it plays a very important ecologic role in preserving the balance of the ecosystems (Tomas et al., 2004).
Toxicity assessment on sea urchin embryonic development as become very important since these organisms seem to be very sensitive to several classes of chemicals (Pinsino et al., 2010; Hwang et al., 2014; Ribeiro et al., 2015). Furthermore, toxicological
assays in this species are advantageous because of their short embryonic development. It takes 48h to reach larva pluteus stage (Ribeiro et al., 2015), allowing to perform a large
number of assays in a short period of time and limited space facilities.
Figure 10 - Sea urchin (Paracentrotus lividus). Source: Pixabay Database.
In our study, the organisms were all collected in intertidal areas in the Northem Portugal, Vila Nova de Gaia, Granja (N41º 2’ 26,18’’, W -8º 39’ 2,24’’) and transported to the laboratory in a refrigerator container.
Sea urchin reproduction was stimulated in vitro following Ribeiro et al., 2015
protocol. The organisms were dissected and the gametes evaluation was performed on a Nikon eclipse 50i microscope, selecting the female and male based on their eggs quality and sperm mobility, respectively. A viable couple was selected for each assay (Figure 11 A).
A considerable concentration of eggs was collected from the female and placed on 100 mL of artificial salt water and some sperm was added to the mixture. After slowly shaking to help fertilization success, it was determined the fertilization rate calculating the number of fertilized eggs in three drops of 10 µL of solution which is recognized by the appearance of an external membrane (Figure 11 B). The eggs were randomly distributed in the plate.
2.3.1.1. Experimental design
Initially, two pairs of concentrations with a 2.5x dilution factor were tested (1000, 400 and 100, 40 µg/L) in order to cover a wide range of concentrations. Based on the results of the first assay, four additional concentrations (2.5x diluted from the 40 µg/L concentration) were tested in order to test environmentally relevant concentrations. Hence, we exposed sea urchin to eight different concentrations for each chemical: 1000; 400; 100; 40; 16; 6.4; 2.56 and 1.024 µg/L. All stock solutions were dissolved in Dimethylsulfoxide (DMSO) CAS number 2206-27-1 in order to obtain a final DMSO concentration of 0.01%. Finally the solutions were stored at 4°C.
100 µm
Figure 11 - (A) Sea urchin adults dissected (male and female, respectively). (B) Sea urchin
eggs post fertilization (the arrow points to a non-fertilized egg).
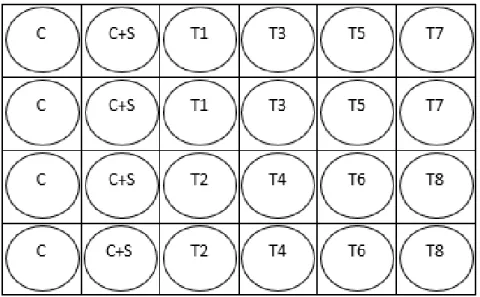
The fertilized eggs were incubated for 48h in the dark at 20ºC in 24-well plates with a concentration of 20 eggs/mL/well. Overall, four independent replicate plates were run for each chemical, i.e., 16 replicates for control and solvent control and 8 replicates for each treatment (Figure 12). LOEC (Lowest Observed Effect Concentration) and NOEC (No Observed Effect Concentration) were determined.
Embryo observations were conducted in a Nikon Eclipse 5100T inverted microscope equipped with a Nikon D5-Fi2 digital camera. Randomly, fifteen larvae per well were observed two days after fertilization in the pluteus phase following previous protocols
(Ribeiro et al., 2015). The endpoints determined were larval abnormalities and the
maximum larvae length which was measured by NIS-Elements version 4.13 image acquisition software.
2.3.2. Zebrafish (Danio rerio)
Zebrafish (Danio rerio) is a well-known vertebrate tropical fish. It is native from Asia
and usually dwells in streams (Engeszer et al., 2007) (Figure 13). In spawning conditions,
the adults move into muddy and vegetated areas with stagnant waters to release the eggs (Engeszer et al., 2007). When mature, the female and male are easily distinguished by the
prominent abdomen of the female.
It has been used for the past two decades as model species in different areas of research. Apart from being cost-effective, the adults are easily obtained and maintained in laboratory conditions. Furthermore, the adults can breed all year around, producing a large number of eggs per spawning, 200-300 per couple (Hill et al., 2005). The short embryonic
development is also useful, 72h to reach early larva stage (Kimmel et al., 1995), allowing to Figure 12 - Experimental design for sea urchin bioassay. C – Control; C+S
perform several toxicity assays in a short period of time. In addition, the small size and transparency of the eggs enables the incubation in microplates and the observations of possible phenotypic changes through the embryos chorion, being easily manipulated (Segner et al., 2009). All these benefits make this species ideal for an acute toxicity assay.
The zebrafish stock was obtained from local suppliers in Singapure and kept in laboratory in a 160L aquarium with dechlorinated water at 28ºC ± 1, pH 8.0 ± 0.5 with a system of recirculation and water renewal passing through mechanical and biological filters. The fish were maintained with a photoperiod of 14/10h (light/dark).The stock was fed with TetraMin® feed four times daily by an automatic feeder and supplemented with Artemia.
For the zebrafish reproduction, 5 females and 10 males, were isolated in a breeding box the day before reproduction. It has been described that zebrafish females prefer gravel substrates to spawn, producing higher quality eggs (Spence et al., 2007). Therefore, the
breading box contained marbles with a net bellow, thus mimicking the gravel substrate (Figure 14). Furthermore, the marbles with the net allowed the eggs to pass and settle in the bottom of the aquarium, thus preventing the adults to reach the eggs, avoiding acts of cannibalism typical of this species.
In the following day the eggs were collected and cleaned one hour and a half after the light switch on. The eggs’ quality was verified through a magnifier and fertilized eggs were selected for the assay and distributed in the microplates within three hours after fertilization.
Figure 13 – Zebrafish (Danio rerio). Source: Wikimedia Commons repository.
2.3.2.1. Experimental design
For zebrafish exposure assays to PFAAs we selected four concentrations, 10000, 1000, 100 and 10 µg/L. These values were chosen based in the literature (Ulhaq et al.,
2013a) following a similar rational to that previously described for sea urchin assay. Only for triclosan the concentrations tested were different: 1000,100, 10 and 1 µg/L and then dilutions of 2.5 times were also performed to refine NOEC and LOEC (Oliveira et al., 2009).
Finally, due to the limited number of toxicity studies performed on methyl-triclosan we chose to perform 10x dilutions as in the PFAAs assays and then dilutions of 2.5 times as in TCS assay to refine NOEC.
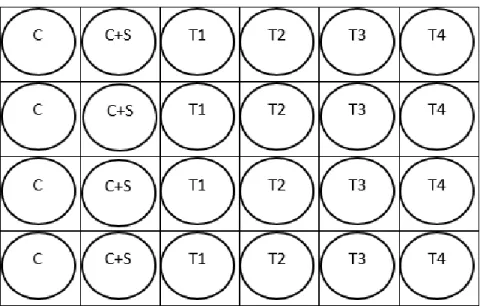
The eggs were distributed into 24-well plate (10 eggs per well) and 16 replicates for each treatment were performed (Figure 15). The embryos were incubated at 26.5ºC ± 1 for 144h (6 days) and the mediums were renewed every day in order to maintain the oxygen conditions, ensuring the compounds’ presence and mortality assessment. Observations were conducted at 8h, 32h, 80h and 144h (Figure 16), following previous protocols (Ulhaq
et al., 2013a; Hagenaars et al ., 2011; Zheng et al., 2012; Ribeiro et al., 2015). Several
endpoints were determined, i.e., abnormal cell growth at 8hpf, embryo development delay at 32 hpf, abnormalities in the eyes, head, tail and yolk-sac, edemas and heart rate at 32, 80 and 144hpf, hatching rate at 80hpf and mortality rate at 8hpf, 32, 80 and 144hpf.
Figure 14 – Representation of zebrafish breading box.
Figure 15– Experimental design for zebrafish bioassay. C – Control; C+S –
Solvent Control; T – Treatment.
A
B
C D
Figure 16– Zebrafish embryonic development. A – 8 hpf (75% epiboly
2.4. Statistical Analysis
All data was analyzed in SPSS Statistics software version 22.0. Homogeneity of variances and normality of data were performed using Levene’s and Kolmogorov-Smirnov test, respectively. Significant differences among treatments were tested at the end of each assay (at 144 hpf for D. rerio assay, and 48 hpf for P. lividus assay) by means of One-Way
3. Results
3.1. Triclosan (TCS)
3.1.1. Zebrafish embryos bioassay
3.1.1.1. Cumulative mortality
Two different embryo bioassays with zebrafish were performed upon exposure to TCS (Figure 1 A, B). At 8 hpf the mortality rate did not differ significantly among treatments. At 32 hpf the mortality rate ranged from 3.75 ± 3.75 in the 1 µg/L treatment to 12.50 ± 3.66 in the first assay solvent control and 12.50 ± 2.50 in the 100 µg/L treatment. At 80 hpf, the mortality rate varied between 7.50 ± 3.66 in the 10 µg/L concentration to 100 in the 1000 µg/L concentration of both assays. At the end of the assays, the mortality rate ranged from 8.75 ± 3.50 in the 64 µg/L treatment (Figure 17 B) to 100 in the higher concentration (Figure 17 A, B). For both assays, the results show a significant increase in the mortality rate (p<0.05) for the embryos exposed to the highest concentration (1000 µg/L) in comparison with all the other treatments except for the concentration immediately below (100 and 400 µg/L) (Figure 17 A, B, respectively).
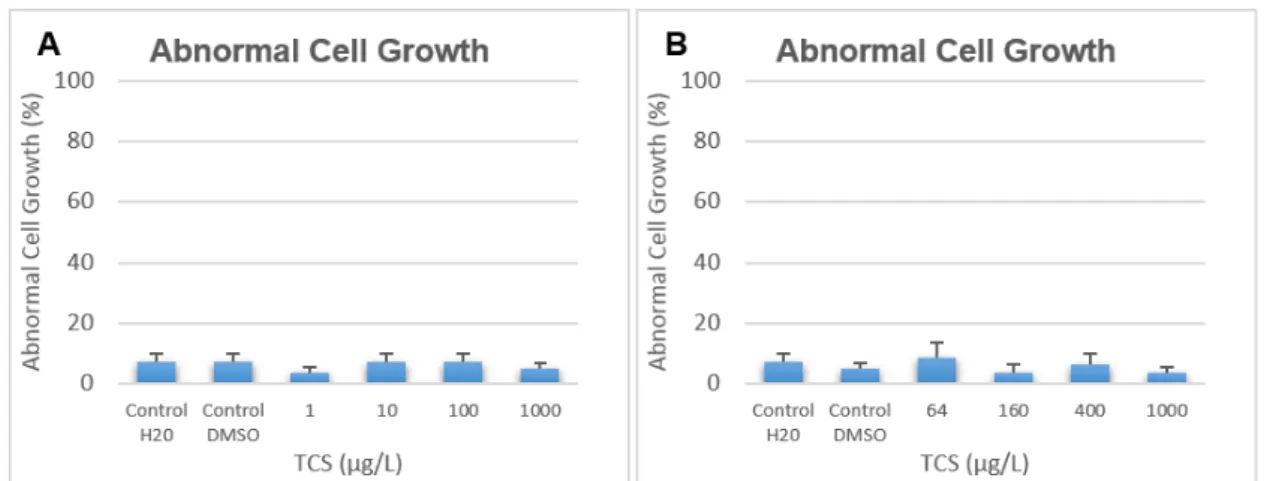
3.1.1.2. Abnormal cell growth
The percentage of embryos exhibiting abnormal cell growth at 8 hpf was similar between treatments and no significant differences (p>0.05) were reported for both assays (Figure 18 A, B).
Figure 17- Cumulative mortality rates (%) of D. rerio exposed to different concentrations of the
3.1.1.3. Embryo development delay
In both assays no significant delay (p>0.05) in the embryonic development were observed (Figure 19).
3.1.1.4. Hatching rate
In the first assay, no significant differences (p>0.05) were reported in the hatching rate among treatments (Figure 20 A). In the second assay, the hatching rate ranged from 61.25 ± 9.34 in the 400 µg/L concentration to 86.25 ± 3.75 in the solvent control and 86.25 ± 4.98 in the 64 µg/L treatment, respectively (Figure 20 B). This decrease on hatching was significantly different (p<0.05) from the solvent control and the 10 µg/L concentration (Figure
Figure 19 - Embryo development delay at 32 hpf (%) of D. rerio exposed to different concentrations
of the disinfectant Triclosan for 144 h. Data are expressed as mean ± SE (n=8). Nonparametric ANOVA Kruskall-Wallis.
Figure 18 - Abnormal cell growth at 8 hpf (%) of D. rerio exposed to different concentrations of the
20 B). In both assays, embryos from the 10000 µg/L concentration were all dead at 80 hpf and so the hatching rate for this treatment was not reported.
3.1.1.5. Head and eyes abnormalities
In both assays, at 144 hpf, the percentage of head (Figure 21 A, B) and eyes abnormalities (Figure 22 A, B) in the embryos were similar among treatments and no significant differences (p>0.05) were detected.
Figure 21 - Head abnormalities (%) of D. rerio exposed to different concentrations of the
disinfectant Triclosan for 144 h in the first assay (A) and second assay (B). Data are expressed as mean ± SE (n=8). Nonparametric ANOVA Kruskall-Wallis (p<0.05), followed by multiple comparisons between groups for both A and B.
Figure 20 - Hatching rate at 80 hpf (%) of D. rerio exposed to different concentrations of the
3.1.1.6. Tail abnormalities
At 144 hpf, the percentage of tail abnormalities was low and no significant differences (p>0.05) were detected among treatments (Figure 23 A, B).
3.1.1.7. Yolk-sac abnormalities
In the end of the first assay, the percentage of abnormalities on embryos’ yolk-sac
was similar among treatments and no significant differences (p>0.05) were reported (Figure 24 A). In the second assay, the percentage of yolk-sac abnormalities ranged from 0 in the water control and the 160 µg/L concentration to 17.71 ± 5.55 in the 400 µg/L treatment. This increase was significantly different (p<0.05) in comparison with all treatments (Figure 24 B).
Figure 22 - Eyes abnormalities (%) of D. rerio exposed to different concentrations of the disinfectant
Triclosan for 144 h in the first assay (A) and second assay (B). Data are expressed as mean ± SE (n=8). Nonparametric ANOVA Kruskall-Wallis for both A and B.
3.1.1.8. Pericardial edema
At 144 hpf, the percentage of pericardial edema on embryos from the first assay was not significantly different (p>0.05) among the different groups (Figure 25 A). In the end of the second assay, the percentage of pericardial edemas observed ranged from 0 in all treatments to 18.75 ± 5.84 in the 400 µg/L concentration. This increase was significantly different (p<0.05) in comparison with all treatments (Figure 25 B).
Figure 25 - Pericardial edema abnormalities (%) of D. rerio exposed to different concentrations of the disinfectant Triclosan for 144 h in the first assay (A) and second assay (B). Data are expressed as mean ± SE (n=8). Nonparametric ANOVA Kruskall-Wallis, followed by multiple comparisons between groups for both (A) (p>0.05) and (B) (p<0.05). Bars with different letters are statistically
Figure 24 - Yolk-sac abnormalities (%) of D. rerio exposed to different concentrations of the
3.1.1.9. Hemorrhages
No significant differences (p>0.05) were observed among groups for this endpoint (Figure 26 A, B).
3.1.1.10. Muscular involuntary contractions
In the first assay, the rate of muscular involuntary contractions was similar among treatments and no significant differences (p>0.05) were reported (Figure 27 A). In the second assay, at the end of the assay the percentage of muscular involuntary contractions ranged from 0 in the water control to 82.29 ± 12.24 in the 400 µg/L treatment. This increase was significantly different (p<0.05) in comparison to all groups (Figure 27 B).
Figure 26 - Hemorrhages (%) of D. rerio exposed to different concentrations of the disinfectant Triclosan
for 144 h in the first assay (A) and second assay (B). Data are expressed as mean ± SE (n=8). Nonparametric ANOVA Kruskall-Wallis for A. ANOVA Kruskall-Wallis for B.
Figure 27 - Muscular involuntary contractions at 144 hpf (%) of D. rerio exposed to different
3.1.1.11. Total abnormalities
For the first assay, no significant differences were detected (p>0.05) for this endpoint at the end of the assay (Figure 28 A). In the second assay, the percentage of total abnormalities ranged from 0 in the 160 µg/L concentration to 100 in the 400 µg/L treatment. This increase was significantly higher (p>0.05) in comparison with all treatments (Figure 28 B).
A B
Figure 29 - D. rerio at 144 hpf in the control group (A) and exposed
to 400 µg/L of the disinfectant Triclosan (B). The black arrows point
the malformations on embryos’ yolk-sac and pericardial edemas.
Figure 28 - Total abnormal embryos (%) of D. rerio exposed to different concentrations of the