Carlos Pestana Barros & Nicolas Peypoch
A Comparative Analysis of Productivity Change in Italian and
Portuguese Airports
WP 006/2007/DE
_________________________________________________________
Wang Jing, Nuno Carlos Leitão & Horácio Faustino
Intra-Industry Trade in Agricultural Products: The Case
of China
WP 06/2010/DE/SOCIUS
_________________________________________________________
Department of Economics
W
ORKINGP
APERSISSN Nº 0874-4548
School of Economics and Management
Intra-Industry Trade in Agricultural Products: The Case of China
Wang Jing - School of Economics and Management, Northeast Agricultural University, Harbin, P.R. China Nuno Carlos Leitão – ESGTS, Polytechnic Institute of Santarém, Santarém, Portugal
Horácio C. Faustino – ISEG-Technical University of Lisbon, Portugal
Abstract: This paper studies the extent and determinants of intra-industry trade (IIT) in agricultural products of China for the period 1997-2006. The IIT index shows that the level of IIT in agricultural products between China and its thirteen main trading partners is not high. Using a panel data analysis, the empirical results of determinants of IIT indicate that differences in per-capita income and geographical distance have a negative effect on Chinese IIT in agricultural products. Free trade agreements between China and some trading partners weaken the negative effect of per-capita income differences on IIT. The results also suggest that cultural similarity between China and some countries has a positive influence on this type of trade. Key words: agricultural products; intra-industry trade; China
JEL Classification: F14,
Author Addresses:
Wang Jing (corresponding author)
School of Economics and Management, Northeast Agricultural University, Harbin, P.R. China 150030 Tel: (+86)45153956315; E-mail: wj2005guomao@yahoo.com.cn
Nuno Carlos Leitão
Escola Superior de Gestão e Tecnologia de Santarém, Complexo Andaluz 295 2001-904 Santarém, Portugal. Tel: (+351) 243303200 ;E-mail: nuno.leitao@esg.ip.santarem.
Home Page: http://leitaocarlosnuno.webnode.com/
Horácio C. Faustino ISEG- Instituto Superior de Economia e Gestão, Rua Miguel Lúpi, 20. 1249-078 Lisboa, Portugal Tel: (+351) 213925902 Email: faustino@iseg.utl.pt.
I. Introduction
Intra-industry trade (IIT) has attracted much attention from scholars since Verdoon first
discovered this phenomenon in 1960. Traditional trade theories based on comparative
advantage could not explain this type of trade pattern, therefore, a new trade theory was
called for. Few of the empirical studies based on the new international trade theory – as
proposed by Krugman (1979, 1980, 1981) and Lancaster (1980) – have considered the
agricultural sector. In 1991, McCorriston and Sheldon first took the United States and the
European Union as an example to analyse the intra-industry trade (IIT) in processing
agricultural products. They found that in this type of products, the United States is typical
of an inter-industry trading country. In contrast, in the EU, the IIT is predominantly in
agricultural products.
The liberalisation of the Chinese economy and its impressive GDP growth rate has
attracted the attention of the academic world. China has become a global powerhouse in
terms of international trade. World Trade Organisation (WTO) statistics show that China is
currently the second-largest trading country in the world. According to the WTO, China’s
trade-to-GDP ratio is 74.3. Therefore, we can conclude that most of its economic growth
has stemmed from the growth of trade.
At the same time, when conducting research into the Chinese economy, its present
situation should not be overlooked. More specifically, China is still largely an agricultural
country, in which farmers and land workers account for the largest proportion of the
national population. Hence, the development of agricultural trade would contribute to
improving the incomes and standards of living of the Chinese rural population. The
identification of the determinants and the level of IIT in agricultural products would provide
valuable insights into the trading patterns and the status of Chinese agricultural products in
the world market. In turn, this would enable policymakers to plan and take measures to
expand agricultural exports.
The present paper is motivated by the fact that there is little existing research into IIT in
the agricultural sector and that the study of the Chinese trade pattern in agricultural
products is of value to an understanding of the Chinese economic liberalisation. In order to
introduce liberal economic policies in the agricultural sector, we should first establish
whether trade in processed agricultural products is essentially of the intra-industry type or
bilateral IIT in these products. The remainder of the article is organised as follows. Section
II briefly reviews the theoretical background of intra-industry trade. Section III presents the
recent development and characteristics of Chinese agricultural trade. Section IV describes
the level of IIT in agricultural products between China and its major trading partners.
Section V presents the econometric model and analyses the results. The final section
concludes.
II. The theory of intra-industry trade
The first theoretical models of IIT were made by Krugman (1979, 1980, 1981), Lancaster
(1980) and Helpman (1981). This work was synthesized in Helpman and Krugman’s (1985)
model. This is a model that combines monopolistic competition with the Heckscher-Ohlin
(HO) theory, incorporating factor endowments differences, horizontal product
differentiation and increasing returns to scale. The model generates both intra- and
inter-industry trade and gives support to the following country-specific hypothesis: the more
different are the factor endowments, the smaller is IIT. As horizontal product differentiation
considers that different varieties are of the same quality, but have different characteristics,
they may be produced with similar factor intensity. Linder’s theory can also be used to
explain IIT. Linder (1961) considered that consumers’ tastes are conditioned by their
income levels. These tastes yield demands for products and this demand structure generates
a production response. Hence, countries with similar per-capita incomes will have similar
demand structures and will export similar goods. The Linder theory of overlapping
demands suggests that goods must first be produced for home markets and then exported to
similar countries. According to Linder’s (1961) hypothesis, a negative relationship between
income differences and IIT is to be expected.
In the theoretical models, the distinction between the two types of IIT is very important.
As was stressed by Greenaway et al. (1994, 1995), there are theoretical reasons – different
determinants – and empirical evidence that justify separating the horizontal IIT (HIIT) from
the vertical IIT (VIIT). In this paper we only consider the determinants of IIT.
In the empirical studies of bilateral trade the gravity equation has been employed. The
gravity equation describes very well the bilateral trade flows as a function of the respective
economic dimensions and distance between trading partners, working successfully in the
empirical studies on developed and developing countries.
of the economic size of trading partners (positive or gravitational effects) and the distance
between them (a negative effect or counter-force).
As Feenstra, Markusen and Rose (2001) proved that a wide range of theories are
consistent with a gravity-type equation, we have decided to introduce in this paper the
variables: distance and economic size, which are typical variables of the gravity models.
Trade barriers restrict international trade. Hence, it can be hypothesised that IIT will be
greater, the lower the levels of trade barriers or the higher the level of economic integration.
In addition, we can hypothesise that the IIT will be greater if the countries share a language
or culture.
III. Recent development and characteristics of Chinese agricultural trade
Chinese agricultural imports and exports grew during the period from 1996 to 2008, with
the exception of 2006. The total volume of exports of agricultural products increased from
13.72 billion U.S. dollars in 1996 to 338.83 billion U.S. dollars in 2008, while total imports
by 2008 were six times larger than in 1996, rising from 8.46 billion USD to 50.41 billion
USD. Figure1 below indicates that the import growth of agricultural products was
significantly higher than export growth after China’s accession to the WTO. Imports and
exports volumes were nearest to parity in 2004. From 2004, import growth of agricultural
products slowed down. The gap between exports and imports was at its widest in 2006.
Exports maintained their rhythm of growth, whereas imports declined from 2005 to 2006.
However, imports then experienced a sharp increase over the next 2 years, so that by the
end of 2008, they exceeded exports by more than 10 billion USD.
Figure1. The trend of export and import volume
0 10000000000 20000000000 30000000000 40000000000 50000000000 60000000000
1996 1997 1998 1999 2000 2001 2002 2003 2004 2005 2006 2007 2008
export import
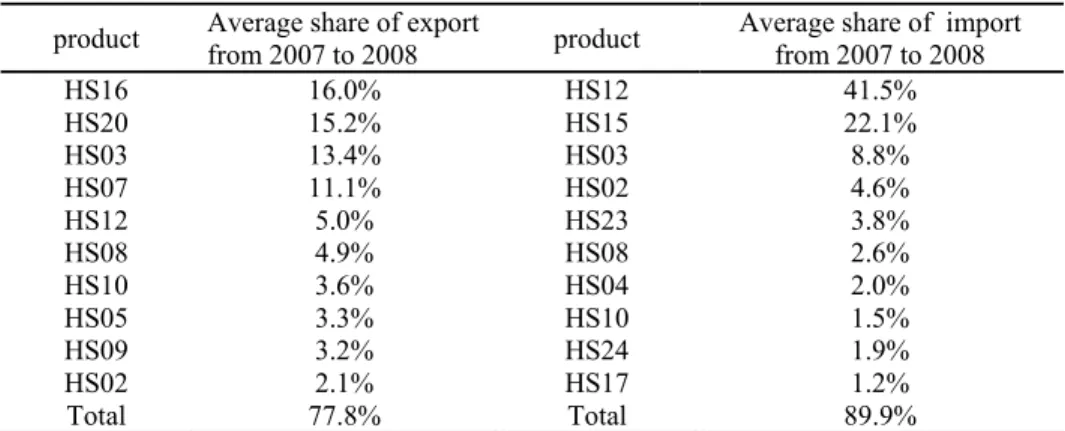
Table1. Main export and import share by products
product Average share of export
from 2007 to 2008 product
Average share of import from 2007 to 2008
HS16 16.0% HS12 41.5%
HS20 15.2% HS15 22.1%
HS03 13.4% HS03 8.8%
HS07 11.1% HS02 4.6%
HS12 5.0% HS23 3.8%
HS08 4.9% HS08 2.6%
HS10 3.6% HS04 2.0%
HS05 3.3% HS10 1.5%
HS09 3.2% HS24 1.9%
HS02 2.1% HS17 1.2%
Total 77.8% Total 89.9%
Source: authors’ calculations from the data of the UN COMTRADE
The trade products of China are concentrated, several products accounting for the major
share of the exports and imports. Four types of products: HS03, HS12, HS02 and HS08,
represented a great proportion of both exports and imports. The remaining agricultural
products had much less significance. For example, the total average share of agricultural
exports of products HS03, HS16, HS20 and HS07 was 55.7%, while the total average
import share of HS12, HS15 and HS03 was 72.4%. We can thus conclude that a small
number of agricultural products played a significant role in agricultural trade in China.
Table 2. Main export and import markets by country
Country Share on export Country Share on import Japan 32.4% USA 22.7%
Korea 9.6% Brazil 11.6%
USA 8.7% Malaysia 11.0%
Argentina 8.0% Russia 8.3% Germany 3.6% Indonesia 8.0%
Total 62.2% Total 61.6% Source: authors’ calculations from the data of the UN COMTRADE
With regard to the trading partners, the agricultural trade also appears to be concentrated.
Japan is the largest export market, taking 32.4% of the agricultural products exported. The
five largest partners combined represent 62.2% of China’s agricultural exports. The USA is
the most important source of imports, with 22.7% of the imported agricultural products
coming from this market. This is due to the fact that the USA has great competition in bulk
in agricultural products. The five largest markets supplying China with its imported
IV. The analysis of intra-industry trade
IV.1. Method and data
At present, the most commonly-used measurement of the level of intra-industry trade is
the Grubel-Lloyd index, which is calculated as:
ijt ijt ijt ijt ijt M X M X GLI + − −
=1 (1)
Where GLIijtis the intra-industry trade index for agricultural producti between China
and countryjat timet, much closer to 1 indicates intra-industry trade is more important and
much closer to 0 indicates that inter-industry trade is more important. We useXijtand
ijt
M separately to represent the exports and imports of iproduct with trading partner j.
In order to measure the entire industry, we can use the following formula:
∑
= = n i ijt u GLI n GLI 1 1 (2)Where n is the number of agricultural products and GLIuis the average IIT index of
nproducts. We call GLIu the un-weighted GL index in this paper.
Different types of products play different roles in a country’s foreign trade, so some
scholars argue that the foreign trade position of various products in the industry should be
taken as the weight to calculate the weighted average to measure the level of intra-industry
trade of the whole industry. Thus, it is more appropriate if the trade value weighted average
GL is:
ijt
n
i j j
ij ij w GLI M X M X
GLI ( )
1
∑
= +
+
= (3)
Where j j ij ij M X M X + +
is the weight of producti, andXjandMj express the total agricultural
exports and imports between China and trade partner j.
Total IIT can be divided into horizontal IIT and vertical IIT. Horizontal IIT is originated
from different characteristics of products to attract the preference of consumers. Vertical
horizontal IIT from vertical IIT. The most commonly used method is to measure the relative
unit value of exports to the unit value of imports of product. If the result is within a specific
range, it is horizontal IIT. When the result is beyond the range, it is vertical IIT. The
formulae can be expressed as follows:
Horizontal IIT: 1−α≤ M ≤1+α
ijt X ijt
UV UV
(4)
Vertical IIT: M ≤1−α
ijt X ijt
UV UV
or M ≥1+α
ijt X ijt
UV UV
(5)
In studies, α =0.25 is widely used, so we chooseα =0.25 in this study.
The export and import volume data calculated to measure the level of intra-industry trade
in agricultural products come from UN COMTRADE database.
IV.2. Results
In order to calculate the IIT index of agricultural products in China from 1996 to 2008, a
large amount of data requires processing. Every HS 4 product acts as an industry and 13
trading partners are selected. These 13 trading partners comprise 80% of the total
agricultural trade of China, so they are representative. The trend of the annual average of
the IIT indexes between China and its 13 trading partners is expressed in Figure 2. From
1996 to 2008, the value of all of the four kinds of IIT indexes has been stable. The
un-weighted GL index is from the highest degree of 0.128 in 1997 to the lowest degree of
0.110 in 2003.
Figure 2. The trend of average IIT indices of agricultural products by time
0 0.02 0.04 0.06 0.08 0.1 0.12 0.14
1996 1997 1998 1999 2000 2001 2002 2003 2004 2005 2006 2007 2008
un-weighted GL index weighted GL index horizontal IIT vertical IIT
Over the 13 years for all the 13 trading partners, the annual average of un-weighted GL
index is largest in 1997. The value is 0.128, so we can conclude that the level of
intra-industry trade in the agricultural products of China is very low. The average of the trade
weighted GL index was greater than the un-weighted GL during the period studied.
Compared with the value of vertical industry trade, the value of horizontal
intra-industry trade is quite small. Compared to the horizontal IIT, vertical IIT had a large share
in the total IIT between China and its 13 trading partners.
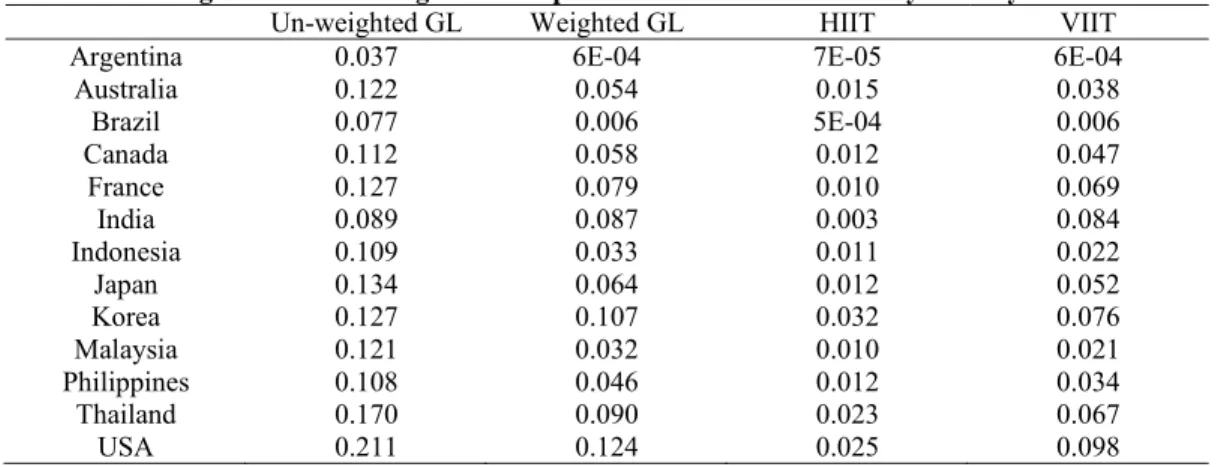
The difference in the IIT levels between China and its 13 trading partners are summarised
in Table 3. As the most important trading partner, the USA enjoys the highest level of IIT,
as reported in Table 3. The average GL index during the 13 years studied was 0.211.The IIT
indices greater than 0.10 were Australia, Canada, France, Indonesia, Japan, Korea,
Malaysia, Philippines and Thailand. The trade value weighted IIT indices were all lower
than the un-weighted IIT indices of all the 13 trading partners. The USA was also the
highest among all the trading partners. Korea had the highest horizontal IIT (0.032) and the
USA had the highest vertical IIT (0.098).
Table 3. Average IIT indices of agricultural products from 1996 to 2008 by country Un-weighted GL Weighted GL HIIT VIIT
Argentina 0.037 6E-04 7E-05 6E-04
Australia 0.122 0.054 0.015 0.038
Brazil 0.077 0.006 5E-04 0.006
Canada 0.112 0.058 0.012 0.047
France 0.127 0.079 0.010 0.069
India 0.089 0.087 0.003 0.084
Indonesia 0.109 0.033 0.011 0.022
Japan 0.134 0.064 0.012 0.052
Korea 0.127 0.107 0.032 0.076
Malaysia 0.121 0.032 0.010 0.021
Philippines 0.108 0.046 0.012 0.034
Thailand 0.170 0.090 0.023 0.067
USA 0.211 0.124 0.025 0.098
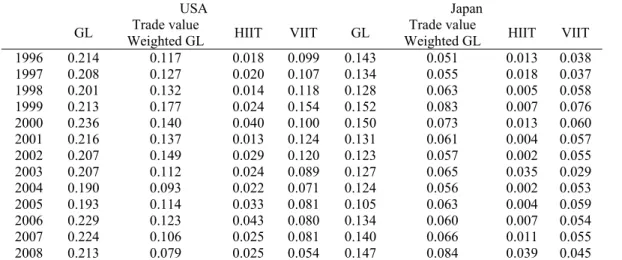
Table 4. IIT indices of selected countries
USA Japan
GL Trade value
Weighted GL HIIT VIIT GL
Trade value
Weighted GL HIIT VIIT 1996 0.214 0.117 0.018 0.099 0.143 0.051 0.013 0.038 1997 0.208 0.127 0.020 0.107 0.134 0.055 0.018 0.037 1998 0.201 0.132 0.014 0.118 0.128 0.063 0.005 0.058 1999 0.213 0.177 0.024 0.154 0.152 0.083 0.007 0.076 2000 0.236 0.140 0.040 0.100 0.150 0.073 0.013 0.060 2001 0.216 0.137 0.013 0.124 0.131 0.061 0.004 0.057 2002 0.207 0.149 0.029 0.120 0.123 0.057 0.002 0.055 2003 0.207 0.112 0.024 0.089 0.127 0.065 0.035 0.029 2004 0.190 0.093 0.022 0.071 0.124 0.056 0.002 0.053 2005 0.193 0.114 0.033 0.081 0.105 0.063 0.004 0.059 2006 0.229 0.123 0.043 0.080 0.134 0.060 0.007 0.054 2007 0.224 0.106 0.025 0.081 0.140 0.066 0.011 0.055 2008 0.213 0.079 0.025 0.054 0.147 0.084 0.039 0.045 Source: authors’ calculations from the data of the UN COMTRADE
The IIT indices of representative countries are reported. The USA and Japan are China’s
most important trading partners in agricultural products. The IIT index between China and
the USA has changed over time. The trade value weighted IIT index was lower than the
simple average IIT. Horizontal IIT index was more stable than vertical IIT. Vertical IIT was
always higher than horizontal IIT. For Japan, the GL index changed more strongly and the
trade value weighted GL was lower than the simple average GL index. The vertical IIT was
higher than horizontal IIT, except in 2003.
V. Econometrical Model
The dependent variable used is the IIT Grubel and Lloyd (1975) index. The explanatory
variables are country–specific characteristics. The data sources for the explanatory variables
are the World Bank Development Indicators (2008). The source used for the dependent
variable was data from the UN COMTRADE1.
V.1. Explanatory variables and the testing of hypotheses
Hypothesis 1: There is a negative relationship between differences in per-capita income and
IIT
LogDGDP is the logarithm of absolute difference in per-capita GDP (PPP, in current
international dollars) between China and the trading partner. Loertscher and Wolter (1980)
1
suggested a negative sign for the IIT model. Loertscher and Wolter (1980) and Balassa and
Bauwens (1986) estimated a negative coefficient. The study of Ferto and Soós (2008) also
found a negative sign. In addition, we considered the following multiplicative dummy
variable: FTA×DGDP, where FTA means free trade agreement. The dummy variable FTA
equals 1 if the Chinese trading partner is Thailand or Philippines and 0 otherwise.
Hypothesis 2: IIT occurs more frequently among countries that are similar in terms of
factor endowments
LogEP is a proxy for the differences in physical capital endowments. It is the logarithm
of the absolute difference in electric power consumption (Kwh per capita) between China
and its partners. Based on Helpman and Krugman (1985) and Hummles and Levinshon
(1995), we expect a negative sign for the coefficient of this explanatory variable. The study
of Zhan et al. (2005), applied to Chinese intra-industry trade, found a negative sign.
Hypothesis 3: The economic dimension influences the volume of trade positively
LogDIM is the logarithm of average GDP of the two trading partners. Usually the
studies utilized this proxy to evaluate the potential economies of scales and the variety of
differentiated product. A positive sign is expected for the coefficient of this variable (see,
for example, Greenaway et al., 1994).
Hypothesis 4: Cultural similarity influences the volume of trade
Following the study of Zhan et al. (2005), applied to Chinese intra-industry trade, we
decided to consider the following proxy: CULTURE is a dummy variable that equals 1 if
the country is Japan or Korea and 0 otherwise. The expected sign is positive.
Hypothesis 5: Trade increases when partners are geographically close
LogDIST is the logarithm of geographical distance between China and the partner
country. Following the most empirical studies, we use kilometres between the capital cities
Breuss, 2008, Blanes 2006, and Cieslik, 2005).
DIST
FTA× is a multiplicative dummy variable and FTA equals 1 if there is a free trade
agreement (FTA) between China and the trading partner and 0 otherwise. We expect a
weakness of the negative effect of distance.
V.2. Model Specification
it i it
it
X
t
IIT
=
β
0+
β
1+
δ
+
η
+
ε
(4)Where IITit is the Chinese IIT index and X is a set of explanatory variables. All
variables are in the logarithm form; ηi is the unobserved time-invariant specific effects;
t
δ captures a common deterministic trend; εit is a random disturbance assumed to be
normal, and identically distributed with E (εit)=0; Var (εit)=σ2 f0.
Following the empirical work of Hummles and Levinsohn (1995), we apply a logistic
transformation to IIT, because IIT is an index varying between zero and one:
IITit= Ln [IITit/(1-IIT)] (5)
V.3. Estimation Results
In this section, we present the results with country characteristics as explanatory
variables. We include in this estimation the following trading partners of China: Argentina,
Brazil, France, India, Indonesia, Japan, Korean, Malaysia, Philippines, Thailand, and the
USA.
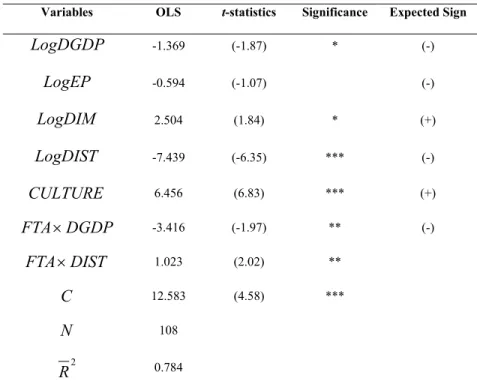
As Table 6 shows, the general performance of the model is satisfactory. The explanatory
power of this regression is very high (Adjusted R2=0.784).
The model presents six significant variables (LogDGDP,LogDIM,LogDIST ,CULTURE,
DGDP
Table 6. The determinants of intra-industry trade: OLS with time dummies
Variables OLS t-statistics Significance Expected Sign
LogDGDP -1.369 (-1.87) * (-)
LogEP -0.594 (-1.07) (-)
LogDIM 2.504 (1.84) * (+)
LogDIST -7.439 (-6.35) *** (-)
CULTURE 6.456 (6.83) *** (+)
DGDP
FTA× -3.416 (-1.97) ** (-)
DIST
FTA× 1.023 (2.02) **
C 12.583 (4.58) ***
N 108
2
R 0.784
T- Statistics (heteroskedasticity corrected) are in round brackets. ***/**/*- statistically significant at the 1%, 5% and 10% levels.
The variable LogDGDP presents a negative sign and is significant at the 10% level. The
Linder (1961) hypothesis is confirmed. This result is also in accordance with Loerstscher
and Wolter (1980) and Greenaway et al. (1994). Zhang et al. (2005) also found a negative
sign to Chinese IIT.
The variable, LogDIM(average of GDP), used also by Greenaway et al. (1994), has a
significant and predicted positive effect on IIT. Hellvin (1996) analysed the case of China
and also found a positive sign for market size or economic dimension. Ferto and Soós (2008)
and Turkcan (2005) similarly estimated a positive coefficient for this variable.
The proxy geographic distance (LogDIST ) is typically used as a proxy for transport
costs. We find a negative sign and confirm the theoretical hypothesis.
As expected, the dummy variable CULTURE is positive, with a high level of
significance, which validates our hypothesis, i.e. the importance of the cultural dimension
on trade.
We expected that the effect of differences in per-capita GDP (DGDP) would be
weakened when the trading partner has a free trade agreement with China (FTA) and the
The variable difference in GDP per capita (LogDGDP) is not statistically significant.
VI. Conclusions
The results of the GL index show that the level of intra-industry trade between China
and its trading partners is not high, also indicating that traditional factor endowment plays a
significant role in the division of labour in the agricultural trade of China. The agricultural
products with large volumes of trade experience low levels of intra-industry trade, while
those with small volumes of trade enjoy high levels of intra-industry trade. In relation to the
determinants of intra-industry trade, the empirical results indicate that difference in demand,
geographical distance between China and its trading partners and economic size have
negative correlations with IIT. The integration process between China and some country
partners, namely Thailand and Philipines, weakens the negative effect of differences of
per-capita GDP on IIT. On the other hand, the similiarity of cultures increases the IIT. In
general, we can affirm that the econometric results support the hypotheses formulated. In a
future research project, we will calculate both the vertical intra-industry trade (VIIT) and
horizontal IIT (HIIT), in order to estimate the determinants of these two types of IIT.
References
Abel-el-Rahaman, K.(1991), ‘Firms Competitive and National Comparative Advantages as
Joint Determinants of Trade Composition’, Weltwritschaftliches Archiv, 127(1), 83-97.
Badinger, H., and Breuss, F. (2008), ‘Trade and Productivity: An Industry Perspective’,
Empírica, 35 ,213-231.
Balassa, B. and Bauwens, L.(1986), ‘Intra-Industry Specialization in Multi-Country and
Multi-Industry Framework’, The Economic Journal , 97, 923-999.
Cies´lik, A. (2005), ‘Intra-industry Trade and Relative Factor Endowments’, Review of
International Economics 13, 904-926.
Eaton, J, and Kierzkowski, H. (1884), Oligopolistic competition, product variety and
international trade. In H.Kierzkowki (Eds), Monopolistic Competition and International
Trade, Oxford USA: Oxford University Press, 69-83.
Egger, H, Egger, P, and Greenaway, D. (2008), ‘Intra-industry trade with multinational
Falvey, R. E. (1981), ‘Commercial policy and intra-industry trade’, Journal of International
Economics, 11 (4), 495–511.
Feenstra, R., Markusen, J. and Rose, A. (2001), ‘Using the gravity equation to differentiate
among alternative theories of trade’, The Canadian Journal of Economics, 34, pp.430-447.
Greenaway, D., R. Hine and C. Milner (1994), ‘Country-Specific Factors and the Pattern
of Horizontal and Vertical Intra-Industry Trade in the UK’, Weltwirtschaftliches Archiv,
130, 77-100.
Greenaway, D., R. Hine, and C. Milner (1995), ‘Vertical and Horizontal Intra-Industry
Trade: A Cross Industry Analysis for the United Kingdom’, The Economic Journal, 105,
1505-1518.
Grubel, H. and P. Lloyd (1975), Intra-industry Trade. The Theory and Measurement of
International Trade in Differentiation Products, London: The Mcmillan Press.
Helpman, E. (1981), ‘International Trade in the Presence of Product Differentiation,
Economies of Scale and Monopolistic Competition’, Journal of International Economics,
11,305-40.
Helpman, E. and Krugman, P. (1985), Market Structure and Foreign Trade, Brighton,
United Kingdom: Harvester Wheatsheaf.
Helpman, E. (1987), ‘Imperfect Competition and International Trade: Evidence from
Fourteen Industrial Countries’, Journal of the Japanese and International Economics, 1,
62-81.
Hummels, D. and J. Levinsohn (1995), ‘Monopolistic Competition and International Trade:
Reconsidering the Evidence’, Quarterly Journal of Economics, 110, 799-36.
Krugman, P. (1979), ‘Increasing Returns, Monopolistic Competition, and International
Trade’, Journal of International Economics 9, 469-480.
Krugman, P. (1980), ‘Scale Economies, Product Differentiation, and the Pattern of Trade’,
American Economic Review 70, 950-959.
Krugman, P.(1981), ‘Intra-industry Specialization and the Gains from Trade’, Journal of
Political Economy, 89, 959-973.
Lancaster, K. (1980), ‘Intra-Industry Trade under Perfect Monopolistic Competition’’,
Journal of International Economics, 10 , 151-170.
Linder, S. (1961), An Essay on Trade and Transformation, New York: Wiley.
Loertscher, R.and F. Wolter (1980), ‘Determinants of Intra-Industry Trade: Among
Michael Thorpe and Zhaoyang Zhang(2005), ‘Study of the Measurement and Determinants
of Intra-industry Trade in East Asia’, Asian Economic Journal, 19, 231-247.
Shaked, A, and Sutton, J.(1984), Natural oligopolies and international trade. In H.
Kierzkowski (Ed), Monopolistic Competition and International Trade, (Oxford, USA:
Oxford University Press), 34-50.
Steve McCorriston and Ian M. Sheldon (1991), ‘Intra-Industry Trade and Specialization in
Processed Agricultural Products: The Case of the US and the EC’, Review of Agricultural
Economics, 13(2), 173-184.
Xiaoling Hu and Yue Ma(1999), ‘International Intra-industry Trade of China’,
Weltwirtschaftliches Archiv, 135(1), 82-101.
Zhang, J., A. Witteloostuijn, and C. Zhou (2005), ‘Chinese Bilateral Intra-Industry Trade: A
Panel data Study for 50 Countries in the 1992-2001 Period’, Weltwirtschaftliches Archiv,