Master’s
Finance
Master
’s Final
Work
Dissertation
Determinants of the Non-Life Insurance Performance
The Portuguese Case
SHEZA ALLY KHAN
Master
’
s
Finance
Master
’s
Final Work
Dissertation
Determinants of the Non-Life Insurance Performance
The Portuguese Case
SHEZA ALLY KHAN
Supervisor
Professora Doutora Maria Rosa Vidigal Tavares da Cruz
Quartin Borges
i
Abbreviations and Acronyms
AIG – American International Group
ASF –Autoridade de Supervisão de Seguros e Fundos de Pensões
CEA - Comité Européen des Assurances
IAS – International Accounting Standards
ROA – Return on Assets
ROE – Return on Equity
ii
ABSTRACT
This dissertation aims to study the effects of the financial crisis of 2008 on the non-life
insurance industry and to determine which variables influence the profitability of
non-life insurers in Portugal, for the period between 2004 and 2013.
To accomplish this, we reviewed the literature and made a financial analysis of the
non-life insurance industry in order to, through two linear regressions, be able to study
the variables that explain the behaviour of the financial performance.
The data required for this study were collected in the ASF —Autoridade de Supervisão
de Seguros e Fundos de Pensões. The method chosen for the results of the multiple
regressions was the random effects on ROA—Return on Assets—and fixed effects for
the ROE—Return on Equity—through Gretl. The sample includes 150 observations of
15 non-life insurers, through a time horizon of 10 years.
The results confirmed that the financial structure of the non-life insurance companies
in Portugal is rock solid, and that the chosen independent variables behaved according
to what would be expected. According to our final results, the determinants of the
financial performance in the Portuguese non-life insurance market are company age,
premium growth, loss ratio, tangibility and management competence index.
Jel Classification: C33, G01, G22
iii
RESUMO
Esta dissertação tem como objetivo estudar os efeitos da crise financeira de 2008 no
setor segurador não vida e determinar quais as variáveis que influenciam a
rentabilidade das seguradoras não vida em Portugal, para o período compreendido
entre 2004 e 2013.
Para alcançar este objetivo, após revisão da literatura foi feita uma análise financeira
ao setor segurador não vida e, através de duas regressões lineares, estudaram-se as
variáveis que explicam o comportamento do desempenho financeiro.
Os dados necessários para a realização deste estudo foram recolhidos na ASF –
Autoridade de Supervisão de Seguros e Fundos de Pensões. O método escolhido para
obter os resultados referentes às regressões múltiplas foi o de efeitos variáveis para o
ROA —Return on Assets— e efeitos fixos para o ROE — Return on Equity— através do
Gretl. A amostra inclui 150 observações de 15 seguradoras não vida, num horizonte
temporal de 10 anos.
Os resultados confirmaram que a estrutura financeira das companhias de seguro
não-vida em Portugal é bastante sólida e que as variáveis independentes escolhidas
apresentaram um comportamento de acordo com o que seria expectável. De acordo
com os resultados finais obtidos, os determinantes do desempenho financeiro no
mercado de segurador não vida Português são a idade da empresa, o crescimento dos
prémios, taxa de sinistralidade, tangibilidade e índice de competência de gestão.
Jel Classificação: C33, G01, G22
iii
ACKNOWLEDGEMENTS
If you are reading this page, it is because I was able to finish this dissertation!
It was not easy to get here, it was a long journey, and when I got to this stage of
writing the acknowledgements, fear seized me for I could be forgetting someone that,
in a way or another, might have contributed for me to be here today celebrating this
event. For all those who were in my life, from kindergarten to the completion of my
Master’s thesis—kindergarten teachers, assistants, school helpers, high school
teachers, professors, colleagues, family, and friends—my sincere thanks.
A special thanks to Professor Maria Rosa Borges, for her excellent supervision
throughout this dissertation. I am extremely grateful for all your time, advice, criticism,
support, encouragement and enthusiasm.
I would also like to extend my gratitude to my teacher and friend Ana Lorga, for her
continuous availability and precious support. She was always patient and generous.
Finally, I would like to thank my parents: I have no words to thank you for all you have
done and still do for me. Everything I am today and will be in the future I owe to you.
Thank you for everything and for dedicating the best of you to always giving me the
best, often what you never had.
iv
CONTENTS
1. Introduction ... 1
2. Literature Review ... 3
2.1. Impact of crisis in the insurance industry ... 3
2.2. Determinants of insurance profitability ... 7
3. Characterization of the non-life insurance industry in Portugal...12
4. Empirical Application ...17
4.1. Data collection and Descriptive Statistics...17
4.2. Methodological Approach and Variables...18
4.3. Results ...21
5. Conclusion ...24
References ...26
Other References ...28
v
TABLE
CONTENTS
Table 1 – Main Activity Indicators ... 12
Table 2 – Expected Effects ... 19
Table 3 - Regression Results ...….......25
Table 4 - Market Share of 15 non life insurance companies…......35
Table 5 - Descriptive Statistics for Dependent Variable ROA...…...36
Table 6 - Descriptive Statistics for Dependent Variable ROE.….....36
Table 7 - Descriptive Statistics for Independent Variable Leverage ...37
Table 8 – Descriptive Statistics for Independent Variable Age ...37
Table 9 - Descriptive Statistics for Independent Variable Size ...…...38
Table 10 - Descriptive Statistics for Independent Variable Management Competence Index..…......38
Table 11 - Descriptive Statistics for Independent Variable Tangibility…...39
Table 12 - Descriptive Statistics for Independent Variable Premium Growth...39
Table 13 - Descriptive Statistics for Independent Variable Loss Ratio ...40
Table 14 - Multicollinearity ...40
Table 15 - Correlation Matrix for ROA ………...41
1
1. Introduction
This dissertation analyses the profitability of the non-life insurance industry in Portugal
during the period 2004-2013 with a particular emphasis on the financial crisis period.
The main objectives of this dissertation are to understand the impact that the crisis
had on the insurance industry and to identify the factors that influence the
performance of this same industry in Portugal. In the literature, one may find many
studies concerning the determinants of profitability of the banking sector and other
sectors of the economy, yet, for the insurance industry, the determinants of
profitability have been received little attention. To the best of our knowledge, there
are no studies that investigate the determinants of the performance of the insurance
industry in Portugal and we intended to fill this gap.
The insurance industry contributes to the stability of capital markets, increases the
confidence indexes of economic agents and is important to the financial system
because it allows the development of the economy (Silva, 2000). Insurance companies
are able to reduce uncertainty and volatility through risk transfer, which is a major
functionality of insurance for clients. The client pays a premium, and is insured against
a specific uncertainty. Risk transfer enables us to reduce the impact of the crisis and to
stabilize the economic cycle (Sumegi and Haiss, 2006).
The financial crisis was responsible for a significant and generalized economic
slowdown. As a consequence of the crisis losses were recorded in the level of global
2
unemployment. The insurance sector in Portugal was no exception and was affected
by the crisis in terms of results, innovation, efficiency and growth rates. However, the
insurance sector has shown resilience due to high levels of solvency that were
achieved before (APS, 2008).
One of the factors that contribute to the growth of the insurance industry is the
performance of insurance companies, therefore the study of the determinants of
performance of the insurance companies is important because it allows improving the
market value of the insurance company and, in turn, leads to the prosperity of the
economy (Mehari and Aemiro, 2013). In this study, we conduct an empirical
application to analyze the determinants of performance of 15 non-life insurance
companies through regression analysis of the ROA – return on assets, and ROE – return
on equity. To identify what are the key factors that determine insurance profitability
we apply multiple regression with variable effects for ROA and fixed effects for ROE.
This dissertation is structured in five sections. After the introduction, section 2
presents a brief review of the literature relating to the impact of the crisis in the
insurance industry, and the determinants of insurance profitability. Section 3 presents
a brief characterization of the non-life insurance industry in Portugal in the period
2004-2013. Section 4 presents the empirical application that begins by defining the
sample, methodology and dependent/independent variables. Still, in this section we
shall present and discuss the results of the regression analysis. In the remaining
3
2. Literature Review
The subprime crisis that emerges in 2008 in the USA, and has extended to Europe and
Japan, ended a cycle of great global prosperity with low levels of volatility in the
markets and abundant liquidity. This crisis in the monetary market spread to the rest
of the economy and, at this point of the literature review, we try to point out the
effects recorded in the insurance sector.
Also in this point, we review the literature on the relationship between determinants
and insurance performance. The financial analysis of insurance companies is important
because it allows us to track the financial performance of the company, which can be
conditioned by determinants such as age, management competence index, liquidity,
tangibility, loss ratio, premium growth, and leverage.
2.1. Impact of crisis in the insurance industry
The impact of the financial crisis in the insurance industry has not been insignificant,
but it has been less severe than in the remaining financial system, namely in the
banking sector. In a crisis context, the presence of insurers and their general
robustness may have had a stabilizing effect in overall economic terms. (Baluch et al.,
4
According to CEA Insurers of Europe (2008), the insurance industry has been resilient
in the face of the continuous shocks of the financial system for the reason that the
business model of the insurance industry is different from other financial services
providers, since it hasspecific characteristics and, furthermore, since the management
of the assets and liabilities by insurers did protect this industry from the worst impacts
of the crisis. The origin of the current financial crisis is the credit crisis, and European
insurers had no significant exposure to credit risk, therefore, they were not directly
affected. However, the financial assets of the largest institutional investors suffered
depreciation, and insurance companies may have been affected due to the contagion
effect through increased claims, and the fall in the sale of insurance products because
of the economic downturn.
The economic downturn occurred due to a decline in the living standards with rising
unemployment and decreased wages of employees, as well as to the decrease in the
volume of activities, insolvency, bankruptcy and liquidation of many companies, which
also leads to a significant decrease in demand for insurance. (Kocovic et al., 2011).
According to Sebastian Schich (2009), in a crisis context two contradictory situations
may exist: on the one hand, the decline in real activity and household wealth will have
an adverse effect on the demand for the some types of insurance products and thus a
reduction in subscription revenues. The insurance fraud could increase in such
circumstances. On the other hand, a positive factor is that the loss of confidence and
5
concerning the demand of various insurance products. It can be a beneficial
development for companies that offer these products.
The insurance industry has been affected by the financial crisis in two ways: in the
short term, through the high pressure on the asset side of the balance sheet and, in
the long term, by the negative effects of the prolonged economic downturn. The
effects manifested directly in investment losses are due to a decline in market value of
investments by insurance companies, and also to the failure of insurers of debt
instruments (borrowers) to pay the principal and/or interest. In December 2008, the
direct effects of the crisis had already cost insurers more than $150 billion. There were
large losses in insurance stocks because of the volume of write-offs and lower
profitability. The Dow Jones Stoxx Insurance Index fell by 57% between December
2007 and November 2008. Therefore, the hedging has become more expensive due to
high volatility and possible instability of financial counterparties. (Leisten et al., 2008)
(Kocovic et al., 2011)
The insurance companies most affected by the crisis were the American International
Group (AIG), Swiss Re and Yamato Life Insurance. AIG had losses of almost $62 billion
partly related to liquidity crisis due to large positions with Credit Default Swaps linked
to mortgage debt, and was intervened by the Federal Reserve Support. Swiss Re had
write-downs due to reinsurance in credit portfolios. Yamato life insurance was
declared insolvent due to severe risk management failures in asset management and
had losses in the subprime area and other losses due to high investment in equities.
6
The effects of the crisis in the insurance industry are somewhat different in the life and
non-life business. The major consequences that CEA (2009) points out concerning the
life insurance industry are: life products lost market to banking products that have high
returns and fewer investments in unit-linked products because of the drop in stock
markets. Non-life insurance has lost underwriting capacity due to write-offs and low
asset returns, and leads to higher prices in order to restore capacity and revenue
stabilization. These price increases may not be efficient if clients switch to cheaper
distribution routes. One of the effects of the crisis that has hurt insurers was the
decrease in sales of new cars and houses. In the present economic situation on mature
markets is unlikely that inflation takes place, but with deflation it is capable of improve
profitability and reduces claims. Insurers will experience cost pressures due to strong
competition. However, the non-life insurance is capable of being less affected than life
insurance by the financial crisis because the non-life companies make fewer
investments and through the technical results can balance asset returns. (Leisten et al.,
2008)
In non-life insurance (Kamiya, Shinichi 2013), the loss of premiums for property and
liability insurance can be explained by the decline in the availability of credit to the
private sector. The stagnation of long term in investments externally funded by the
private sector can be the reason for the drag on the consumption of property and
liability insurance.
According to Baluch et al. (2010), in time of crisis, the non-life insurance claim levels
7
exaggerated claims and more claims about trivial losses, which would go unclaimed in
better times. To maintain profitability, the insurers have to cut costs because of the
inevitable reduction in demand.
However, new business opportunities appear in times of crisis. In previous crises,
insurers have found good business options that went through an organic growth,
merge and acquisitions. Normally, it is at a later stage of the crisis that acquisitions
happen because balance-sheet weaknesses are more evident. Out of the crisis, certain
opportunities appear allowing companies to grow organically due to a change in
demand and to weakened or distracted competition. Customer priorities tend to
change with the financial crisis and they become more concerned with the security
that is the core promise of insurance. For example, during the crisis of the Great
Depression and the German Hyperinflation, the products of insurance companies were
regarded as safe heavens, therefore sales increased. In this current crisis, traditional
life insurance proves to be resilient for the same reason, and strict regulations have
forced this type of insurance to be kept rather conservative. If insurers offer products
related to crisis demand, for example if they sell products that protect against
inflation, these companies may grow. (Kuhlmann, Felix et al., 2009)
2.2. Determinants of insurance profitability
Profitability is an important indicator of the performance of any company. In the
8
defined as liquid result divided by total assets, and return on equity (ROE) defined as
liquid result divided by equity capital.
In the studies conducted by Almajali et al. (2012), Boadi et al. (2013), Malik (2011) and
Mehari et al. (2013), they used multiple regression analysis where the dependent
variable was the ROA, and independent variables were leverage, liquidity, tangibility of
assets, size of companies, loss ratio (risk), premium growth, age of companies, and the
management competence index.
Leverage can be determinate through the ratio of total debt to equity. It is possible
with this ratio to realize how much money the company borrows. Companies highly
leveraged may be at risk of bankruptcy in case they are unable to pay their debts. If
leverage is used properly, this can bring advantages such as increase the shareholders
return on investment and tax advantages associated with borrowing (Almajali et al.,
2012).
The studies conducted by Mehari and Aemiro (2013), Malik (2011), Boadi et al. (2013),
and Almajali et al. (2012) show that the independent variable leverage has a significant
relationship with financial performance. The results obtained by Mehari and Aemiro
(2013), Almajali et al. (2012) are that leverage has a positive relationship with financial
performance. For Mehari and Aemiro (2013), the result indicates that high financial
leverage companies have better performance than companies with low financial
leverage in Ethiopia. However, Almajali et al. (2012) interpreted the result stating that
the insurance companies should enhance their concentration on the debt and borrow
9
leverage was negatively related to profitability. On the other hand, the result of the
study conducted by Boadi et al. (2013) indicates that although the relationship is
positive, it is insignificant since, everything being equal, a change in leverage will have
a weak effect on profitability.
Several authors disagree in the form of measuring the size of the company. Malik
(2011), Mehari and Aemiro (2013), determine the size of a company by a natural log
of total assets, while Boadi et al. (2013) use log of premiums earned and ultimately
Almajali et al. (2012) the value of total assets.
Size is an important variable because it affects the financial performance in many
ways. In the event of an adverse market fluctuation, large companies have a greater
capacity than smaller companies; another reason given is that large insurers can more
easily recruit able employees with professional knowledge than smaller insurers, and
finally large insurers have economies of scale in terms of the labour cost. (Mehari and
Aemiro, 2013)
According to Malik (2011), Almajali et al. (2012), Mehari and Aemiro (2013) size is
found to be statistically significant and positively related to ROA. The results obtained
by Almajali et al. (2012) suggest that insurance companies, in order to get better
financial performance, have to increase their volume of assets due to the positive
relationship between size and financial performance.
Liquidity is determined by the relationship between current assets to current liabilities
(current ratio). This shows the degree to which debt obligations, to be due in the next
10
liquidity not only shows the ability to convert an asset into cash but also the ability of
the company to manage working capital at normal levels (Liargovas and Skandalis,
2010). According to Mehari and Aemiro (2013), insurance companies that have more
liquid assets can realize cash in difficult periods, and so are unlikely to fail. The
companies with more liquid assets could outperform the others with less liquid assets.
The results of the regressions performed by Boadi et al. (2013), Mehari and Aemiro
(2013) show that liquidity has a positive relationship with ROA, but that it is
statistically insignificant. Boadi et al. (2013) suggested that whenever current assets
pay current liabilities there is a direct impact on profitability even though this one may
be insignificant. On the other hand, Almajali et al. (2012) found that liquidity has a
significant statistical impact on financial performance of insurance companies, and
suggested that companies should decrease current liabilities and increase current
assets, due to the positive relationship between liquidity and financial performance.
The age of a company is determined by the number of years from its date of
establishment. Old insurance companies may not be aware of changes in the market
and thus develop their own routines leading to an inverse relationship between age
and profitability. However, insurance companies can benefit from the age factor due
to the effects of reputation, while earning high margins on sales. (Liargovas and
Skandalis, 2010).
The studies performed by Mehari and Aemiro (2013), Almajali et al. (2012), and Malik
(2011) show that age and profitability have a negative relationship but a statistically
11
industry should not concern themselves with the variable age, as this one does not
influence the performance.
The Management Competence Index may be determined by the ratio of net income to
the number of professionals. In “The Insurance Competency Framework” (CII, 2013)
competency is defined “as the knowledge and skills that individuals must have to
perform effectively at work”. This study emphasizes the importance that individuals
should know and understand their own organization, the insurance market place, and
their customers, in order to meet their needs. It is also important for the individuals to
know how to have an effective communication, manage the information, place and
organize accordingly to the business requirements, manage people, and have
negotiating and persuasive skills.
In the study conducted by Almajali et al. (2012), the management competence index
has a significant relationship with the financial performance, and the authors
suggested that it is important to have highly qualified employees.
Tangibility of assets may be determined by the ratio of fixed assets to total assets. The
empirical analysis done by Mehari and Aemiro (2013) revealed that tangibility has a
statistically significance and that it is positively related to the financial performance.
The results show that the insurance companies, which have a high proportion of fixed
assets to the number of total assets, turn out to have a significant and positive impact
12
However, in the study conducted by Boadi et al. (2013), tangibility has a negative
significant relationship with financial performance. The authors conclude that with an
increase in tangibility, profitability will decline because of this inverse relationship.
Loss Ratio may be determined by the ratio of incurred claims to earned premiums and
this ratio is used to measure the risk of insurance companies. According to Malik
(2011), Mehari and Aemiro (2013), this variable has a significant and negative
relationship with financial performance. Mehari and Aemiro (2013) found that good
standards of management should be applied when insurers underwrite risky business
to protect the companies from underwriting losses and maximize returns on invested
assets. The performance of insurance companies might be affected if the insurers are
excessively risk-taking people.
Premium growth may be determined by a percentage change in premiums earned.
According to Mehari and Aemiro (2013), premium growth estimates the market
penetration, and if the insurers are too obsessed with growth, it may lead to
self-destruction when other important objectives are forgotten. These authors found that
growth in writing premiums has a positive relationship with financial performance but
that it is statistically insignificant.
Boadi et al. (2013) suggested that the independent variables should be regressed on
13
3. Characterization of the non-life insurance industry in Portugal
Since our empirical analysis is focussed on just a part of the insurance industry, we will
in this point, present and discuss some data about the non-life insurance industry with
the expectation that this characterizations can lead us to a better understanding of our
results.
3.1 Aggregate non-life insurance industry
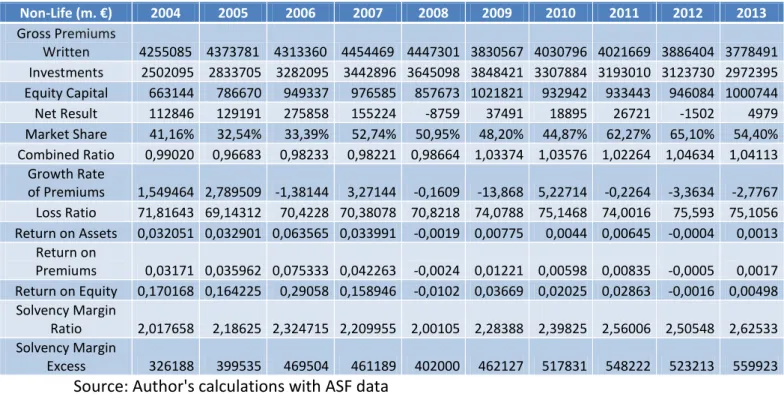
Table 1- Main activity indicators
Source: Author's calculations with ASF data
In the table 1, we present some activity indicators for the period 2004-2013, that allow
us to conceive a picture of the non-life insurance companies operations in Portugal in
these years.
Non-Life (m. €) 2004 2005 2006 2007 2008 2009 2010 2011 2012 2013
Gross Premiums
Written 4255085 4373781 4313360 4454469 4447301 3830567 4030796 4021669 3886404 3778491 Investments 2502095 2833705 3282095 3442896 3645098 3848421 3307884 3193010 3123730 2972395 Equity Capital 663144 786670 949337 976585 857673 1021821 932942 933443 946084 1000744 Net Result 112846 129191 275858 155224 -8759 37491 18895 26721 -1502 4979 Market Share 41,16% 32,54% 33,39% 52,74% 50,95% 48,20% 44,87% 62,27% 65,10% 54,40% Combined Ratio 0,99020 0,96683 0,98233 0,98221 0,98664 1,03374 1,03576 1,02264 1,04634 1,04113
Growth Rate
of Premiums 1,549464 2,789509 -1,38144 3,27144 -0,1609 -13,868 5,22714 -0,2264 -3,3634 -2,7767 Loss Ratio 71,81643 69,14312 70,4228 70,38078 70,8218 74,0788 75,1468 74,0016 75,593 75,1056 Return on Assets 0,032051 0,032901 0,063565 0,033991 -0,0019 0,00775 0,0044 0,00645 -0,0004 0,0013
Return on
Premiums 0,03171 0,035962 0,075333 0,042263 -0,0024 0,01221 0,00598 0,00835 -0,0005 0,0017 Return on Equity 0,170168 0,164225 0,29058 0,158946 -0,0102 0,03669 0,02025 0,02863 -0,0016 0,00498 Solvency Margin
Ratio 2,017658 2,18625 2,324715 2,209955 2,00105 2,28388 2,39825 2,56006 2,50548 2,62533 Solvency Margin
14
From 2004 to 2009, the total value of investments recorded a successive growth year
after year. However, from 2010 to 2013, there was a decrease in the amount of
investments, thus taking a more conservative position due to strong concerns about
stability and security. The factors that contributed to this disinvestment are changes in
financial markets, the public debt crisis in the eurozone and the austerity measures
adopted in Portugal.
From 2004 to 2007, equity capital grew due to an expansion of revaluation reserves,
and improvement of the activity operating conditions with results of the exercise,
retained results and reserves. In 2008, the decrease of equity capital was due to the
context of the financial crisis and to the implementation of the regulations compatible
with International Accounting Standards (IAS/IFRS). The fluctuations recorded in equity
capital, in 2009 and 2010, were due the behaviour of the revaluation reserves that
records changes in the fair value of assets held for sale. In 2011 and 2012, equity
capital increased slightly, yet it was in 2013 that there was a substantial growth. This
was due in part to a positive development of the revaluation reserves, which highlights
the recovery of financial markets.
During the period we are analyzing, the non-life net result recorded the worst amounts
in 2008 and 2012. In 2008, the depreciation of capital markets contributed to the
affirmation of the international financial crisis that quickly spread to the real economy.
In Portugal, the economy showed signs of stagnation with the decrease in both public
and private consumption, exports and investment. In the non-life insurance activity,
15
and progress of claims. In addition to the unfavourable macroeconomic environment,
it was in the year 2008 that Portugal started to apply regulations compatible with the
International Accounting Standards (IAS/IFRS), which led to a degradation of the net
profit as the direct data in results of potential impairments, and losses of assets
established volatility in the results. In 2012, Portugal faced a worsening
macroeconomic crisis with the increase of the unemployment rate, the budget
difficulties of families and the state, restraint on wages, and strong competitive
pressure. The non-life net result recorded in 2012 was due to the deterioration of
some branches more sensitive to the macroeconomic variables with the degradation
of some indicators as the combined ratio, the loss ratio and growth rate of premiums.
The non-life market share was calculated using the non-life gross written premiums
divided by the insurance sector gross written premiums. The structure of the insurance
sector market shares changed due to an unfavourable situation, life insurance loses
importance with the fall of market share to less than 50%, since it was subjected to the
volatility in financial markets and competition from other institutions in the market of
savings. The non-life insurance gained more importance in recent years having had a
market share of over 50%.
The combined ratio is calculated by adding the cost with claims net of reinsurance with
net exploration costs divided by premiums earned net of reinsurance. A decrease in
the combined ratio means that the financial results are improving and an increase
means that the financial results are deteriorating; the smaller ratio is the better. This
16
monitors the effectiveness of price and the efficiency of the underwriting process. If
the ratio is less than 100%, the underwriting process is effective because the premium
covers payments. The underwriting process incurs in losses when the premiums are
not sufficient to cover the payments, being the ratio above 100%. From 2004 to 2008,
the underwriting process was profitable as the combined ratio recorded values below
100%. From 2009 to 2013, the combined ratio exceeded 100% incurring losses of
subscription, the main branches that contribute to this situation are in the automobile
industry (reduction of the number of insured vehicles, their covers and drop in road
traffic); disease (development of private health insurance and the deterioration of the
National Health Service); work accidents (complex due to the payment of annuities to
individuals with high permanent disability or to the heirs of deceased individuals); fire
and other damages (occurrence of extreme events).
In recent years, with exception of 2010, there was a contraction in the growth rate of
premiums that were felt with more intensity in branches that were more sensitive to
economic variables but that did not inhibit the moderate growth of others.
The loss ratio is calculated by the costs with claims, net of reinsurance divided by
earned premiums, net of reinsurance. The lower the loss ratio the better. Higher loss
ratios can show that an insurance company may need better risk management policies.
In 2008, 2009, and 2010, this ratio showed a considerable deterioration due to the
increase in the cost with claims and decrease in earned premiums because of fragile
macroeconomic performance and intense competitive activity that originated tariff
17
this ratio due to the contributions of the fire and other damages branch not having
faced particularly severe events and the fact that the automobile branch faced a fall in
frequency claims due to an overall reduction of road traffic.
Return on Assets (ROA) is calculated by net income divided by total assets, in other
words, it shows the profitability in relation to its assets. Return on Premiums (ROP) is
calculated by net income divided by earned premiums. Return on Equity (ROE) is
calculated by net income divided by equity capital, namely, this indicator allows us to
know how much profit the non-life business can generate with the money that
shareholders have invested. These three indicators ROA, ROP, ROE had a negative
return in 2008 and 2012, due to the fact that the net result was negative in those
years.
The solvency margin of insurance companies should be sufficient for all the activities. It
is an additional protection when the technical provisions are insufficient to assume all
of the responsibilities assumed by the insurer. The solvency margin ratio is calculated
by the available solvency margin divided by the required solvency margin. An excess
solvency margin is calculated as the difference between the available solvency margin
and the required margin of solvency. The ratio of the non-life solvency margin
exceeded 200% in the period under analysis, where it ends up confirming that the
non-life insurance industry has a solid and robust business. In 2013, the ratio of the non-non-life
solvency margin, reached 262%, with 559923 m. € of excess solvency margin, which is
the top value in the period under analysis and this improvement is due partly to the
18
The non-life insurance industry has progressed according to the current situation
where the effects of the deterioration in economic activity were noted, which forced
the industry to strengthen its risk management policies. However, the reinforcement
of equity led to an improvement in the solvency margin for comfortable values, which
showed a high level of resilience of the sector when confronted with the financial
19
4. Empirical Application
One of the most important objectives in financial management is profitability. The
definition of profitability is the level of returns from profit. It is crucial to identify the
factors that play an essential role in influencing the profitability of insurance
companies, and therefore help these same companies to take actions in order to
increase their profitability.
4.1 Data collection and Descriptive Statistics
The sample of this study consists in 15 non-life insurance companies in Portugal during
2004-2013. Others non-life insurance companies are excluded since they were recently
established and their market share is very small (see table 4). All the data was
collected from ASF (Autoridade de Supervisão de Seguros e Fundos de Pensões).
Tables 5-13 report the descriptive statistics of the variables used in the regression
analysis. Descriptive statistics produced the mean, median, maximum, minimum,
standard deviation, as well as the coefficient of variation for each variable. The analysis
of the data shows evolutions and trends of our variables. The study conducted on ROA
reached his minimum of -12.37% in 2011, and his maximum of 16.47% in 2006. While
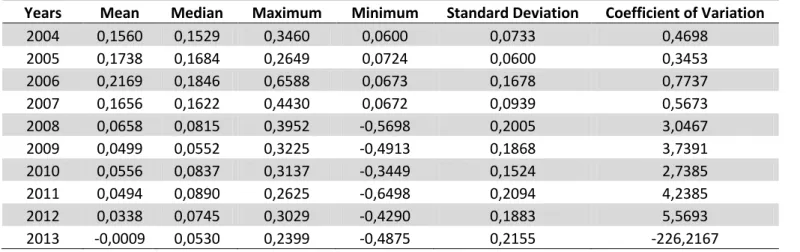
ROE reached his minimum of -64.98% in 2011, and his maximum of 65.88% in 2006.
Looking at the table 7 of the independent variable leverage, the highest mean
obtained has 7.29% in 2008, thus can be explained by the fact that we are at the
20
For the independent variable size, we can verify that the non-life insurance companies
have grown in size during the period in analysis because annual mean increased
through the years.
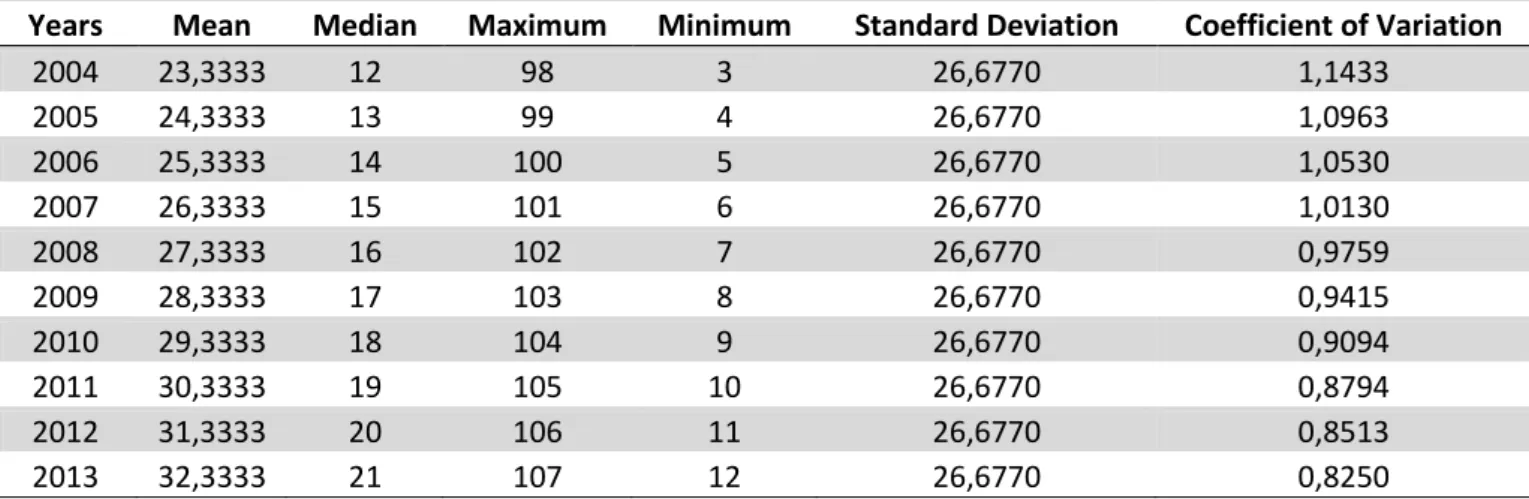
For the independent variable age, the maximum of 107 reached in 2013 corresponds
to the oldest insurance company in analysis – Allianz, while the minimum corresponds
to the youngest insurance company in analysis - Victoria Seguros.
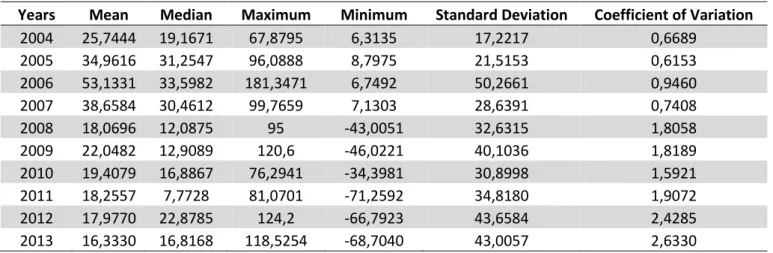
For the independent variable management competence index, the maximum value of
181 was reached in 2006 and the minimum value of -71 was reached in 2011. The
indicators of net result and number of employees experienced significant oscillations
in the crisis period.
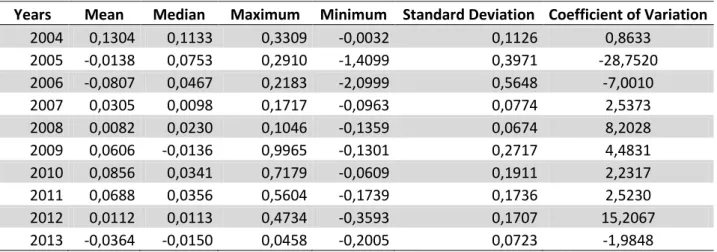
For the independent variable premium growth, the mean presented significant
oscillations that could be justified by the contraction of average tariff levels of
insurance.
For the independent variable loss ratio, from 2008 the maximum and minimum values
was increased which can be explained by the deterioration that this ratio suffered due
to macroeconomic performance and strong competition.
For the independent variable tangibility, the maximum value of 0.1848 was reached in
2004 due to the fixed assets, which recorded the highest value in that year for the
21
4.2 Methodological Approach and Variables
Following the approach of Mehari and Aemiro (2013), Malik (2011), Boadi et al. (2013),
and Almajali et al. (2012), we define the model ROA to be tested that as presented
bellow. Although in the various studies we did not find any author that tests the ROE.
We also tested ROE as a dependent variable.
Where: ROA = Return on Assets; ROE= Return on Equity; Lev=Leverage; SZ= Size; AG=
Age; MCI= Management Competence Index; PG= Premium Growth; LR= Loss Ratio;
TANG= Tangibility; are parameters to be estimated, the error
term, where denotes the unobservable individual-specific effect, denotes the
reminder disturbance(an error term); is an insurance company fixed effects, the error term, i = insurance companies i=1, 2,…, 15 and t = index of time periods t=
22
The study used Return on Assets (ROA) and Return on Equity (ROE) to measure the
performance of non-life insurance companies:
Return on Assets (ROA): is calculated by a liquid result divided by total assets. This
indicator shows us how profitable a company is relative to its total assets. ROA gives
an idea as to how efficient management is at using its assets to generate earnings.
Return on Equity (ROE): is calculated by a liquid result divided by equity capital. The
amount of net income returned as a percentage of shareholders equity. Return on
equity estimates a company's profitability by revealing how much profit a company
generates with the money shareholders have invested. Based on the arguments
presented in the literature review, the expected relationship between profitability of
insurance companies and explanatory variables could be presented as follows:
Table 2- Expected Effects
Determinants Description Expected Effect
Leverage Ratio of total debt to equity +
Size Total Assets +
Age Number of years from its date of establishment
- Management Competence
Index
Ratio of profit to number professional
+ Premium Growth Percentage change in
premiums earned
+ Loss Ratio Ratio of incurred claims to
earned premiums
- Tangibility Ratio of fixed assets to total
assets
23
The method applied to determine the relationship between the profitability and the
independent variables was random effects on ROA and fixed effects on ROE. A panel
data methodology was used due to the nature of time series. The software chosen to
perform this study was Gretl.
In order to decide between a fixed and a random effects regression model, we ran
three tests which are tests of joint significance of differing group means,
Breusch-Pagan and Hausman, to decide what should be the most appropriate method.
For ROA:
Using the F-statistic we tested if the pooled OLS is adequate, since
p-value=2.127x <0.05. We reject the null hypothesis, so that indicates to us a fixed
effects model as an alternative.
Using the Breusch Pagan test, we tested to know if the Pooled OLS is adequate, since
p-value=5.931x <0.05, we reject the null hypothesis, so that indicates to us a
random effects as an alternative.
Using the Hausman test, we determined if the random effects alternative is adequate.
Since p-value=0.453>0.05, we did not reject the null hypothesis that would lead us to
use a random effects model.
After making these 3 tests for ROA, we concluded that the model to be used should be
the one of variable effects. (we used as level of significance, but in fact the
24
For ROE:
Using the F-statistic we tested to determine if the pooled OLS is adequate, since
p-value=6.7039x <0.05. We reject the null hypothesis, so that indicates to us a fixed
effects model as an alternative.
Using the Breusch Pagan test, a -stat, we test if the Pooled OLS is adequate, since
p-value=1.54707x <0.05, we rejected the null hypothesis so that indicates to us a
random effects as an alternative.
Using the Hausman test, we tested to determine if the random effects alternative is
adequate, since p-value=0.00399<0.05, we rejected the null hypothesis so that
indicates to us that we should use a fixed effects model.
After making these 3 tests for ROE, we concluded that the model to be used should be
the fixed effects one. (we used as level of significance, but in fact the tests
are valid for the 3 usual significance levels: 0.01. 0.05 and 0.1).
Multicollinearity was checked for these two models with a Variance Inflation Factor
(VIF), and no evidence of a multicollinearity problem was found in the models (see
table 14).
25
4.3 Results
In most of the cases, the results confirmed and behaved accordingly to what is
expected (see tables 3, 15, 16).
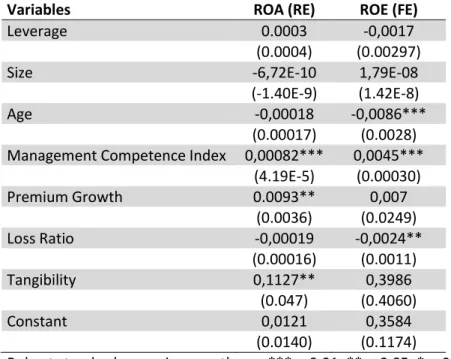
Table 3 - Regression Results from 2004 to 2013
Variables ROA (RE) ROE (FE)
Leverage 0.0003 -0,0017
(0.0004) (0.00297)
Size -6,72E-10 1,79E-08
(-1.40E-9) (1.42E-8)
Age -0,00018 -0,0086***
(0.00017) (0.0028) Management Competence Index 0,00082*** 0,0045***
(4.19E-5) (0.00030)
Premium Growth 0.0093** 0,007
(0.0036) (0.0249)
Loss Ratio -0,00019 -0,0024**
(0.00016) (0.0011)
Tangibility 0,1127** 0,3986
(0.047) (0.4060)
Constant 0,0121 0,3584
(0.0140) (0.1174) Robust standard errors in parentheses ***p<0.01, **p<0.05, *p<0.1 ROA – random effects model; ROE – fixed effects model.
In both models, any of the assumptions was violated.
0.6215 0.2394
Leverage: The findings of this study show that there is a positive relationship between
leverage and ROA, but that it is statistically insignificant. Boadi et al. (2013) also found
the same result. Leverage, however is found to be negatively related to ROE but
statistically insignificant. These results can indicate that non-life insurance companies
26
the end, and lead to high profit level. These insurers are in a scenario far from
bankruptcy.
Size: This variable had a statistically insignificant negative impact on ROA. However, for
ROE, it had a statistically insignificant positive impact. For both, ROE and ROA, the
coefficient is very close to zero. These findings could be due to the fact that the
insurance companies changed their priorities because it became more important for
them to survive during the financial crisis then to increase profitability. Managers
shifted their focus from profit maximization to managerial utility maximization.
Age: The age variable is found to have a negative and a statistically insignificant
relationship with ROA, which is consistent with the studies performed by Mehari and
Aemiro (2013), Almajali et al.(2012), Malik (2011). As Almajali et al.(2012) suggested,
new entrants in the insurance industry should not worry about this factor. However,
this variable had a statistically significant negative impact on ROE at 1 percent level.
The oldest insurance companies can develop certain routines and not follow the
changes that are occurring in the market, so that they can develop this inverse
relationship with profitability.
Management Competence Index: This variable has a positive and significant statistical
effect on the financial performance of insurance companies (both ROA and ROE). This
finding is consistent with Almajali et al. (2012) and we have found and the authors had
suggested that it is important to have highly qualified employees. Through this
indicator, it is possible to verify the importance of the relationship between effective
27
Premium Growth: This variable had a statistically positive significant impact at 5
percent level on ROA, which could be related to the market share expansion in the
non-life insurance of the last years. However, premium growth is found to be positively
related to ROE, but statistically insignificant, which is consistent with the study of
Mehari and Aemiro (2013). Insurers should work towards improving the premiums
earned, because this would mean better reserves that would help maintain liquidity
and assist to operate in times of large unexpected claims.
Loss Ratio: From the regression analysis, the loss ratio is found to be negatively to ROA
but statistically insignificant. For ROE, however, this variable has a negative statistically
significant relationship. The loss ratio has a negative influence on the insurance
financial performance, since taking an excessive risk can affect the company’s stability
through higher expenses, therefore it is important to apply good standards of
management to protect insurance companies.
Tangibility: The study revealed that there is a positive significant relationship between
tangibility and ROA, which is consistent with the findings of Mehari et al. (2013). If the
insurance companies have a high proportion of fixed assets it turns out to have a
significant and positive impact on performance. If an insurance company has higher
composition of fixed assets, it is possible to get more debts at a lower interest rate.
However, the regression analysis also showed that there is a positive insignificant
28
Insurers should see the time of crisis has an opportunity to grow and pay close
attention to the variables with significant effects on the performance and the
29
CONCLUSION
The aim of this study was to understand the impact that the crisis had on the non-life
insurance industry, and to explain which and how the determinants presented affected
the profitability of Portuguese insurers during the period 2004-2013.
The financial analysis made to the non-life insurance industry clearly shows that this
one had to face some challenges such as the slowdown in economic activity, market
volatility, reduced household disposable income and companies, but that,
nevertheless, has presented a high resilience demonstrated by the increased solvency
levels.
The findings of this paper contribute to a better understanding of the financial
performance in non-life insurance companies in Portugal.
Following the approach of Mehari and Aemiro (2013), Malik (2011), Boadi et al. (2013),
and Almajali et al. (2012), we define the model ROA to be tested that as presented
bellow. Although in the various studies we did not find any author that tests the ROE.
We also tested ROE as a dependent variable.
The financial performance of the non-life insurance companies was measured with the
use of ROA following the approach of some authors and we also include ROE. Through
30
management competence index, tangibility, loss ratio, premium growth had on the
dependent variables.
The main conclusions of this research are: 1) the importance of having highly qualified
employees that know and understand their own organization, the insurance market
place, and their customers; 2) insurers changed their priorities because it became
more important to survive during the financial crisis then to increase profitability; 3)
old insurers may not be aware of the changes that occur in the market and thus
develop certain routines; 4) good standards of management should be applied to
protect insurance companies from excessive risk taking; 5) it is suggested that insurers
should work towards improving the premiums earned for maintaining liquidity and
having better reserves; 6) non-life insurance companies could attract more clients,
increase their premiums and lead to a high profit level due to the fact that they had a
low leverage; 7) an insurance company with a higher composition of fixed assets, can
get more debts at a lower interest rate.
To sum up our results are in line with other authors evidence in what concerns to the
determinants of insurance companies performance. In face of these results,
Portuguese non-life insurance companies might look with particularly attention to
variables premium growth, age, loss ratio, tangibility and management competence
index, because those are variables with significant effects on the performance. The
insurance companies should improve the growth of premiums in order to obtain
31
namely, should set prices, premiums and take risks that allow combined ratios below
1.
It is essential to understand the dynamics of the loss ratio, in particular the importance
of imposing premiums that covers the risks assumed, not yielding to fierce competition
policies with a strong destructive potential.
Insurance companies must have aligned enhancers and human resources policies with
the strategy, because the knowledge and competence of human resources are decisive
factors for performance.
For further analysis, we would like to highlight the possible use of external variables in
32
REFERENCES
Almajali, A., Alamro, S. & Al-Soub, Y. (2012). Factors affecting the financial
performance of Jordanian Insurance Companies Listed at Amman Stock Exchange.
Macrothink Institute
Baltagi, Badi (2013). Econometric analysis of panel data. Wiley. Fifth Edition
Baluch, F., Mutenga, S. & Parsons, C. (2010). Insurance, Systemic Risk and the Financial
Crisis. International Insurance Society
Bell, M. (2008). The 2007-08 Financial Crisis – An Insurance Industry Perspective. Zurich
Boadi, E., Antwi,S. & Lartey, V. (2013). Determinants of profitability of insurance firms
in Ghana. International Journal of Business and Social Research, Volume 3, No.3
Brainard, L. (2008). What is the role of insurance in economic development?. Zurich
Eling, M. & Schmeiser, H. (2009). Insurance and the Credit Crisis: Impact and Ten
Consequences for Risk Management and Supervision. Fakultat fur Mathematik und
Wirtschaftswissenschaften Universitat ULM
Haiss, P. & Sumegi, K. (2006). The Relationship of Insurance and Economic Growth – A
Theoretical and Empirical Analysis. Europe Institute, University of Economics and
Business Administration Vienna
Impavido, G. & Tower,I. (2009). How the Financial Crisis Affects Pensions and Insurance
33
Kamiya, S. (2013). The impact of banking crises on non-life insurance consumption.
Asia Insurance Review
Kocovic, J., Kocovic, M. & Jovovic, M. (2012). Impact of global financial crisis on
insurance industry in selected Western Balkan Countries. European Integration Process
in Western Balkan. Faculty of Economics of the University of Coimbra. Chapter 36, vol.
1, pp 708-725
Kocovic, J., Rakonjac, T. & Jovovic, M. (2011). The impact of the global financial crisis
on the structure of investment portfolios of insurance companies“. Economic Annals,
Vol. LVI, No. 191, p. 147.
Kuhlmann, F., Kuenen, J. & Stange, A. (2009). Collateral Damage: Industry Focus:
Drawing Lessons from the Past to Chart a Course for Insurers. The Boston Consulting
Group.
Leisten, H., Kuhlmann, F., Brat, E., Stange, A., Tischhauser, P., Freese, C., Kuenen, J. &
Boyer-Chammard, C. (2008). Collateral Damage: Industry Focus: Actions for Insurers
amid the Global Financial Crisis. The Boston Consulting Group.
Liargovas, P., & Skandalis, K. (2008). Factors affecting firms financial performance: The
Case of Greece. University of Peloponnese.
Lobo, E. (1996). Avaliação de companhias de seguros de vida. Instituto Superior de
Economia e Gestão
Malik, H. (2011). Determinants of insurance companies’ profitability: an analysis of
34
Mehari, D., & Aemiro, T. (2013). Firm specific factors that determine insurance
companies’ performance in Ethiopia. European Scientific Journal, Edition vol. 9, no. 10
Schich, S. (2009). Insurance Companies and the Financial Crisis. OECD Journal: Financial
Market Trends, Volume 2009, Issue 2
Silva, C. (2000). Da Economia e da Gestão nas Empresas de Seguros. Vida Económica
Silva, C. (2000). Intermediação Financeira: Sistema Financeiro, Mercado Bancário e
Mercado de Seguros. Montepio Geral
(2008). Eight key messages on the financial turmoil. CEA Insurers of Europe
(2009). European Insurance in Figures : Statistics nº37. CEA Insurers of Europe
(2013). The Insurance Competency Framework. The Chartered Insurance Institute
Other References
Autoridade de Supervisão de Seguros e Fundos de Pensões – http://www.asf.com.pt/
35
APPENDIX
Table 4 – Market Share of 15 non life insurance companies
Gross Written Premiums 2013
Açorena 267041
Allianz 311351
Fidelidade 1009596
Liberty 241142
Axa Seguros 290610
Bes Seguros 71059
Cares 2891
Crédito Agrícola Seguros 80630
Europ Assistance 3890
Lusitania Seguros 169111
Mapfre Gerais 86417
Ocidental Seguros 228668
Tranquilidade 319513
Via Directa 41696
Victoria Seguros 79472
Total 15 insurance companies 3203087
Total non life sector 3778491
36
Table 5 – Descriptive Statistics for Dependent Variable ROA
Years Mean Median Maximum Minimum Standard Deviation Coefficient of Variation
2004 0,0271 0,0229 0,0554 0,0084 0,0151 0,5566
2005 0,0326 0,0309 0,0764 0,0105 0,0174 0,5351
2006 0,0440 0,0317 0,1646 0,0081 0,0394 0,8957
2007 0,0309 0,0282 0,0748 0,0085 0,0180 0,5829
2008 0,0120 0,0090 0,0572 -0,0696 0,0281 2,3304
2009 0,0162 0,0133 0,0655 -0,0284 0,0266 1,6410
2010 0,0125 0,0103 0,0831 -0,0589 0,0324 2,5732
2011 0,0114 0,0200 0,0761 -0,1236 0,0425 3,7181
2012 0,0145 0,0171 0,1086 -0,0630 0,0419 2,8928
2013 0,0117 0,0116 0,0946 -0,0454 0,0371 3,1676
Table 6 – Descriptive Statistics for Dependent Variable ROE
Years Mean Median Maximum Minimum Standard Deviation Coefficient of Variation
2004 0,1560 0,1529 0,3460 0,0600 0,0733 0,4698
2005 0,1738 0,1684 0,2649 0,0724 0,0600 0,3453
2006 0,2169 0,1846 0,6588 0,0673 0,1678 0,7737
2007 0,1656 0,1622 0,4430 0,0672 0,0939 0,5673
2008 0,0658 0,0815 0,3952 -0,5698 0,2005 3,0467
2009 0,0499 0,0552 0,3225 -0,4913 0,1868 3,7391
2010 0,0556 0,0837 0,3137 -0,3449 0,1524 2,7385
2011 0,0494 0,0890 0,2625 -0,6498 0,2094 4,2385
2012 0,0338 0,0745 0,3029 -0,4290 0,1883 5,5693
37
Table 7 – Descriptive Statistics for Independent Variable Leverage
Table 8 – Descriptive Statistics for Independent Variable Age
Years Mean Median Maximum Minimum Standard Deviation Coefficient of Variation
2004 23,3333 12 98 3 26,6770 1,1433
2005 24,3333 13 99 4 26,6770 1,0963
2006 25,3333 14 100 5 26,6770 1,0530
2007 26,3333 15 101 6 26,6770 1,0130
2008 27,3333 16 102 7 26,6770 0,9759
2009 28,3333 17 103 8 26,6770 0,9415
2010 29,3333 18 104 9 26,6770 0,9094
2011 30,3333 19 105 10 26,6770 0,8794
2012 31,3333 20 106 11 26,6770 0,8513
2013 32,3333 21 107 12 26,6770 0,8250
Years Mean Median Maximum Minimum Standard Deviation Coefficient of Variation
2004 6,6483 7,0689 11,8566 2,7064 2,7418 0,4124
2005 6,3510 6,5609 11,2119 2,8050 2,9561 0,4654
2006 6,0485 5,8613 10,9806 2,8110 2,8645 0,4735
2007 6,1899 5,6705 11,1355 2,9749 2,8495 0,4603
2008 7,2900 5,7713 23,6823 1,9637 5,7472 0,7883
2009 5,4640 4,5631 16,2415 1,8471 3,9505 0,7229
2010 6,1431 4,4629 23,5209 2,0170 5,8300 0,9490
2011 5,3184 4,4920 16,4886 2,3824 3,6975 0,6952
2012 4,1217 3,0383 8,7089 1,7884 2,2804 0,5532
38
Table 9 – Descriptive Statistics for Independent Variable Size
Years Mean Median Maximum Minimum Standard Deviation Coefficient of Variation
2004 831135,1 179686,4 7869568,8 21607,7 1972824,306 2,3736
2005 946668,9 234506 9061856 23892 2271584,841 2,3995
2006 1055453 239900 10205340 28917 2559223,452 2,4247
2007 1124807 231514 11081397 31401 2781230,468 2,4726
2008 1138428 252126,8 11386696 32072,43 2859201,084 2,5115 2009 1263521 221786,7 12879995 41693,99 3235959,096 2,5610
2010 1280026 211012 13058990 40085 3281900,299 2,5639
2011 1170564 205822 10953918 45080 2743530,634 2,3437
2012 1294211 221539 12841042 50053 3223610,659 2,4907
2013 1263490 223403 12627048 65398 3169717,71 2,5086
Table 10 – Descriptive Statistics for Independent Variable Management Competence Index
Years Mean Median Maximum Minimum Standard Deviation Coefficient of Variation
2004 25,7444 19,1671 67,8795 6,3135 17,2217 0,6689
2005 34,9616 31,2547 96,0888 8,7975 21,5153 0,6153
2006 53,1331 33,5982 181,3471 6,7492 50,2661 0,9460
2007 38,6584 30,4612 99,7659 7,1303 28,6391 0,7408
2008 18,0696 12,0875 95 -43,0051 32,6315 1,8058
2009 22,0482 12,9089 120,6 -46,0221 40,1036 1,8189
2010 19,4079 16,8867 76,2941 -34,3981 30,8998 1,5921
2011 18,2557 7,7728 81,0701 -71,2592 34,8180 1,9072
2012 17,9770 22,8785 124,2 -66,7923 43,6584 2,4285
39
Table 11 – Descriptive Statistics for Independent Variable Tangibility
Years Mean Median Maximum Minimum Standard Deviation Coefficient of Variation
2004 0,0695 0,04374 0,1848 0 0,0662 0,9537
2005 0,0586 0,0360 0,1835 0 0,0638 1,0881
2006 0,0519 0,0316 0,1512 0 0,0560 1,0790
2007 0,0482 0,0153 0,1471 0 0,0553 1,1464
2008 0,0430 0,0149 0,1444 0 0,0498 1,1584
2009 0,0385 0,0124 0,1311 0 0,0442 1,1469
2010 0,0371 0,0117 0,1275 0 0,0420 1,1328
2011 0,0349 0,0108 0,1374 0 0,0403 1,1553
2012 0,0351 0,0091 0,1440 0 0,0417 1,1891
2013 0,0357 0,0085 0,1476 0 0,0428 1,1994
Table 12 – Descriptive Statistics for Independent Variable Premium Growth
Years Mean Median Maximum Minimum Standard Deviation Coefficient of Variation
2004 0,1304 0,1133 0,3309 -0,0032 0,1126 0,8633
2005 -0,0138 0,0753 0,2910 -1,4099 0,3971 -28,7520
2006 -0,0807 0,0467 0,2183 -2,0999 0,5648 -7,0010
2007 0,0305 0,0098 0,1717 -0,0963 0,0774 2,5373
2008 0,0082 0,0230 0,1046 -0,1359 0,0674 8,2028
2009 0,0606 -0,0136 0,9965 -0,1301 0,2717 4,4831
2010 0,0856 0,0341 0,7179 -0,0609 0,1911 2,2317
2011 0,0688 0,0356 0,5604 -0,1739 0,1736 2,5230
2012 0,0112 0,0113 0,4734 -0,3593 0,1707 15,2067
40
Table 13 – Descriptive Statistics for Independent Variable Loss Ratio
Table 14 – Multicollinearity
Years Mean Median Maximum Minimum Standard Deviation Coefficient of Variation
2004 71,6879 71,1564 81,4219 54,2718 6,1986 0,0864
2005 72,1768 69,9077 90,7837 67,2835 5,8435 0,0809
2006 68,7728 70,9084 78,7959 42,9331 8,6950 0,1264
2007 67,9284 69,3604 86,5044 31,6493 11,7650 0,1731
2008 68,7274 68,2652 91,4638 30,1672 13,4091 0,1951
2009 71,7139 70,7276 88,2259 52,8454 7,8595 0,1095
2010 74,2503 74,1548 84,4175 58,7706 7,2356 0,0974
2011 73,2341 73,2397 87,4782 61,0762 6,7829 0,09261
2012 74,1080 73,1641 90,1153 60,0397 8,4811 0,1144
2013 74,5403 73,3047 94,6572 62,1464 9,0363 0,1212
Factores de Inflaccionamento da Variância (VIF) Valor minimo possivel = 1,0
Valores > 10,0 podem indicar um problema de colinearidade Leverage 1,597
Size 1,378 Age 1,158 MCI 1,417 Tangibility 1,089 LossRatio 1,350 PremiumGrowth 1,036
VIF(j) = 1/(1 - R(j)^2), onde R(j) é o coeficiente de correlação múltipla
entre a variável j e a outra variável independente Propriedades da matriz X'X:
norma-1 = 1,3271864e+015 Determinante = 1,424318e+035
41
Table 15 – Correlation Matrix for ROA
PremiumGro~h 0.0320 -0.0949 -0.0372 0.0085 -0.1170 0.0375 0.0187 1.0000 LossRatio -0.3479 0.0154 0.0587 -0.1065 -0.4785 0.1493 1.0000
Tangibility -0.1183 0.1806 -0.0016 0.1390 -0.1705 1.0000 MCI 0.7816 -0.1422 0.0389 0.0594 1.0000
Age -0.0579 0.3054 0.0411 1.0000 Size -0.1389 0.4784 1.0000
Leverage -0.2829 1.0000 ROA 1.0000
ROA Leverage Size Age MCI Tangib~y LossRa~o Premiu~h
Table 16 – Correlation Matrix for ROE
PremiumGro~h -0.0512 -0.0949 -0.0372 0.0085 -0.1170 0.0375 0.0187 1.0000 LossRatio -0.5163 0.0154 0.0587 -0.1065 -0.4785 0.1493 1.0000
Tangibility -0.1144 0.1806 -0.0016 0.1390 -0.1705 1.0000 MCI 0.8171 -0.1422 0.0389 0.0594 1.0000
Age 0.0317 0.3054 0.0411 1.0000 Size -0.0396 0.4784 1.0000
Leverage -0.1358 1.0000 ROE 1.0000