outubro de 2014
Universidade do Minho
Escola de Engenharia
Antónia Regina Sales Machado Gonçalves
UMinho|20
14
Ant
ónia R
egina Sales Mac
hado Gonçalv
es
Yarrowia lipolytica whole cells immobilization:
impact on citric acid production
Yarr owia lipolytica whole cells immobilization: impact on citric acid production
Dissertação de Mestrado
Mestrado em Bioengenharia
Trabalho efetuado sob a orientação da
Professora Doutora Isabel Maria Pires Belo
Antónia Regina Sales Machado Gonçalves
Yarrowia lipolytica whole cells immobilization:
impact on citric acid production
ACKNOWLEDGES I would like to thank my advisor, Doctor Isabel Belo, for all the availability, support, guidance, advices and encouragement transmitted.
I specially thank to Patrícia, for all advices, time and patience to guide me in the better way.
I thank to Adelaide, for all the hours spent and advices that enabled to take this work in a good way. A big thank to Marlene, Joana Azevedo, Sophia, Cristiana, Felisbela, Joana Rodrigues, Ana Sofia, Rafael and Joana Caria, my colleagues in the Bioprocess Laboratory and which showed the true sense of togetherness and sharing, having contributed with real funny and relaxing moments.
I thank to Madalena Vieira and Aline Barros for all the technical support when the HPLC equipment’s insisted to not cooperate with hard work.
I thank to João, always present, for the love, affection and understanding.
I also would like to thank to my close friends Aida, Tânia, Vasco, Andreia and David, which distract me from times of increased anxiety and worry and with which I shared each small victory achieved.
iv
________ ______ ______ ______ ______ ______ ______ ______ ______ ______ ______ ______ ______ ______ ______ ______ ______ ______ ______ ______ ______ ______ ______ ______ ______ ______ ______ ______ ______ ______ ______ ______ ______ ______ ______ ______ ______ ______ ______ ______ ___ ________ ______ ______ ______ ______ ______ ______ ______ ______ ______ ______ ______ ______ ______ ______ ______ ______ ______ ______ ______ ______ ______ ______ ______ ______ ______ ______ ______ ______ ______ ______ ______ ______ ______ ______ ______ ______ ______ ______ ______ ___ ________ ______ ______ ______ ______ ______ ______ ______ ______ ______ ______ ______ ______ ______ ______ ______ ______ ______ ______ ______ ______ ______ ______ ______ ______ ______ ______ ______ ______ ______ ______ ______ ______ ______ ______ ______ ______ ______ ______ ______ ___ ________ ______ ______ ______ ______ ______ ______ ______ ______ ______ ______ ______ ______ ______ ______ ______ ______ ______ ______ ______ ______ ______ ______ ______ ______ ______ ______ ___
ABSTRACT Yarrowia lipolytica whole cells immobilization: impact on citric acid production
Cell immobilization has been used as a strategy to solve the limitations of using suspended free cells in the medium. Whole cells immobilization has been used to improve yields and volumetric productivity of bioprocesses.
The central aim of this work was to select and optimize immobilization systems for Y. lipolytica W29 that could be used in the citric acid production from glycerol. Whole-cells immobilization by entrapment into calcium alginate gel matrix and by adsorption on plastic material was studied, with particular focus on the entrapment method.
Firstly, the effect of calcium alginate gel matrix composition was evaluated and the best conditions for cells retention were 3.3 % (w/v) of sodium alginate and 0.5 M of calcium chloride. Also, different sizes of gel spheres were tested (2 mm, 3 mm and 4 mm) and no significant differences on citric acid production were found, in the range of diameter tested. The influence of dry cell mass per mass of wet support in citric acid production was also analyzed and it was observed that, in the range of 5 to 16 mg of dry cell mass per gram of wet gel matrix, citric acid production kinetics was unchanged. However, in the experiments with free cells, citric acid production decreased with cell concentration increase (from 1.5 g∙L-1 to 3 g∙L-1 and 4.5 g∙L-1), due to citric acid consumption. The results demonstrated an
improvement in citric acid production (5 g∙L-1) with immobilized cells, highlighting the advantages of
immobilized cells instead of free cells suspended.
After selecting the best conditions for cell immobilization, the influence of initial glycerol concentration on citric acid batch production was analyzed and for the range of values studied (40 g∙L-1
to 80 g∙L-1) no cellular inhibition by the substrate was observed. Furthermore, the use of crude glycerol
as an alternative substrate was also analyzed and a similar citric acid production was obtained with this low-cost substrate as with pure glycerol. pH adjustment during the production of citric acid, revealed to be very important to increase the final acid concentration.
The immobilization by adsorption of Y. lipolytica W29 in DupUm® was studied, however high level of
cells desorption was observed during citric acid production that make difficult to discrimanete the experiments with free and immobilized cells. In fact, similar profiles of citric acid production were obtained in both systems.
vi
________ ______ ______ ______ ______ ______ ______ ______ ______ ______ ______ ______ ______ ______ ______ ______ ______ ______ ______ ______ ______ ______ ______ ______ ______ ______ ______ ______ ______ ______ ______ ______ ______ ______ ______ ______ ______ ______ ______ ______ ___ ________ ______ ______ ______ ______ ______ ______ ______ ______ ______ ______ ______ ______ ______ ______ ______ ______ ______ ______ ______ ______ ______ ______ ______ ______ ______ ______ ______ ______ ______ ______ ______ ______ ______ ______ ______ ______ ______ ______ ______ ___ ________ ______ ______ ______ ______ ______ ______ ______ ______ ______ ______ ______ ______ ______ ______ ______ ______ ______ ______ ______ ______ ______ ______ ______ ______ ______ ______ ______ ______ ______ ______ ______ ______ ______ ______ ______ ______ ______ ______ ______ ___ ________ ______ ______ ______ ______ ______ ______ ______ ______ ______ ______ ______ ______ ______ ______ ______ ______ ______ ______ ______ ______ ______ ______ ______ ______ ______ ______ ___
RESUMO Imobilização de células de Yarrowia lipolytica: impacto na produção de ácido cítrico
A imobilização de células tem sido utilizada para promover o aumento dos rendimentos e da produtividade de bioprocessos.
O objetivo central deste trabalho reside na seleção e otimização de um sistema de imobilização de Y. lipolytica W29 para ser utilizado na produção de ácido cítrico a partir de glicerol. Neste contexto, foi estudada a imobilização de células por inclusão numa matriz de alginato de cálcio e por adsorção num material de plástico, com particular ênfase na imobilização por inclusão.
Primeiramente avaliou-se o efeito da concentração da matriz de alginato de cálcio foi e as melhores condições de retenção celular encontradas foram 3,3 % (m/V) de alginato de sódio e 0,5 M de cloreto de cálcio. Adicionalmente testaram-se diferentes tamanhos de esferas de alginato de cálcio (2 mm, 3 mm e 4 mm), não se tendo observado diferenças significativas na produção de ácido cítrico, na gama de diâmetros testados. A influência da razão de massa seca de células por massa húmida de suporte na produção de ácido cítrico foi também analisada, tendo-se observado que na gama de 5 a 16 mg de massa seca de células por grama húmida de gel, a cinética de produção de ácido cítrico manteve-se praticamente inalterada. No entanto, nas experiências em que foram utilizadas células livres, a produção de ácido cítrico diminuiu com o aumento da concentração celular (de 1,5 g∙L-1 para 3 g∙L-1 e
para 4,5 g∙L-1), como resultado do consumo do ácido cítrico. Os resultados demonstraram um
aumento na produção de ácido cítrico (5 g∙L-1) com células imobilizadas, salientando as vantagens na
utilização de um sistema com células imobilizadas em vez de células livres.
Após a seleção das melhores condições de imobilização, foi estudada a influência da concentração de glicerol (de 40 g∙L-1 a 80 g∙L-1) e não foi observada inibição celular pelo substrato. Além disso,
comprovou-se a possibilidade de utilização de glicerol bruto como uma alternativa ao glicerol puro, tendo-se observado uma produção de ácido cítrico similar nas duas situações. O efeito do ajuste de pH no meio de produção foi também avaliado, revelando-se importante no aumento da produção de ácido cítrico.
Finalmente foi estudada a imobilização por adsorção de Y. lipolytica W29 a DupUM®, tendo-se
observado uma elevada dessorção de células durante a produção de ácido cítrico, o que dificulta a discriminação entre os ensaios com células livres e células imobilizadas. De facto, os perfis de produção de ácido cítrico foram semelhantes nos dois sistemas.
viii
________ ______ ______ ______ ______ ______ ______ ______ ______ ______ ______ ______ ______ ______ ______ ______ ______ ______ ______ ______ ______ ______ ______ ______ ______ ______ ______ ______ ______ ______ ______ ______ ______ ______ ______ ______ ______ ______ ______ ______ ___ ________ ______ ______ ______ ______ ______ ______ ______ ______ ______ ______ ______ ______ ______ ______ ______ ______ ______ ______ ______ ______ ______ ______ ______ ______ ______ ______ ______ ______ ______ ______ ______ ______ ______ ______ ______ ______ ______ ______ ______ ___ ________ ______ ______ ______ ______ ______ ______ ______ ______ ______ ______ ______ ______ ______ ______ ______ ______ ______ ______ ______ ______ ______ ______ ______ ______ ______ ______ ______ ______ ______ ______ ______ ______ ______ ______ ______ ______ ______ ______ ______ ___ ________ ______ ______ ______ ______ ______ ______ ______ ______ ______ ______ ______ ______ ______ ______ ______ ______ ______ ______ ______ ______ ______ ______ ______ ______ ______ ______ ___
LIST OF CONTENTS
ABSTRACT ... V RESUMO ... VII LIST OF ABBREVIATIONS ... XI LIST OF FIGURES ... XIII LIST OF TABLES ... XVII
1. INTRODUCTION ... 19
2. LITERATURE REVIEW ... 23
2.1. YARROWIA LIPOLYTICA ... 25
2.2. CITRIC ACID PRODUCTION ... 26
2.2.1. INDUSTRIAL PROCESS ... 27
2.2.2. SUBSTRATES ... 27
2.2.2.1. GLYCEROL ... 28
2.2.3 CITRIC ACID PRODUCTION BY Y. LIPOLYTICA... 30
2.2.4. FERMENTATION CONDITIONS FOR YEASTS ... 32
2.2.5. CITRIC ACID IMPROVEMENT STRATEGIES ... 35
2.2.6. CITRIC ACID RECOVERY ... 35
2.3. WHOLE CELLS IMMOBILIZATION ... 36
2.3.1. METHODS AND SUPPORTS ... 36
2.3.1.1. PHYSICAL ADSORPTION ... 37
2.3.1.2. COVALENT BINDING ... 38
2.3.1.3. ENTRAPMENT WITHIN POROUS MATRICES ... 38
2.3.1.3.1. ENTRAPMENT OF CELLS IN ALGINATE GEL ... 39
2.3.2. Y. LIPOLYTICA IMMOBILIZATION... 40
3. MATERIALS AND METHODS... 43
3.1. MICROORGANISM... 45
3.2. MEDIUM ... 45
x
________ ______ ______ ______ ______ ______ ______ ______ ______ ______ ______ ______ ______ ______ ______ ______ ______ ______ ______ ______ ______ ______ ______ ______ ______ ______ ______ ______ ______ ______ ______ ______ ______ ______ ______ ______ ______ ______ ______ ______ ___ ________ ______ ______ ______ ______ ______ ______ ______ ______ ______ ______ ______ ______ ______ ______ ______ ______ ______ ______ ______ ______ ______ ______ ______ ______ ______ ______ ______ ______ ______ ______ ______ ______ ______ ______ ______ ______ ______ ______ ______ ___ ________ ______ ______ ______ ______ ______ ______ ______ ______ ______ ______ ______ ______ ______ ______ ______ ______ ______ ______ ______ ______ ______ ______ ______ ______ ______ ______ ______ ______ ______ ______ ______ ______ ______ ______ ______ ______ ______ ______ ______ ___ ________ ______ ______ ______ ______ ______ ______ ______ ______ ______ ______ ______ ______ ______ ______ ______ ______ ______ ______ ______ ______ ______ ______ ______ ______ ______ ______ ___
________ ______ ______ ______ ______ ______ ______ ______ ______ ______ ______ ______ ______ ______ ______ ______ ______ ______ ______ ______ ______ ______ ______ ______ ______ ______ ______ ______ ______ ______ ______ ______ ______ ______ ______ ______ ______ ______ ______ ______ ___ ________ ______ ______ ______ ______ ______ ______ ______ ______ ______ ______ ______ ______ ______ ______ ______ ______ ______ ______ ______ ______ ______ ______ ______ ______ ______ ______ ______ ______ ______ ______ ______ ______ ______ ______ ______ ______ ______ ______ ______ ___ ________ ______ ______ ______ ______ ______ ______ ______ ______ ______ ______ ______ ______ ______ ______ ______ ______ ______ ______ ______ ______ ______ ______ ______ ______ ______ ______ ______ ______ ______ ______ ______ ______ ______ ______ ______ ______ ______ ______ ______ ___ ________ ______ ______ ______ ______ ______ ______ ______ ______ ______ ______ ______ ______ ______ ______ ______ ______ ______ ______ ______ ______ ______ ______ ______ ______ ______ ______ ___
3.4. EXPERIMENTS WITH FREE CELLS ... 45
3.5. IMMOBILIZATION BY ENTRAPMENT INTO CALCIUM ALGINATE ... 46
3.5.1. GEL MATRIX ... 46
3.5.2. CELL CONCENTRATION ... 47
3.5.3. SUBSTRATE ... 47
3.5.4. DIFFUSIVITY ... 47
3.5.5. REACTOR FERMENTATION OPTIMIZATION ... 48
3.6. IMMOBILIZATION BY ADSORPTION INTO DupUM®... 48
3.7. ANALYTICAL METHODS ... 49
3.8. CALCULATION OF FERMENTATION PARAMETERS ... 50
4. RESULTS AND DISCUSSION ... 51
4.1. EFFECT OF THE INITIAL YEAST CELL CONCENTRATION ON CITRIC ACID PRODUTION ... 53
4.2. ENTRAPMENT OF WHOLE Y. LIPOLYTICA CELLS ... 55
4.2.1. OPTIMIZATION OF GEL MATRIX ... 55
4.2.2. EFFECT OF RATIO BETWEEN DRY CELL MASS PER MASS OF WET SUPPORT ON CITRIC ACID PRODUCTION ... 61
4.2.3. EFFECT OF GLYCEROL ON CITRIC ACID PRODUCTION ... 63
4.2.4. EFFECT OF PH ON CITRIC ACID PRODUCTION ... 66
4.2.5. REUSABILITY OF CATALYST ... 67
4.3. ADSORPTION OF WHOLE Y. LIPOLYTICA CELLS ... 68
4.4. BIOREACTOR EXPERIMENTS ... 71
5. CONCLUSIONS AND FUTURE PERSPECTIVES ... 73
REFERENCES ... 77
LIST OF ABBREVIATIONS
[ ] Concentration of compound
3-P-GDH 3-P-glycerol dehydrogenase
a Radius of the spheres
A Peaks area detected by HPLC
Ac cis-Aconitate
b Ordinate at the origin
Biom Biomass (dry mass) concentration grown
C Solute concentration in the liquid phase
C0 Initial solute concentration in the liquid phase
CA Citric acid concentration in the culture liquid at the end of cultivation
CDW Biomass (dry mass) concentration
CS Citrate synthase
De Effective diffusion coefficient
FDA Food and Drug Administration
G residue α-L-guluronic
GK Glycerol kinase
Glu Glucose concentration
Glyc Total amount of glycerol consumed
GRAS Generally Recognized As Safe
HPLC High-performance liquid chromatography
ICDH Iso-citrate dehydrogenase
ICL Iso-citrate lyase
IUPAC International Union of Pure and Applied Chemistry
m Slope of the calibration curve
M residue 1,4-linked β-D-mannuronic
MDm Malate dehydrogenase (mitochondrial)
NTG N-methyl-NT-nitro-N-nitrosoguanidine
OD540 Optical density at 540 nm
OD600 Optical density at 600 nm
xii
________ ______ ______ ______ ______ ______ ______ ______ ______ ______ ______ ______ ______ ______ ______ ______ ______ ______ ______ ______ ______ ______ ______ ______ ______ ______ ______ ______ ______ ______ ______ ______ ______ ______ ______ ______ ______ ______ ______ ______ ___ ________ ______ ______ ______ ______ ______ ______ ______ ______ ______ ______ ______ ______ ______ ______ ______ ______ ______ ______ ______ ______ ______ ______ ______ ______ ______ ______ ______ ______ ______ ______ ______ ______ ______ ______ ______ ______ ______ ______ ______ ___ ________ ______ ______ ______ ______ ______ ______ ______ ______ ______ ______ ______ ______ ______ ______ ______ ______ ______ ______ ______ ______ ______ ______ ______ ______ ______ ______ ______ ______ ______ ______ ______ ______ ______ ______ ______ ______ ______ ______ ______ ___ ________ ______ ______ ______ ______ ______ ______ ______ ______ ______ ______ ______ ______ ______ ______ ______ ______ ______ ______ ______ ______ ______ ______ ______ ______ ______ ______ ___
________ ______ ______ ______ ______ ______ ______ ______ ______ ______ ______ ______ ______ ______ ______ ______ ______ ______ ______ ______ ______ ______ ______ ______ ______ ______ ______ ______ ______ ______ ______ ______ ______ ______ ______ ______ ______ ______ ______ ______ ___ ________ ______ ______ ______ ______ ______ ______ ______ ______ ______ ______ ______ ______ ______ ______ ______ ______ ______ ______ ______ ______ ______ ______ ______ ______ ______ ______ ______ ______ ______ ______ ______ ______ ______ ______ ______ ______ ______ ______ ______ ___ ________ ______ ______ ______ ______ ______ ______ ______ ______ ______ ______ ______ ______ ______ ______ ______ ______ ______ ______ ______ ______ ______ ______ ______ ______ ______ ______ ______ ______ ______ ______ ______ ______ ______ ______ ______ ______ ______ ______ ______ ___ ________ ______ ______ ______ ______ ______ ______ ______ ______ ______ ______ ______ ______ ______ ______ ______ ______ ______ ______ ______ ______ ______ ______ ______ ______ ______ ______ ___
PD Pyruvate dehydrogenase
PUF Oil-absorbent polyurethane
PVA Poly-vinyl alcohol
QGlyc Glycerol consumption rate
qn Nonzero roots of tan(𝑞𝑛) = 3𝑞𝑛 ∗ (3 + 𝛼𝑞𝑛2)−1
Rpm Revolutions per minute
Sb Standard error associated with the ordinate at the origin
SCO Single cell oil
Sm Standard error associated with the slope
t Time of fermentation duration
T1 Systems transporting pyruvic acid from cytosol to mitochondrion and inversely T2 Systems transporting pyruvic acid from cytosol to mitochondrion and inversely T3 Systems transporting pyruvic acid from cytosol to mitochondrion and inversely T4 System transporting citric and malic acid from cytosol to mitochondrion and inversely
TCA Tricarboxylic acid cycle
vvm Volume per volume per minute
YBiom/Glyc Biomass yield per glycerol
YCA/Glyc Citric acid yield by glycerol
Greek letters
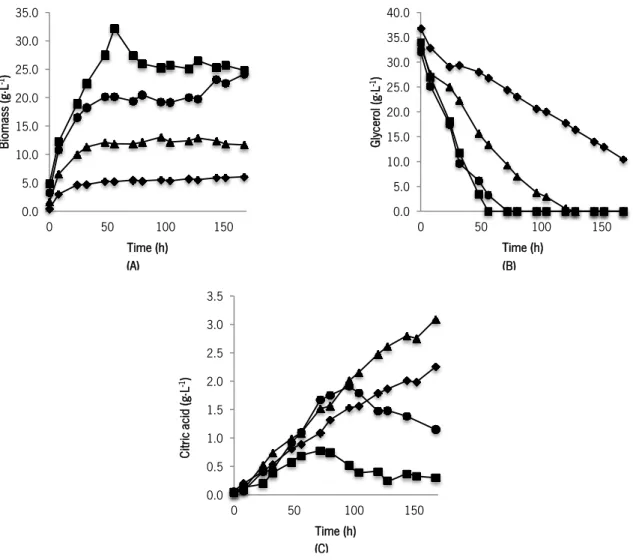
LIST OF FIGURES Figure 1 - Morphological forms exhibited by Y. lipolytica as dimorphic yeast. (A) Single oval cells; (B) Pseudo-hyphae. ... 25 Figure 2 - Pathway for the glycerol catabolism from Y. lipolytica and other yeasts (adapted from (Papanikolaou et al., 2008a; Ratledge and Wynn, 2002)). Abbreviations: GK - glycerol kinase; 3-P-GDH - 3-P-glycerol dehydrogenase; PD - pyruvate dehydrogenase; MDm - malate dehydrogenase (mitochondrial); CS - citrate synthase; Ac – cis-Aconitate; ICDH - citrate dehydrogenase; ICL - iso-citrate lyase; T1, T2, T3 - systems transporting pyruvic acid from cytosol to mitochondrion and inversely; T4 - system transporting citric and malic acid from cytosol to mitochondrion and inversely.34 Figure 3 - Cells immobilization methods (adapted from (Pilkington et al., 1998)). ... 37 Figure 4 - Schematic drawing of the egg-box model. Dark circles represent the oxygen atoms involved in the coordination of the calcium ion (adapted from (Grant et al., 1973)). ... 40 Figure 5 - Glass bioreactor used in this work. ... 48 Figure 6 – Cellular growth (dry mass) (A), glycerol consumption (B) and citric acid production (C) obtained, using 0.5 g·L-1 (♦), 1.5 g·L-1 (▲), 3 g·L-1 (●) and 4.5 g·L-1 (■) of cells (dry mass). Standard
errors with 95 % of confidence are lower than 23.0 % of the average. ... 54 Figure 7 – Biomass leakage (dry mass) to the medium (A), citric acid concentration (B) and glycerol concentration (C) obtained using 2.5 % (w/v) (closed symbols) and 3.3 % (w/v) (open symbols) of sodium alginate and 0.05 M (▲, Δ), 0.1 M (●, ○) and 0.5 M (■, □) of calcium chloride. Conditions: 3 mm of spheres diameter and 1.5 g·L-1 (5 mg∙g-1). Standard errors with 95 % of confidence are lower
than 14.0 %.of the average. ... 56 Figure 8 – Glycerol diffusivity into two gel matrices used: 2.5 % (w/v) of sodium alginate and 0.1 M of calcium chloride (A) and 3.3 % (w/v) of sodium alginate and 0.5 M of calcium chloride (B). Standard errors with 95 % of confidence are lower than 4.4 % of the average. ... 57 Figure 9 – Glycerol (closed symbols) and citric acid concentration (open symbols) obtained, using 2 mm (▲, Δ), 3 mm (●,○) and 4 mm (■, □) of spheres diameter. Conditions: 3.3 % (w/v) of sodium alginate and 0.5 M of calcium chloride and 1.5 g·L-1 (5 mg∙g-1). Standard errors with 95 % of
xiv
________ ______ ______ ______ ______ ______ ______ ______ ______ ______ ______ ______ ______ ______ ______ ______ ______ ______ ______ ______ ______ ______ ______ ______ ______ ______ ______ ______ ______ ______ ______ ______ ______ ______ ______ ______ ______ ______ ______ ______ ___ ________ ______ ______ ______ ______ ______ ______ ______ ______ ______ ______ ______ ______ ______ ______ ______ ______ ______ ______ ______ ______ ______ ______ ______ ______ ______ ______ ______ ______ ______ ______ ______ ______ ______ ______ ______ ______ ______ ______ ______ ___ ________ ______ ______ ______ ______ ______ ______ ______ ______ ______ ______ ______ ______ ______ ______ ______ ______ ______ ______ ______ ______ ______ ______ ______ ______ ______ ______ ______ ______ ______ ______ ______ ______ ______ ______ ______ ______ ______ ______ ______ ___ ________ ______ ______ ______ ______ ______ ______ ______ ______ ______ ______ ______ ______ ______ ______ ______ ______ ______ ______ ______ ______ ______ ______ ______ ______ ______ ______ ___
________ ______ ______ ______ ______ ______ ______ ______ ______ ______ ______ ______ ______ ______ ______ ______ ______ ______ ______ ______ ______ ______ ______ ______ ______ ______ ______ ______ ______ ______ ______ ______ ______ ______ ______ ______ ______ ______ ______ ______ ___ ________ ______ ______ ______ ______ ______ ______ ______ ______ ______ ______ ______ ______ ______ ______ ______ ______ ______ ______ ______ ______ ______ ______ ______ ______ ______ ______ ______ ______ ______ ______ ______ ______ ______ ______ ______ ______ ______ ______ ______ ___ ________ ______ ______ ______ ______ ______ ______ ______ ______ ______ ______ ______ ______ ______ ______ ______ ______ ______ ______ ______ ______ ______ ______ ______ ______ ______ ______ ______ ______ ______ ______ ______ ______ ______ ______ ______ ______ ______ ______ ______ ___ ________ ______ ______ ______ ______ ______ ______ ______ ______ ______ ______ ______ ______ ______ ______ ______ ______ ______ ______ ______ ______ ______ ______ ______ ______ ______ ______ ___
Figure 10 – Glycerol (closed symbols) and citric acid concentration (open symbols) obtained, using 1.5 g·L-1 (5 mg∙g-1) (▲, Δ), 3 g·L-1 (10 mg∙g-1) (●, ○) and 4.5 g·L-1 (16 mg∙g-1) (■, □) of cells. Conditions:
3.3 % (w/v) of sodium alginate and 0.5 M of calcium chloride and 3 mm of spheres diameter. Standard errors with 95 % of confidence are lower than 14.0 % of the average. ... 62 Figure 11 – Glycerol (closed symbols) and citric acid concentration (open symbols) obtained, using 40 g·L-1 (▲, Δ), 60 g·L-1 (●, ○) and 80 g·L-1 (■, □) of pure glycerol. Conditions: 3.3 % (w/v) of sodium
alginate and 0.5 M of calcium chloride, 3 mm of spheres diameter and 1.5 g·L-1 (5 mg∙g-1) of cells.
Standard errors with 95 % of confidence are lower than 14.0 % of the average. ... 63 Figure 12 – Glycerol (closed symbols) and citric acid concentration (open symbols) obtained, using pure (▲, Δ) and crude (●, ○) glycerol. Conditions: 3.3 % (w/v) of sodium alginate and 0.5 M of calcium chloride, 3 mm of spheres diameter and 1.5 g·L-1 (5 mg∙g-1) of cells and 40 g·L-1 of glycerol.
Standard errors with 95 % of confidence are lower than 17.8 % of the average. ... 65 Figure 13 – Glycerol (closed symbols) and citric acid concentration (open symbols) obtained, without (▲, Δ) and with (●, ○) pH adjustment. Conditions: 3.3 % (w/v) of sodium alginate and 0.5 M of calcium chloride, 3 mm of spheres diameter and 1.5 g·L-1 (5 mg∙g-1) of cells and 40 g·L-1 crude
glycerol. pH adjustment (pH=5) was performed with periodic additions of KOH (2 M). Standard errors with 95 % of confidence are lower than 17.8 % of the average. ... 66 Figure 14 – Glycerol (closed symbols) and citric acid concentration (open symbols) obtained, in the first (▲, Δ) and the second (●,○) fermentation using the same cells entrapped into calcium alginate gel matrix. Conditions: 3.3 % (w/v) of sodium alginate and 0.5 M of calcium chloride, 3 mm of spheres diameter, 1.5 g·L-1 (5 mg∙g-1) of cells and 40 g·L-1 crude glycerol. Standard errors with 95 % of
confidence are lower than 17.8 % of the average... 68 Figure 15 – Adhesion of Y. lipolytica W29 into DupUM® using NaCl solution (10 mM, pH 9). Standard errors with 95 % of confidence are lower than 14.8 % of the average. ... 69 Figure 16 – Citric acid concentration (A), biomass (dry mass) (B) and glycerol concentration (C), using free (▲) and immobilized (●) cells. Conditions: 1.5 g·L-1 of cells and 40 g·L-1 crude glycerol. Standard
errors with 95 % of confidence are lower than 6.6 % of the average. ... 70 Figure 17 – Glycerol consumption (closed symbols) and citric acid concentration (open symbols) obtained in bioreactor (A) and baffled Erlenmeyer flasks (B), with yeast extract (▲, Δ) and without yeast extract (●,○) in the production medium, using cells entrapped in the spheres. Conditions: 3.3 %
of sodium alginate and 0.5 M of calcium chloride, 3 mm of spheres diameter and 1.5 g·L-1 (5 mg∙g-1)
of cells and 40 g·L-1 crude glycerol. Standard errors with 95 % of confidence are lower than 17.8 % of
xvi
________ ______ ______ ______ ______ ______ ______ ______ ______ ______ ______ ______ ______ ______ ______ ______ ______ ______ ______ ______ ______ ______ ______ ______ ______ ______ ______ ______ ______ ______ ______ ______ ______ ______ ______ ______ ______ ______ ______ ______ ___ ________ ______ ______ ______ ______ ______ ______ ______ ______ ______ ______ ______ ______ ______ ______ ______ ______ ______ ______ ______ ______ ______ ______ ______ ______ ______ ______ ______ ______ ______ ______ ______ ______ ______ ______ ______ ______ ______ ______ ______ ___ ________ ______ ______ ______ ______ ______ ______ ______ ______ ______ ______ ______ ______ ______ ______ ______ ______ ______ ______ ______ ______ ______ ______ ______ ______ ______ ______ ______ ______ ______ ______ ______ ______ ______ ______ ______ ______ ______ ______ ______ ___ ________ ______ ______ ______ ______ ______ ______ ______ ______ ______ ______ ______ ______ ______ ______ ______ ______ ______ ______ ______ ______ ______ ______ ______ ______ ______ ______ ___
LIST OF TABLES Table 1 – Products obtained from different microorganism using crude glycerol as substrate ... 29 Table 2 - Citric acid production by several strains of Y. lipolytica at different fermentation conditions (adapted from (Yalcin et al., 2010)) ... 30 Table 3 - Immobilization methods and carriers applied in Y. lipolytica ... 41 Table 4 - Crude glycerol characteristics ... 47 Table 5 – Equations used to calculate the fermentation parameters. CA - citric acid concentration in the culture liquid at the end of cultivation (g·L-1); Glyc - total amount of glycerol consumed (g·L-1); t - time of
fermentation duration (h); Biom - Biomass (dry mass) concentration (g·L-1) grown ... 50
Table 6 – Global results of Y. lipolytica batch cultures on glycerol medium, for different initial cells concentrations. QGlyc - glycerol consumption rate; YBiom/Glyc - biomass yield per glycerol; YCA/Glyc - citric acid yield per glycerol; PCA – maximum volumetric productivity of citric acid ... 55 Table 7 – Global results of Y. lipolytica batch cultures on glycerol medium, using different gel matrix composition. QGlyc - glycerol consumption rate; YCA/Glyc - citric acid yield per glycerol; PCA – maximum volumetric productivity of citric acid ... 58 Table 8 – Global results of Y. lipolytica batch cultures on glycerol medium, using different calcium alginate spheres diameter. QGlyc - glycerol consumption rate; YCA/Glyc - citric acid yield per glycerol; PCA – maximum volumetric productivity of citric acid ... 60 Table 9 – Global results of Y. lipolytica batch cultures on glycerol medium, using different ratio between dry cell mass per unit mass of wet support. QGlyc - glycerol consumption rate; YCA/Glyc - citric acid yield
per glycerol; PCA – maximum volumetric productivity of citric acid ... 62
Table 10 – Global results of Y. lipolytica batch cultures on glycerol medium, for assays with different concentrations of pure glycerol. QGlyc - glycerol consumption rate; YCA/Glyc - citric acid yield per glycerol;
PCA – maximum volumetric productivity of citric acid ... 64 Table 11 – Global results of Y. lipolytica batch cultures on glycerol medium, when crude and pure glycerol were used. QGlyc - glycerol consumption rate; YCA/Glyc - citric acid yield per glycerol; PCA – maximum volumetric productivity of citric acid ... 65
xviii
________ ______ ______ ______ ______ ______ ______ ______ ______ ______ ______ ______ ______ ______ ______ ______ ______ ______ ______ ______ ______ ______ ______ ______ ______ ______ ______ ______ ______ ______ ______ ______ ______ ______ ______ ______ ______ ______ ______ ______ ___ ________ ______ ______ ______ ______ ______ ______ ______ ______ ______ ______ ______ ______ ______ ______ ______ ______ ______ ______ ______ ______ ______ ______ ______ ______ ______ ______ ______ ______ ______ ______ ______ ______ ______ ______ ______ ______ ______ ______ ______ ___ ________ ______ ______ ______ ______ ______ ______ ______ ______ ______ ______ ______ ______ ______ ______ ______ ______ ______ ______ ______ ______ ______ ______ ______ ______ ______ ______ ______ ______ ______ ______ ______ ______ ______ ______ ______ ______ ______ ______ ______ ___ ________ ______ ______ ______ ______ ______ ______ ______ ______ ______ ______ ______ ______ ______ ______ ______ ______ ______ ______ ______ ______ ______ ______ ______ ______ ______ ______ ___
________ ______ ______ ______ ______ ______ ______ ______ ______ ______ ______ ______ ______ ______ ______ ______ ______ ______ ______ ______ ______ ______ ______ ______ ______ ______ ______ ______ ______ ______ ______ ______ ______ ______ ______ ______ ______ ______ ______ ______ ___ ________ ______ ______ ______ ______ ______ ______ ______ ______ ______ ______ ______ ______ ______ ______ ______ ______ ______ ______ ______ ______ ______ ______ ______ ______ ______ ______ ______ ______ ______ ______ ______ ______ ______ ______ ______ ______ ______ ______ ______ ___ ________ ______ ______ ______ ______ ______ ______ ______ ______ ______ ______ ______ ______ ______ ______ ______ ______ ______ ______ ______ ______ ______ ______ ______ ______ ______ ______ ______ ______ ______ ______ ______ ______ ______ ______ ______ ______ ______ ______ ______ ___ ________ ______ ______ ______ ______ ______ ______ ______ ______ ______ ______ ______ ______ ______ ______ ______ ______ ______ ______ ______ ______ ______ ______ ______ ______ ______ ______ ___
Table 12– Global results of Y. lipolytica batch cultures on glycerol medium, in a production medium without and with pH adjustment. QGlyc - glycerol consumption rate; YCA/Glyc - citric acid yield per glycerol;
PCA – maximum volumetric productivity of citric acid ... 67
Table 13 – Global results of Y. lipolytica batch cultures on glycerol medium, in the first and second fermentation cycles, using the same yeast cells entrapped into calcium alginate. QGlyc - glycerol consumption rate; YCA/Glyc - citric acid yield per glycerol; PCA – maximum volumetric productivity of citric
acid ... 68 Table 14– Global results of Y. lipolytica batch cultures on glycerol medium, when free and immobilized cells into DupUM® were used. QGlyc - glycerol consumption rate; YBiom/Glyc - biomass yield per glycerol; YCA/Glyc - citric acid yield per glycerol; PCA – maximum volumetric productivity of citric acid ... 71 Table 15 – Global results of Y. lipolytica batch cultures on glycerol medium, using bioreactor and baffled Erlenmeyer flask, with and without yeast extract. QGlyc - glycerol consumption rate; YCA/Glyc - citric
acid yield per glycerol; PCA – maximum volumetric productivity of citric acid ... 72 Table A 1 - Expression of biomass calibration. OD600 - optical density at 600 nm; m: slope of the
calibration curve; Sm - standard error associated with the slope; CDW - Biomass (dry mass) concentration (g·L-1); b - ordinate at the origin; Sb - Standard error associated with the ordinate at the
origin ... 99 Table A 2 - Expression of glucose calibration. OD540 - optical density at 540 nm; m - slope of the calibration curve; Sm - standard error associated with the slope; Glu - glucose concentration (g∙L-1); b -
ordinate at the origin; Sb - Standard error associated with the ordinate at the origin ... 99
Table A 3 - Expression of glycerol and citric acid calibration. A - peaks area detected by HPLC; m: slope of the calibration curve ; Sm: standard error associated with the slope; [ ] – concentration of compound (g∙L-1); b: ordinate at the origin; Sb - Standard error associated with the ordinate at the origin ... 99
This chapter introduces the background information about the theme of this work and its main objectives.
Cell immobilization is a strategy used in the last decades as a solution to the limitations of the use of suspended free cells in the medium. This technology promotes the protection of cells against stress environmental conditions, prevent cells washout on continuous processes, increases reusability of the biocatalyst, improve yields and volumetric productivity of bioprocesses (Léonard et al., 2011; Park and Chang, 2000; Trelles et al., 2010).
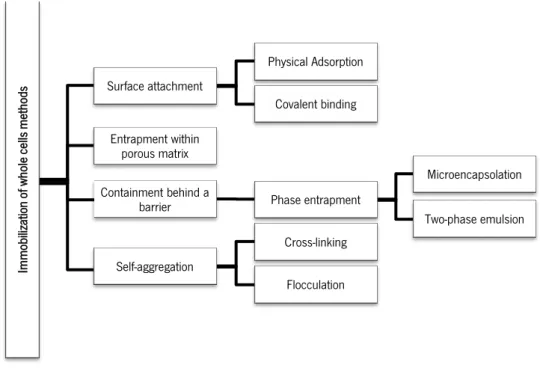
Generally, cell immobilization methods are based on surface attachment (by physical adsorption or covalent biding), entrapment within porous matrix, containment behind a barrier (by microencapsulation or two-phase emulsion) and self-aggregation (by cross-linking or flocculation) (Pilkington et al., 1998).
Since 1991, Y. lipolytica whole cells immobilization started to be investigated when Kautola experimented several supports for citric acid biosynthesis using glucose as substrate (Kautola et al., 1991). Further, immobilization was applied in order to optimize processes productivity by this yeast, including citric acid biosynthesis using glucose and fructose as substrate (Mansfeld et al., 1995), removal of oil film on surface waters (Oh et al., 2000), crude oil degradation (Zinjarde and Pant, 2000), oil wastewater degradation (Wu et al., 2009) and biosynthesis of γ-decalactone (peach-aroma) (Braga and Belo, 2013).
Yarrowia lipolytica is an obligate aerobic, dimorphic and ‘‘non-conventional’’ yeast, known by its capabilities to use hydrophobic and non-hydrophobic substrates, to secrete aromas, organic acids and enzymes and to accumulate large amounts of lipids (Ageitos et al., 2011; Nicaud, 2012; Zhao et al., 2010). These features increased the biotechnological and industrial interest of Y. lipolytica (Barth and Gaillardin, 1997; Fickers et al., 2005; Hamme et al., 2003). Yarrowia lipolytica W29 (ATCC 20460) has been proven to be a very robust strain for many of the applications previously described, thus its application for citric acid production from crude glycerol (from biodiesel) has a great interest of development and optimization.
The central aim of this work is to select immobilization methods and supports for Y. lipolytica W29 whole cells immobilization in order to improve citric acid production by this strain. At first, calcium alginate gel matrix and DupUM® were tested for cell immobilization by entrapment and adsorption,
respectively, in order to select the best carrier and immobilization conditions. After that, the influence of gel pieces size, cell concentration and environmental conditions were studied. Biosynthesis of citric acid with immobilized cells was monitored and compared with freely suspended cells.
1. Introduction
________ ______ ______ ______ ______ ______ ______ ______ ______ ______ ______ ______ ______ ______ ______ ______ ______ ______ ______ ______ ______ ______ ______ ______ ______ ______ ______ ______ ______ ______ ______ ______ ______ ______ ______ ______ ______ ______ ______ ______ ___ ________ ______ ______ ______ ______ ______ ______ ______ ______ ______ ______ ______ ______ ______ ______ ______ ______ ______ ______ ______ ______ ______ ______ ______ ______ ______ ______ ______ ______ ______ ______ ______ ______ ______ ______ ______ ______ ______ ______ ______ ___ ________ ______ ______ ______ ______ ______ ______ ______ ______ ______ ______ ______ ______ ______ ______ ______ ______ ______ ______ ______ ______ ______ ______ ______ ______ ______ ______ ______ ______ ______ ______ ______ ______ ______ ______ ______ ______ ______ ______ ______ ___ ________ ______ ______ ______ ______ ______ ______ ______ ______ ______ ______ ______ ______ ______ ______ ______ ______ ______ __
________ ______ ______ ______ ______ ______ ______ ______ ______ ______ ______ ______ ______ ______ ______ ______ ______ ______ ______ ______ ______ ______ ______ ______ ______ ______ ______ ______ ______ ______ ______ ______ ______ ______ ______ ______ ______ ______ ______ ______ ___ ________ ______ ______ ______ ______ ______ ______ ______ ______ ______ ______ ______ ______ ______ ______ ______ ______ ______ ______ ______ ______ ______ ______ ______ ______ ______ ______ ______ ______ ______ ______ ______ ______ ______ ______ ______ ______ ______ ______ ______ ___ ________ ______ ______ ______ ______ ______ ______ ______ ______ ______ ______ ______ ______ ______ ______ ______ ______ ______ ______ ______ ______ ______ ______ ______ ______ ______ ______ ______ ______ ______ ______ ______ ______ ______ ______ ______ ______ ______ ______ ______ ___ ________ ______ ______ ______ ______ ______ ______ ______ ______ ______ ______ ______ ______ ______ ______ ______ ______ ______ _____
This chapter covers the characterization of Yarrowia lipolytica, highlighting the metabolism of this yeast. It is given special attention to the biotechnological production of citric acid, with reference to its properties and consequent importance to the industry, producer microorganisms, substrates used, required conditions in this bioprocess to obtain the best productivity and yields (effect of mineral components of the medium, pH, temperature and aeration), fermentation type, strains improvement strategies and citric acid recovery. Further, the potentialities of cells immobilization technology are described with particular focus on the application to Y. lipolytica and citric acid production.
2.1. YARROWIA LIPOLYTICA
Yarrowia lipolytica is an eukaryotic microorganism, belonging to the Fungi kingdom. It is taxonomically assigned to the subclass Hemiascomycetes, the order Saccharomycetales and to the family Dipodascacea (Kurtzman and Fell, 2000). In an earlier stage, Y. lipolytica was named as Candida lipolytica and was included in the class Deuteromycetous. Further observation of ascospores
enabled the rename to Endomycopsis, Saccharomycopsis and finally to Yarrowia lipolytica (Barth and
Gaillardin, 1996, 1997; Walt and Arx, 1980; Yarrow, 1972).
Yarrowia lipolytica is an obligate aerobic microorganism and one of the most extensively studied ‘‘non-conventional’’ yeast species. This classification of “non-conventional” was adopted to distinguish Y. lipolytica and other species from other well studied yeasts, such as Saccharomyces cerevisiae and Schizosaccharomyces pombe, with respect to its phylogenetic evolution, physiology, genetics and molecular biology (Barth and Gaillardin, 1997). Y. lipolytica is a dimorphic yeast (Figure 1), since it is capable to grow under two distinct morphological forms, single oval cells and pseudo-hyphae. The form that the yeast presents is the result of a defense mechanism from adverse growth conditions (aeration, carbon and nitrogen conditions, pH, among others) or conditioned by genetic characteristics of strain (Barth and Gaillardin, 1997; Kawasse et al., 2003). The most important regulator on dimorphic transition is pH, occurring maximal hyphae formation at pH near neutrality (Ruiz-Herrera and Sentandreu, 2002). With respect to the other conditions, glucose and nitrogen salts favor hyphae form (Pérez-Campo and Dominguez, 2001; Ruiz-Herrera and Sentandreu, 2002), as well semi-anoxic conditions provided in liquid or solid media (Ruiz-Herrera and Sentandreu, 2002).
Figure 1 - Morphological forms exhibited by Y. lipolytica as dimorphic yeast. (A) Single oval cells; (B) Pseudo-hyphae.
(A) (B)
2. Literature Review
________ ______ ______ ______ ______ ______ ______ ______ ______ ______ ______ ______ ______ ______ ______ ______ ______ ______ ______ ______ ______ ______ ______ ______ ______ ______ ______ ______ ______ ______ ______ ______ ______ ______ ______ ______ ______ ______ ______ ______ ___ ________ ______ ______ ______ ______ ______ ______ ______ ______ ______ ______ ______ ______ ______ ______ ______ ______ ______ ______ ______ ______ ______ ______ ______ ______ ______ ______ ______ ______ ______ ______ ______ ______ ______ ______ ______ ______ ______ ______ ______ ___ ________ ______ ______ ______ ______ ______ ______ ______ ______ ______ ______ ______ ______ ______ ______ ______ ______ ______ ______ ______ ______ ______ ______ ______ ______ ______ ______ ______ ______ ______ ______ ______ ______ ______ ______ ______ ______ ______ ______ ______ ___ ________ ______ ______ ______ ______ ______ ______ ______ ______ ______ ______ ______ ______ ______ ______ ______ ______ ______ ______ ______ ______ ______ ______ ______ ______ ______ ______ ___
________ ______ ______ ______ ______ ______ ______ ______ ______ ______ ______ ______ ______ ______ ______ ______ ______ ______ ______ ______ ______ ______ ______ ______ ______ ______ ______ ______ ______ ______ ______ ______ ______ ______ ______ ______ ______ ______ ______ ______ ___ ________ ______ ______ ______ ______ ______ ______ ______ ______ ______ ______ ______ ______ ______ ______ ______ ______ ______ ______ ______ ______ ______ ______ ______ ______ ______ ______ ______ ______ ______ ______ ______ ______ ______ ______ ______ ______ ______ ______ ______ ___ ________ ______ ______ ______ ______ ______ ______ ______ ______ ______ ______ ______ ______ ______ ______ ______ ______ ______ ______ ______ ______ ______ ______ ______ ______ ______ ______ ______ ______ ______ ______ ______ ______ ______ ______ ______ ______ ______ ______ ______ ___ ________ ______ ______ ______ ______ ______ ______ ______ ______ ______ ______ ______ ______ ______ ______ ______ ______ ______ _____
26
Y. lipolytica is able to grow in stressful environments such as hypersaline environments, and therefore, it has been used as a model in salt tolerant studies (Thevenieau et al., 2009). Additionally, Y. lipolytica can be found in sewage, oil polluted media, marine and food environments (Thevenieau et al., 2009), suggesting the versatility of its metabolism, essentially related to the development of very efficient mechanisms for breaking down and use of hydrophobic substrates (n-alkanes, oils, fats, fatty acids (Barth and Gaillardin, 1997; Fickers et al., 2005)), as well as non-hydrophobic subtracts (sugars, alcohols and organic acids). In fact, genome sequencing of Y. lipolytica (Casaregola et al., 2000; Sherman et al., 2004) brought knowledge, among others, about the genes encoding enzymes involved in n-alkanes, fats and fatty acid metabolism (Thevenieau et al., 2009). This feature made Y. lipolytica a microorganism with biotechnological interest for bioremediation processes, to solve many ecological
and environmental damages (Barth and Gaillardin, 1997; Fickers et al., 2005; Hamme et al., 2003).
Yarrowia lipolytica is a nonpathogenic yeast and classified as “Generally Recognized As Safe” (GRAS) by the Food and Drug Administration (FDA, USA) (Beckerich et al., 1998; Tsugawa et al., 1969), with capability to secrete a wide range of compounds like organic acids (Mauersberger et al., 2003), lactones (Aguedo et al., 2005) and enzymes (mainly lipases (Fickers et al., 2003), but also proteases (Kulkarni and Gadre, 1999), RNases, phosphatases, esterases (Barth and Gaillardin, 1997), among others. The organic acids produced by Y. lipolytica are citric acid, isocitric acid, α-ketoglutaric acid, fumaric acid, malic acid and piruvic acid, which are intermediates of tricarboxylic acids (TCA) (Kamzolova et al., 2003; Otto et al., 2013; Rymowicz et al., 2008). Additionally, Y. lipolytica can accumulate large amounts of lipids, about 40 % of its cellular dry weight, with industrial interest (Ageitos et al., 2011; Nicaud, 2012; Zhao et al., 2010).
2.2. CITRIC ACID PRODUCTION
Citric acid properties as acidifier flavoring agent, preservative, pH adjuster and antioxidant, made this metabolite attractive for metal cleaning, food, beverage, chemical, pharmaceutical, agriculture, detergents, cosmetic and toiletries industries (Kamzolova et al., 2005; Rymowicz et al., 2008; Soccol et al., 2006).
Global production of citric acid exceed 1.7 million tons per year and the volume of citric production is continually rising at an high annual rate of 5 % (Anastassiadis et al., 2008; Vendruscolo et al., 2008), being 99 % of its production through biotechnological methods, the simple, stable, easiest and economically most successful strategy at industrial scale (Kuforiji et al., 2010; Rywińska et al., 2012;
Soccol et al., 2006). A wide range of microorganisms has the ability to secret citric acid, including bacteria, fungi and yeast (Crolla and Kennedy, 2001; Kuforiji et al., 2010; Papagianni, 2007). Among these, Aspergillus niger is known as the greater producer of citric acid, being the traditional fungus used in this process at industrial scale, due to its ease of handling, capability to use a variety of raw materials and high yield (Vandenberghe et al., 1999). However, in the last years, Y. lipolytica has been gained importance in this bioprocess due to the several substrates that can use and the high product yields (Förster et al., 2007). Beyond the microorganisms and strains used, citric acid bioprocess yields are strongly affected by subtracts, mineral composition of medium, aeration, pH, temperature, fermentation type, strains improvement strategies and recovery techniques used (Antonucci et al., 2001; Lotfy et al., 2007b; Papagianni et al., 1999).
2.2.1.INDUSTRIAL PROCESS
About 80 % of world citric acid production is performed by A. niger under submerged fermentation (Kumar et al., 2003; Leangon et al., 2000; Vandenberghe et al., 1999). The substrates contain glucose or sucrose, being reported the use of date syrup (Roukas and Kotzekidou, 1997), black strap molasses (Haq et al., 2001), corn cobs (Hang and Woodams, 2001), potato starch (Lesniak et al., 2002), cane molasses (Haq et al., 2004), orange peel (Rivas et al., 2008) and sphagnum peat moss (supplemented with glucose) (Suzelle et al., 2009). Although the batch system is the most used on submerged fermentation, fed batch and continuous system can be also applied (Dhillon et al., 2011; Soccol et al., 2006). Citric acid fermentation can be completed in 5 to 12 days, according to the process conditions.
The advantages of submerged fermentation include the higher productivity and yield, lower labor cost, lower contamination risk and labour consumption (Soccol et al., 2006; Vandenberghe et al., 1999). Nevertheless, it is important to attend the sophisticated installations and rigorous control mechanisms required (Soccol et al., 2006).
2.2.2.SUBSTRATES
The quality and quantity of substrate directly influence it conversion into citric acid by microorganisms, as well the nature of substrate.
Industrial citric acid biosynthesis can be carried out under consumption of sugar industry b y-products, hydrocarbons, agro-industrial waste residues and starchy materials (Ambati and Ayyanna, 2001; Hang and Woodams, 1998; Jianlong et al., 2000; Kumar et al., 2003; Leangon et al., 2000;
2. Literature Review
________ ______ ______ ______ ______ ______ ______ ______ ______ ______ ______ ______ ______ ______ ______ ______ ______ ______ ______ ______ ______ ______ ______ ______ ______ ______ ______ ______ ______ ______ ______ ______ ______ ______ ______ ______ ______ ______ ______ ______ ___ ________ ______ ______ ______ ______ ______ ______ ______ ______ ______ ______ ______ ______ ______ ______ ______ ______ ______ ______ ______ ______ ______ ______ ______ ______ ______ ______ ______ ______ ______ ______ ______ ______ ______ ______ ______ ______ ______ ______ ______ ___ ________ ______ ______ ______ ______ ______ ______ ______ ______ ______ ______ ______ ______ ______ ______ ______ ______ ______ ______ ______ ______ ______ ______ ______ ______ ______ ______ ______ ______ ______ ______ ______ ______ ______ ______ ______ ______ ______ ______ ______ ___ ________ ______ ______ ______ ______ ______ ______ ______ ______ ______ ______ ______ ______ ______ ______ ______ ______ ______ ______ ______ ______ ______ ______ ______ ______ ______ ______ ___
________ ______ ______ ______ ______ ______ ______ ______ ______ ______ ______ ______ ______ ______ ______ ______ ______ ______ ______ ______ ______ ______ ______ ______ ______ ______ ______ ______ ______ ______ ______ ______ ______ ______ ______ ______ ______ ______ ______ ______ ___ ________ ______ ______ ______ ______ ______ ______ ______ ______ ______ ______ ______ ______ ______ ______ ______ ______ ______ ______ ______ ______ ______ ______ ______ ______ ______ ______ ______ ______ ______ ______ ______ ______ ______ ______ ______ ______ ______ ______ ______ ___ ________ ______ ______ ______ ______ ______ ______ ______ ______ ______ ______ ______ ______ ______ ______ ______ ______ ______ ______ ______ ______ ______ ______ ______ ______ ______ ______ ______ ______ ______ ______ ______ ______ ______ ______ ______ ______ ______ ______ ______ ___ ________ ______ ______ ______ ______ ______ ______ ______ ______ ______ ______ ______ ______ ______ ______ ______ ______ ______ _____
28
Mourya and Jauhri, 2000; Vandenberghe et al., 2000). For A. niger, the most suitable substrate are molasses (Ikram-ul et al., 2004; Lotfy et al., 2007a), which contain sugars in form of sucrose, glucose and fructose (40 % to 55 %) (Grewal and Kalra, 1995). Despite the low cost of this substrate, the yield of citric acid produced in media containing cane molasses can be compromised due to the high content of trace metals (calcium, magnesium, manganese, iron, zinc) and other inhibitory substances (Chaudhary and Pirt, 1996; Chaudhary et al., 1978; Dasgupta et al., 1981). Therefore, the use of molasses by A. niger requires a pretreatment for removal of these compounds (Grewal and Kalra, 1995).
The use of yeasts, such as Y. lipolytica, brings advantages with respect to A. niger, due to it insensibility to trace metals. Therefore, this yeast can use crude substrates without any treatment. Moreover, Y. lipolytica was highlight by the efficient grow in n-alkanes, vegetable oils, ethanol, molasses, hydrolyzed starch, yielding high citric acid yields (Crolla and Kennedy, 2004a; Finogenova et al., 2005; Förster et al., 2007; Papanikolaou et al., 2006). However, in the last years the use of glycerol as substrate has gained importance.
2.2.2.1. Glycerol
Glycerol, or propan-1,2,3-triol (IUPAC name), is a trihydric alcohol with chemical formula OH-CH2-CH(OH)-CH2-OH (Perry and Green, 1997). It is a colorless, odorless and viscous liquid with
sweet-taste, nontoxic and hygroscopic properties (Perry and Green, 1997). Glycerol is mainly obtained from biodiesel production, but also from alcoholic beverage, textile, food and soap manufacture, industrial processes which present glycerol as by-product (Papanikolaou and Aggelis, 2003). The concerns about carbon dioxide emission and global warming as a result of fossil fuels use, the decrease and future exhaustion of oil supplies and increase of crude oil price, leaded to increased biodiesel exploration with the concomitant glycerol accumulation (Kemp, 2006; Soriano et al., 2006). Biodiesel is a renewable, biodegradable and nontoxic fuel, having its worldwide production increased exponentially in last years (Kulkarni and Dalai, 2006). Biodiesel manufacturing process involves (i) hydrolysis of triglycerides to form glycerol and fatty acids, and (ii) esterification of fatty acids with formation of methylated fatty acids which are just used as biodiesel. About 10 kg of the biodiesel produced origin 1 kg of glycerol. In fact, Posada and Cardona (2010) refers as a typical composition of crude glycerol stream obtained from the biodiesel production process 60.05 wt % glycerol, 32.59 wt % methanol, 2.8 wt % ash, 2.62 wt % NaOCH3 and 1.94 wt % fats. This composition is dependent of the
catalyst used for biodiesel production, transesterification efficiency, recovery efficiency, feedstock impurities and the methanol and catalysts were recovered (Hansen et al., 2009). Further, according to the purification method (Leung et al., 2010; Singhabhandhu and Tezuka, 2010; Van-Gerpen, 2005), crude glycerol composition can include from 40 % to 99 % of glycerol, residual oil, free fatty acids (about 1 %), sodium and potassium salts and water (Rymowicz et al., 2010). The accumulated glycerol (874 m3 of biodiesel produced per day in Portugal in 2011 (EIA, 2014)) could be a future
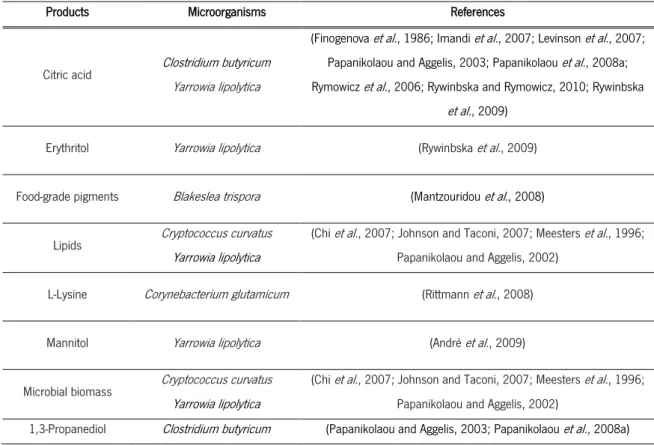
environmental problem, despite its application in food, pharmaceutical and cosmetic industries, among others (Pachauri and He, 2006). Nowadays, it is known the capabilities of several microorganisms to use crude glycerol as substrate, being involved in biotechnological processes to convert this low cost by-product into a value-added product (Table 1).
Table 1 – Products obtained from different microorganism using crude glycerol as substrate
Products Microorganisms References
Citric acid Clostridium butyricum Yarrowia lipolytica
(Finogenova et al., 1986; Imandi et al., 2007; Levinson et al., 2007;
Papanikolaou and Aggelis, 2003; Papanikolaou et al., 2008a;
Rymowicz et al., 2006; Rywinbska and Rymowicz, 2010; Rywinbska
et al., 2009)
Erythritol Yarrowia lipolytica (Rywinbska et al., 2009)
Food-grade pigments Blakeslea trispora (Mantzouridou et al., 2008)
Lipids Cryptococcus curvatus
Yarrowia lipolytica
(Chi et al., 2007; Johnson and Taconi, 2007; Meesters et al., 1996;
Papanikolaou and Aggelis, 2002) L-Lysine Corynebacterium glutamicum (Rittmann et al., 2008)
Mannitol Yarrowia lipolytica (André et al., 2009)
Microbial biomass Cryptococcus curvatus
Yarrowia lipolytica
(Chi et al., 2007; Johnson and Taconi, 2007; Meesters et al., 1996;
Papanikolaou and Aggelis, 2002)
1,3-Propanediol Clostridium butyricum (Papanikolaou and Aggelis, 2003; Papanikolaou et al., 2008a)
The purification degree of the crude glycerol can influence the biochemical pathways of
microorganisms, leading to different yields of metabolites produced when crude glycerol, without
purification, is used. This can be explained by the crude glycerol composition (Samul et al., 2014).
The use of glycerol by Y. lipolytica as substrate has been explored in the last years for the biosynthesis of organic acids (Papanikolaou and Aggelis, 2009; Rywinbska et al., 2009) and single cell oil (SCO) (Papanikolaou and Aggelis, 2002).
2. Literature Review
________ ______ ______ ______ ______ ______ ______ ______ ______ ______ ______ ______ ______ ______ ______ ______ ______ ______ ______ ______ ______ ______ ______ ______ ______ ______ ______ ______ ______ ______ ______ ______ ______ ______ ______ ______ ______ ______ ______ ______ ___ ________ ______ ______ ______ ______ ______ ______ ______ ______ ______ ______ ______ ______ ______ ______ ______ ______ ______ ______ ______ ______ ______ ______ ______ ______ ______ ______ ______ ______ ______ ______ ______ ______ ______ ______ ______ ______ ______ ______ ______ ___ ________ ______ ______ ______ ______ ______ ______ ______ ______ ______ ______ ______ ______ ______ ______ ______ ______ ______ ______ ______ ______ ______ ______ ______ ______ ______ ______ ______ ______ ______ ______ ______ ______ ______ ______ ______ ______ ______ ______ ______ ___ ________ ______ ______ ______ ______ ______ ______ ______ ______ ______ ______ ______ ______ ______ ______ ______ ______ ______ ______ ______ ______ ______ ______ ______ ______ ______ ______ ___
________ ______ ______ ______ ______ ______ ______ ______ ______ ______ ______ ______ ______ ______ ______ ______ ______ ______ ______ ______ ______ ______ ______ ______ ______ ______ ______ ______ ______ ______ ______ ______ ______ ______ ______ ______ ______ ______ ______ ______ ___ ________ ______ ______ ______ ______ ______ ______ ______ ______ ______ ______ ______ ______ ______ ______ ______ ______ ______ ______ ______ ______ ______ ______ ______ ______ ______ ______ ______ ______ ______ ______ ______ ______ ______ ______ ______ ______ ______ ______ ______ ___ ________ ______ ______ ______ ______ ______ ______ ______ ______ ______ ______ ______ ______ ______ ______ ______ ______ ______ ______ ______ ______ ______ ______ ______ ______ ______ ______ ______ ______ ______ ______ ______ ______ ______ ______ ______ ______ ______ ______ ______ ___ ________ ______ ______ ______ ______ ______ ______ ______ ______ ______ ______ ______ ______ ______ ______ ______ ______ ______ _____
30
2.2.3CITRIC ACID PRODUCTION BY Y. LIPOLYTICA
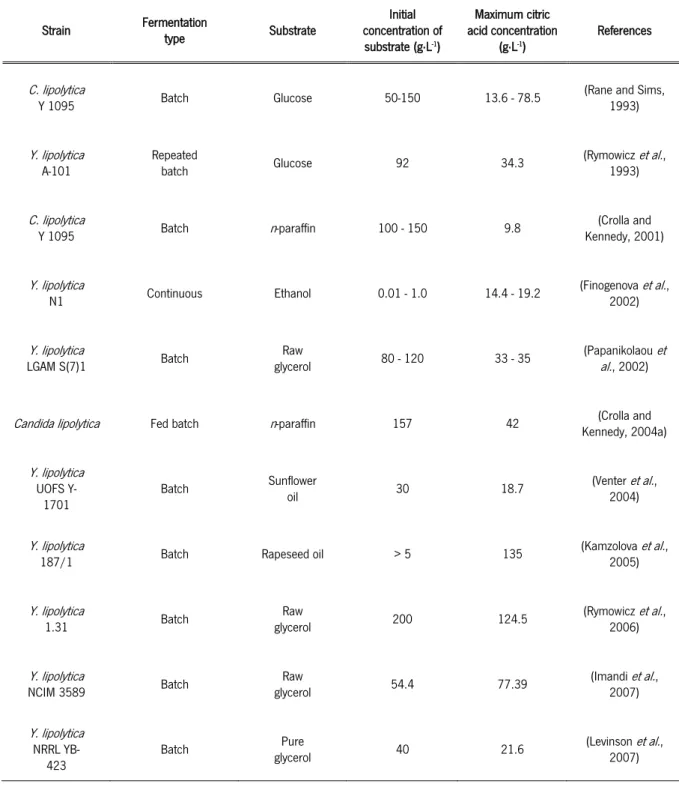
Citric acid production by Y. lipolytica was reported by several authors, regarding to the fermentation type and substrate. In the Table 2 some of these studies are summarized, with the information of the maximum citric acid concentration achieved.
Table 2 - Citric acid production by several strains of Y. lipolytica at different fermentation conditions (adapted from (Yalcin et al., 2010))
Strain Fermentation type Substrate Initial concentration of substrate (g∙L-1) Maximum citric acid concentration (g∙L-1) References C. lipolytica
Y 1095 Batch Glucose 50-150 13.6 - 78.5 (Rane and Sims, 1993)
Y. lipolytica
A-101 Repeated batch Glucose 92 34.3 (Rymowicz1993) et al.,
C. lipolytica
Y 1095 Batch n-paraffin 100 - 150 9.8 Kennedy, 2001) (Crolla and
Y. lipolytica
N1 Continuous Ethanol 0.01 - 1.0 14.4 - 19.2
(Finogenova et al.,
2002)
Y. lipolytica
LGAM S(7)1 Batch glycerol Raw 80 - 120 33 - 35 (Papanikolaoual., 2002) et
Candida lipolytica Fed batch n-paraffin 157 42 Kennedy, 2004a) (Crolla and
Y. lipolytica
UOFS Y-
1701 Batch
Sunflower
oil 30 18.7 (Venter2004) et al.,
Y. lipolytica
187/1 Batch Rapeseed oil > 5 135 (Kamzolova2005) et al.,
Y. lipolytica 1.31 Batch Raw glycerol 200 124.5 (Rymowicz et al., 2006) Y. lipolytica
NCIM 3589 Batch glycerol Raw 54.4 77.39 (Imandi2007) et al.,
Y. lipolytica
NRRL YB-
423 Batch
Pure
glycerol 40 21.6 (Levinson2007) et al.,
Table 2 – Continuation
Strain Fermentation type Substrate concentration of Initial
substrate (g∙L-1) Maximum citric acid concentration (g∙L-1) References Y. lipolytica ACA-DC 50109
Batch OMW-based Glucose in
medium 65 28.9 (Papanikolaoual., 2008b) et Y. lipolytica NBRC 1658 Batch Mannitol 120 20.25 (Karasu et al., 2009a) Y.lipolytica
57 Batch glycerol Pure 160 32.80 (Karasu2009a) et al.,
Y. lipolytica NBRC 1658 Batch Glucose in whey-based medium 100 38.88 (Karasu et al., 2009b) Y. lipolytica 57 Batch Fructose in whey-based medium 150 49.23 (Karasu et al., 2009b) Y. lipolytica
ACA-DC 50109 Repeated batch Glycerol
27.8 13.95
(Makri et al., 2010)
104.9 33.55
Y. lipolytica
Wratislavia
AWG7 Fed batch Raw glycerol
200 (total glycerol concentration - (Rywińska et al., 2010) 300 (total glycerol concentration) - Yarrowia lipolytica
A-101-1.22 Cell recycle Raw glycerol 250 96–107 (Rymowicz2010) et al.,
Y. lipolytica
Wratislavia AWG7 Continuous Glycerol 50 97.8 (Rywinska2011) et al.,
Y. lipolytica Wratislavia 1.31 Glycerol 150 76.0 (Tomaszewska et al., 2014) Y. lipolytica
Wratislavia AWG7 Batch 85.7
Y. lipolytica
2. Literature Review
________ ______ ______ ______ ______ ______ ______ ______ ______ ______ ______ ______ ______ ______ ______ ______ ______ ______ ______ ______ ______ ______ ______ ______ ______ ______ ______ ______ ______ ______ ______ ______ ______ ______ ______ ______ ______ ______ ______ ______ ___ ________ ______ ______ ______ ______ ______ ______ ______ ______ ______ ______ ______ ______ ______ ______ ______ ______ ______ ______ ______ ______ ______ ______ ______ ______ ______ ______ ______ ______ ______ ______ ______ ______ ______ ______ ______ ______ ______ ______ ______ ___ ________ ______ ______ ______ ______ ______ ______ ______ ______ ______ ______ ______ ______ ______ ______ ______ ______ ______ ______ ______ ______ ______ ______ ______ ______ ______ ______ ______ ______ ______ ______ ______ ______ ______ ______ ______ ______ ______ ______ ______ ___ ________ ______ ______ ______ ______ ______ ______ ______ ______ ______ ______ ______ ______ ______ ______ ______ ______ ______ ______ ______ ______ ______ ______ ______ ______ ______ ______ ___
________ ______ ______ ______ ______ ______ ______ ______ ______ ______ ______ ______ ______ ______ ______ ______ ______ ______ ______ ______ ______ ______ ______ ______ ______ ______ ______ ______ ______ ______ ______ ______ ______ ______ ______ ______ ______ ______ ______ ______ ___ ________ ______ ______ ______ ______ ______ ______ ______ ______ ______ ______ ______ ______ ______ ______ ______ ______ ______ ______ ______ ______ ______ ______ ______ ______ ______ ______ ______ ______ ______ ______ ______ ______ ______ ______ ______ ______ ______ ______ ______ ___ ________ ______ ______ ______ ______ ______ ______ ______ ______ ______ ______ ______ ______ ______ ______ ______ ______ ______ ______ ______ ______ ______ ______ ______ ______ ______ ______ ______ ______ ______ ______ ______ ______ ______ ______ ______ ______ ______ ______ ______ ___ ________ ______ ______ ______ ______ ______ ______ ______ ______ ______ ______ ______ ______ ______ ______ ______ ______ ______ _____
32
2.2.4.FERMENTATION CONDITIONS FOR YEASTS
Nitrogen source
Levels of nitrogen available in the medium have effect on citric acid accumulation by yeasts (Soccol et al., 2006), being yeast extract and ammonium chloride the most suitable organic and inorganic nitrogen sources, respectively, for citric acid production by Y. lipolytica among other yeasts (Rane and Sims, 1996). Under excess of the carbon source, limitation of mineral components of the medium, mainly nitrogen, are required to induce and obtain high levels of citric acid production (Aiba and Matsouka, 1978; Klasson et al., 1989; Lozinov et al., 1974; Papanikolaou et al., 2008b; Ratledge and Wynn, 2002). In the presence of high nitrogen concentrations, biomass growth is promoted (Vandenberghe et al., 1999). However, at low concentrations of nitrogen, after nitrogen exhaustion, intracellular AMP concentration rapidly decreases due to its cleavage by AMP-desaminase. Therefore, NAD+ or NAPD+ iso-citrate dehydrogenase, the enzyme responsible for the transformation of isocitric to α-ketoglutaric acid and allosterically activated by intracellular AMP, loses its activity (Papanikolaou and Aggelis, 2009). It results in accumulation of citric acid inside the mitochondrion (Papanikolaou and Aggelis, 2009), which is secreted into cytosol when its concentration overcomes a critical value (Figure 2).
pH
The pH parameter is reported as the most critical on citric acid production by yeasts (Yalcin et al., 2010). Therefore, initial pH must be defined and optimized according to the microorganism, the nature of the substrate and the fermentation type used (Yokoya, 1992). For yeasts, it was recommended to use an initial pH above 5. Bellow this pH value, citric acid production is impaired due to the accumulation of polyalcohols (i.e. erythritol, arabitol and mannitol) (Mattey, 1992; Roehr et al., 1993), the inhibition of citrate production in the cell and the transport of citrate from cell membrane (Anastassiadis and Rehm, 2005). Studies of Karasu et al. (2010) reported that for Y. lipolytica 57 and Y. lipolytica NBRC 1658 the maximum citric acid concentrations and citric acid yields were obtained in range of pH 5.2 to 7.0 (fermentation medium containing glucose). Moreover, the maximum specific growth rates were obtained at pH 5.2 and 6.0 for the strain 57 and NBRC 1658, respectively.
Temperature
The optimum temperature for citric acid production is dependent of microorganism and medium conditions used. For yeasts, the temperatures used for citric acid biosynthesis can range between 22 ºC and 35 ºC (Yalcin et al., 2010). Anastassiadis and Rehm (2006) observed that C. lipolytica growth and produce citric acid at 35 ºC, using a medium containing glucose.
Aeration
Citric acid production is an aerobic processes and therefore yields and process time are dependent of aeration (Cartledge, 1987; Kubicek, 2001; Soccol et al., 2006). The dissolved oxygen directly influences the citric acid formation, whereby oxygen concentration must be maintained above 25 % of saturation (Antonucci et al., 2001). Therefore, efficient aeration devices must be available, particularly when viscous fermentation media are used (Soccol et al., 2006). Both, aeration and agitation affect the dissolved oxygen and substrate available in the medium, by dispersing air and insoluble substrate in the medium in the form of fine bubbles (Crolla and Kennedy, 2004a, b). However, it was necessary to establish an optimum agitation in order to prevent shear stress on cell walls (Braga et al., 2015; Crolla and Kennedy, 2004a). Kamzolova et al. (2003) observed that citric acid production was inhibited by decreasing dissolved oxygen concentration from 60 to 95 % to 28 to 30 % saturation, for Y. lipolytica 704. However, for Y. lipolytica N1 it was reported an accumulation of 120 g∙L-1 of this metabolite at low
2. Literature Review
________ ______ ______ ______ ______ ______ ______ ______ ______ ______ ______ ______ ______ ______ ______ ______ ______ ______ ______ ______ ______ ______ ______ ______ ______ ______ ______ ______ ______ ______ ______ ______ ______ ______ ______ ______ ______ ______ ______ ______ ___ ________ ______ ______ ______ ______ ______ ______ ______ ______ ______ ______ ______ ______ ______ ______ ______ ______ ______ ______ ______ ______ ______ ______ ______ ______ ______ ______ ______ ______ ______ ______ ______ ______ ______ ______ ______ ______ ______ ______ ______ ___ ________ ______ ______ ______ ______ ______ ______ ______ ______ ______ ______ ______ ______ ______ ______ ______ ______ ______ ______ ______ ______ ______ ______ ______ ______ ______ ______ ______ ______ ______ ______ ______ ______ ______ ______ ______ ______ ______ ______ ______ ___ ________ ______ ______ ______ ______ ______ ______ ______ ______ ______ ______ ______ ______ ______ ______ ______ ______ ______ ______ ______ ______ ______ ______ ______ ______ ______ ______ ___
________ ______ ______ ______ ______ ______ ______ ______ ______ ______ ______ ______ ______ ______ ______ ______ ______ ______ ______ ______ ______ ______ ______ ______ ______ ______ ______ ______ ______ ______ ______ ______ ______ ______ ______ ______ ______ ______ ______ ______ ___ ________ ______ ______ ______ ______ ______ ______ ______ ______ ______ ______ ______ ______ ______ ______ ______ ______ ______ ______ ______ ______ ______ ______ ______ ______ ______ ______ ______ ______ ______ ______ ______ ______ ______ ______ ______ ______ ______ ______ ______ ___ ________ ______ ______ ______ ______ ______ ______ ______ ______ ______ ______ ______ ______ ______ ______ ______ ______ ______ ______ ______ ______ ______ ______ ______ ______ ______ ______ ______ ______ ______ ______ ______ ______ ______ ______ ______ ______ ______ ______ ______ ___ ________ ______ ______ ______ ______ ______ ______ ______ ______ ______ ______ ______ ______ ______ ______ ______ ______ ______ _____
34
Figure 2 - Pathway for the glycerol catabolism from Y. lipolytica and other yeasts (adapted from (Papanikolaou et al., 2008a; Ratledge and Wynn, 2002)). Abbreviations: GK - glycerol kinase; 3-P-GDH - 3-P-glycerol
dehydrogenase; PD - pyruvate dehydrogenase; MDm - malate dehydrogenase (mitochondrial); CS - citrate synthase; Ac – cis-Aconitate; ICDH - iso-citrate dehydrogenase; ICL - iso-citrate lyase; T1, T2, T3 - systems