ETF OR CEF, WHICH ONE IS THE BEST?
João Pedro Alves Pereira
Dissertation submitted as partial requirement of the conferral of
Master in Finance
Supervisor:
Profª Sofia Brito Ramos, Assistant Professor with Aggregation ISCTE Business School, Department of Finance
April 2014
I Abstract
This work performs an analysis between Exchange Traded-Funds (ETF) and Closed-end Funds (CEF), to help the common investor to decide for the best fund.
This analysis comprises a sample from the U.S. market fund that included 46 funds: 27 CEFs and 19 ETFs that represent 13 different benchmarks. All the funds are required to have at least five years of observations.
This work makes a comparative analysis of the performance of both funds using the Sharpe, Treynor, Appraisal, Hit and Sortino Ratio.
Results showed a clear superiority of ETFs, in the majority of benchmarks, ETF provided the best performance in two cases: the first, using all observations from all funds and the second using only the common period of observations between all funds with the same benchmark. Next, the analysis focus on the presence of mispricing, to look for which fund in the sample, deviates furthest from the Net Asset Value. It was concluded that the large majority of the funds show mispricing, but ETF funds trade at premium while CEF funds trade at discount.
Finally, CEF volume is analyzed. The goal is to understand on the impact of CEF average trading volume after the inception of a similar ETF. The evidence shows that in most cases the CEF trading volume increased after the inception of a peer ETF.
Key-words: Performance analysis, CEF, ETF, liquidity, mispricing JEL: G110; G23
II Resumo
Este trabalho tem como objectivo fazer uma análise objectiva entre Exchange Traded-Funds (ETF) e Closed-End Funds (CEF). Desta forma pretende-se ajudar a escolha do investidor comum sobre qual dos dois fundos oferece melhores possibilidades de retorno.
Para esta análise foi utilizada uma amostra retirada na sua totalidade do mercado de fundos dos Estados Unidos da América (E.U.A.). A amostra em questão inclui 27 CEFs e 19 ETFs que partilham 13 benchmarks diferenciados. Todos os fundos incluídos na amostra devem conter no mínimo cinco anos de observações.
Este trabalho efectua uma análise de performance utilizando os rácios Sharpe, Treynor, Appraisal, Sortino e Hit.
A análise dos resultados demonstrou uma clara superioridade na performance dos ETF sobre os CEF, os fundos ETF tiveram uma performance ajustada ao risco superior em dois casos analisados: primeiro utilizando todas as observações de todos os fundos e o segundo utilizando apenas o período comum de observações entre os fundos de cada benchmark.
Foi feita também uma análise de desvio de preço, para compreender qual dos fundos tinha maior tendência a transacionar a valores mais afastados do Net Asset Value. Foi concluído que a larga maioria dos fundos evidencia a presença de mispricing, estando os CEF a transaccionar a desconto e os ETF a prémio.
Por último, foi estudada a tendência da evolução do volume de transacção dos fundos CEF após a introdução de um ETF similar. Esta análise mostra que após a introdução de um ETF similar o volume dos CEFs tende a aumentar no período imediatamente a seguir na maioria dos casos estudados.
_________________________________________________________________________ Acknowledgments:
I would like to thank to my parents that have been so supportive throughout my academic career and that give me strength to finish my thesis.
I also would like to thank to Professor Sofia Ramos that has been a great supervisor, always available and with a lot of patience to help me every time.
III
List of tables
Table 1 Description of CEF sample ... 11
Table 2 Description of ETF sample ... 12
Table 3 Matching between benchmarks and funds ... 13
Table 4 Mispricing by fund type ... 18
Table 5 Fund evaluation: Summary of results using all observations of each funds ... 20
Table 6 Fund evaluation: Summary of results using only the common period of observations for each fund with the same benchmark ... 21
Table 7 Mispricing analysis ... 22
Table 8 Mispricing analysis ... 22
Table 9 CEF funds average trading volume ... 24
Table 10 CEF volume variation after peer ETF inception ... 25
IV
Index
1. Introduction ... 1 2. Fund Industry ... 3 3. Literature Review ... 7 4. Data ... 10 5. Methodology ... 14 5.1 Indicators ... 14 5.2 Risk measures ... 15 5.2.1 Beta ... 15 5.2.2 Specific Risk ... 15 5.3 Risk-adjusted returns ... 15 5.3.1 Jensen Alpha ... 15 5.3.2 Sharpe Ratio ... 15 5.3.3 Treynor Ratio ... 16 5.3.4 Sortino Ratio ... 16 5.3.5. Appraisal Ratio ... 16 5.4 Tracking error ... 17 5.5 Hit ratio ... 17 5.6 Mispricing ... 17 6. Results ... 19 6.1 Performance evaluation ... 19 6.2 Mispricing analysis ... 22 6.3 Volume Analysis ... 24 7 Conclusion ... 27 8 Bibliography ... 29 9 Attachments ... 311
1. Introduction
In the latest years, the fund industry witnessed an explosive growth, which is represented by the number of funds and the assets value. The fund industry includes not only the mutual fund sector, but also Closed-End Funds (CEFs) and Exchange-Traded Funds (ETFs).
This work aims to make a comprehensive analysis between Exchange-Traded Funds and Closed-End Funds, in order to conclude which one is a better choice for a retail investor, as they are close products. Despite that ETF and CEF are both traded on an exchange like an ordinary stock, ETF often trade close to their NAV whether CEF trade at discount.
The literature relating these two kinds of funds is scarce, because ETFs are a relatively young security. The first was launched in 1991 in Canada, while CEF are available since 1950s.
Despite the first ETF was launched in Canada in the Toronto Stock Exchange, the US market is the largest ETF market in terms of market capitalization and volume due to a huge development in the past few years.
This work makes a quantitative analysis comparing both funds for the same benchmark, which has not been done previously. Known ratios for risk adjusted performance and indicators are used such as Sharpe, Treynor, Appraisal, Sortino and Hit Ratio to have an analysis as objective as possible, and to be understandable by the common investor.
This analysis comprises a sample that includes 46 funds: 19 ETFs and 27 CEFs all of them from the US market fund. After, the ratios were computed for each fund in the sample and they were compared within each benchmark. The results show that ETF seem to have performed better in two occasions. First, when using all observations of all funds, the entire sample, ETF performed better in 9 out the 12 benchmarks. Second, when the sample was narrowed only to include the common period of observations of each fund with the same benchmark, ETFs had a stronger performance beating CEF 11 out 12 benchmarks. Despite CEF funds are actively managed and ETFs do not, CEF funds only manage to perform better than ETF in Appraisal Ratio, that measures a fund manager picking ability, about 50% of times, which means that CEF fund managers can not add as much extra return as expected in the majority of cases.
I also analyze the impact on volume of a CEF fund after the inception of a peer ETF, which consists in analyzing CEF volume before and after the introduction of a peer ETF. Evidence
2 shows that CEF volume tends to increase in the majority of cases, after the inception of a similar ETF. It does not appear to exist a cannibalization effect.
Finally I study mispricing, a common risk that both ETFs and CEFs investors face, mispricing is the difference between fund market price and Net Asset Value, the real value of the fund´s assets. Both assets trade at their market price and not at their Net Asset Value. Evidence shows that mispricing tends to be present in the majority of ETF and CEF funds. However, CEF funds are at discount while ETF funds are trading at premium.
The following sections present in more detail every step that leads to the conclusions presented previously.
First, in section 2, fund industry is characterized explaining what investors look for, how can funds help them, which types of mutual funds there are and what are their main characteristics. This section gives a focus on CEFs and ETFs showing their main common features and differences.
In section 3, the literature review presents the main references in the topic and what were their main conclusions of previous studies.
In section 4 is presented the sample used in the analysis, how the sample was narrowed into the final 46 funds. The sample is described using variables such as geographical focus, mean, standard deviation and launch date.
In section 5, methodology presents all the ratios used in the analysis and their interpretation. The last part of this section presents summary statistics for mispricing.
At last, section 6 presents the empirical results divided in three sub-sections: performance evaluation, mispricing analysis and volume analysis.
Performance evaluation presents the results of fund evaluation. There, is specified which benchmark performed better in each ratio, both using the entire sample and using only the common period of observations of each fund within the same benchmark.
Next, in mispricing sub-section are presented the main results of fund mispricing analysis and its conclusions.
At last, in liquidity analysis is presented the average trading volume for each CEF fund, its variation after the introduction of a similar ETF and is summarized the results that conclude that in the majority of times CEF volume increases after ETF inception.
3
2. Fund Industry
There are many different investments options available out there for investors to choose from. Each investor follows a strategy which depends on the relevant features for them. Among the features that are relevant for investors Markowitz (1952a, 1952b) identifies return and risk. An investor does not have unlimited funds to allocate to every existent security, so, the investor is forced to choose for the securities/products that are able to give him the desired return. The choice needs to be based on investors risk profile and investors needs, where one can seek a higher return or a safer return.
When the investor looks for a higher return, one has many different options to choose from. The most basic, even though riskier than risk-free deposit, are stocks and bonds, the most well known to the retail investor.
Besides from those securities, we have many more different options, which include mutual funds, complex products or derivatives, securities where their returns depends on the evolution of other securities like stocks, indexes or commodities.
A reason that makes an investor to look for mutual funds is diversification, with funds one has the opportunity of investing in illiquid assets, such as infrastructures, real estate, commodities or emergent markets assets that are only available to the common investor via fund.
A mutual fund is constructed in order to maintain to reach the investment objectives stated in the fund profile.
Funds allow investors to look for the liquidity premium, that the investor by himself is not able to achieve, due to the small amount in stake. Funds pool all the money from investors and get opportunities to invest that are not available to the retail investor.
One possibility of investing is enhanced indexing which combines elements of passive and active management. It attempts to generate modest excess returns compared to index funds and other passive management techniques.
Fund managers may achieve higher returns if they can identify undervalued stocks in the index, adjust holdings to include a larger proportion on better performance sectors or using other instruments such as derivatives.
Funds usually follow a benchmark, each one has a different number of stocks and companies from different sectors: that is the path to diversification.
4 In the fund industry this work is focused on Mutual Funds. There are four main kinds of mutual funds: Open-end Funds, Closed-End Funds, Unit Investment Trusts and Exchange-Traded Funds. Institutions like Vanguard, BlackRock, JP Morgan or PIMCO are usually in the top ten of mutual funds offer.
However, not all of these mutual fund types were available instantaneously by all the mutual fund companies. For example, John Boogle, founder of Vanguard refused for many years to offer ETFs because he considered them as short-term speculation.
Despite there are several mutual fund types, this work is focus in just two of those mutual funds: Exchange-Traded Funds (ETFs) and Closed-End Funds (CEFs).
ETF and CEF are available for retail investors however, as a complex product it is needed financial knowledge about them.
ETF and CEF are two kinds of investment funds (organized companies) that have similar characteristics. Both of them are organized structures that choose to track an index, and try to replicate its return. In ETFs case the fund needs to own all the stocks in the index with their real weight while in CEFs case they can choose which stocks to acquire to track the index, usually the ones with biggest market cap weight. The goal is having as few stocks as possible to track a high percentage of the index. In that way, they have some space to look for other securities for extra return.
Both funds acquire illiquid securities which gives the possibility to the retail investor to look for a liquidity premium. However is important to understand that the investor will never hold those securities, but the shares of the fund, either ETF or CEF shares.
In this way the retail investor only acquire fund shares and not their underlying assets, so they access illiquid securities in a liquid and cheap way. Why cheap? Because to hold all the stocks from same index the investor would bear transaction costs for all those stocks, and would need to re-balance it weekly or daily. CEFs and ETFs do it for us easily.
For an index like PSI-20 or IBEX-35 that could be feasible, while for indexes like NASDAQ100 or NIKKEI225 that would became totally unfeasible, due to the number of stock in stake.
So, with ETF and CEF the investor will only bear transaction costs of the fund, in ETF case every time when one changes his portfolio and in CEF case every time CEF changes its composition. This cost will be much lower than the investor trying to do the same on his own.
5 How such funds work? Let us understand next: All investors buy shares from the fund, which is basically a company, and that company is going to use all the money collected from investors to invest in some portfolio, that is going to have different weights in each sector and securities type. So if an investor puts 10,000€ in the fund, those 10,000€ are going to be proportionally distributed to the composition of the fund´s portfolio.
Imagine 40% in security A, 35% in security B and 25% in security C with a value of 10 million Euros is the composition of the fund α,
So the investor will have 4,000€ in security A, 3,500€ in security B and 2,500€ in security C, without owning any of those securities but replicating their return by buying a CEF/ETF share. He is going to have a return depending on the evolution of the value of each of those securities. The investor remains with his units of participation but its value can increase like an ordinary stock on the market and investor’s value can increase without any further changes in his portfolio.
This example is to understand some benefits of fund investing: reducing transaction costs (owning one security instead of three), diversification (money spread by different securities), and liquidity (is easier to trade a share of CEF/ETF than an individual share).
Both ETF and CEF are portfolios of securities traded on a stock exchange like a normal stock. ETF and CEF are close products but are not the same thing.
They share characteristics, but they have some details that distinguish them. ETF is a young vehicle, the first ETF appeared in 1991 in Canada (Toronto S.E.) and in 1993 the first US ETF that is today the biggest by market cap.
ETF trade close to the Net Asset Value (NAV) – represents the real value of assets owned by the fund - because they are easier to arbitrage. When considering arbitrage opportunities in both funds is necessary to consider that sometimes arbitrage can became too costly.
Institutional investors can force creation and redemption process of ETF shares (via in-kind process), because they can begin to buy the underlying securities and to sell ETF shares, or vice-versa. In order to the arbitrage opportunity to disappear the price of ETF share must correct automatically.
Kato, Linn, & Schallheim (1990) “Found evidence that the market does not offer persistent arbitrage opportunities”.
6 ETF are known for being a growing industry, in number, size, value, as a new investment vehicle and as an exotic investment, while CEFs are already in the stagnation stage.
When investing in ETF an investor knows exactly what he owns because he knows how it is constructed.
Each ETF fund provides detailed information available for investors, since its holdings, credit ratings, duration, yield and more, all this information is published almost in real time, so is possible to know what might affect future ETF price.
On the other hand CEFs that are also a basket of securities began with an IPO and it has a fixed number of shares, it can be traded at premium or discount.
CEF funds are actively managed (ETFs do not) and so they can use unconventional strategies to enhance their return, such as options or leverage. Because CEFs number of shares is fixed, managers do not have to worry about inopportune times to redemption and do not have to sell distress securities in a hurry.
More of the regular discount characteristics of CEF apply to ETFs. CEF are taxed each time the fund changes securities and ETF only when an investor trades shares, that is the tax advantage of the ETFs over CEFs.
7
3. Literature Review
ETF and CEF are two mutual funds that track an index used as benchmark with the goal of replicating their return. An investor when looking for mutual funds to replicate an index return must choose, because ETF and CEF are substitute products. To be able to choose, the investor needs to know which fund offers the best tracking ability, which fund has a lower cost or which fund has the higher liquidity. Because ETF and CEF are two different products, their share price and transaction costs will be different. Barnhart & Rosenstein (2010) test whether ETFs are a better tracking vehicle than CEFs. They find that ETFs record a higher trading volume making them more attractive for investors. ETFs seem less expensive because each investor only pays the trades that he/she makes, leading to lower trading costs.
If an investor holds the same portfolio of ETF shares, he has not transaction costs because it has the same number of ETF shares. However in the CEF structure each time there are trades, such as changes in the composition of the portfolio, transaction costs are pooled between all investors, which penalize investors who do not change their portfolio.
Both CEFs and ETFs use NAV (Net Asset Value) as a reference to their share price on the market. Usually ETF trade at a closer value to NAV, because as ETF can be traded at any point during the day, their arbitrage turns easier if share price deviates from NAV.
As for CEF their arbitrage is harder because they are only traded once a day, which usually leads to a larger difference between share price and CEF NAV, so CEF fund price are less connected to NAV.
Due to ETFs easier arbitrage Hughen & Mathew (2009) found consistent evidence of ETF being more efficiently priced than CEF, they conclude that otherwise any discount/premium can be used by institutional investors. When institutional investors face an ETF arbitrage opportunity they can take advantage though in kind via process forcing ETF share price to adjust automatically. Eventually investment companies are able to manage CEF shares supply.
When a new ETF, tracking the same benchmark as an existent CEF is launched, CEF tends to present abnormal discounts in his share price. Barnhart & Rosenstein (2010) conclude that abnormal discounts are verified because as soon as a new ETF is launched investors want to sell all their CEF shares because they see ETF as a better product.
8 CEF funds are launched into the market through an IPO where they initially trade at premium, Hughen & Mathew (2009) conclude that after one year CEF funds eventually fall into discount, however according to Yeyati & Ubide (1998) CEF country funds trade with a large premium in crisis events.
Investors look for funds in order to seek for an exposure to a diversified portfolio of foreign stocks, however Manzler & Slezak (2008) found that US ETFs still have a high correlation with S&P 500.
In the process they also look to lower their trading costs, Leonard & Shull (1996) suggest that ETFs may provide a more effective low-cost strategy of diversifying internationally than CEFs and according to Manzler & Slezak (2008) CEFs are more expensive than ETFs: 1.38% against 0,71%. So far, ETFs seem to be a better product for the investor: higher liquidity, easier arbitrage and lower trading costs.
However ETFs do not have only good features. When there are changes in the index, for instance two or three companies are going to be excluded from the index and new companies are going to enter in the index, ETFs have to follow also those changes in order to keep their tracking abilities (ETF need to fully replicate their benchmark), ETFs are going to have higher costs when comparing to other mutual funds such as CEFs or Open-End funds (OEFs). For ETF are better smaller indexes. They have fewer trades to make when a change in the index happens. Despite ETFs are more liquid than CEFs they are less liquid than OEFs, according to Guedj & Huang (2008). ETFs are more for long-term investors, however ETF seem better than OEFs because OEFs do not account for future price impact and they only trade once at the end of the trading day like CEFs.
Like CEFs, OEFs investors also share trading costs each time the fund changes assets, however Guedj & Huang (2008) state that OEF manager can be more efficient than ETF if he is able to decreases transaction costs by forecasting overall liquidity needs.
When comparing ETFs and CEFs performance, Harper, Madura, & Schnusenberg (2006) conclude that ETF have higher mean returns and Sharpe ratio. They conclude that ETF passive strategy, that is implicit with ETF, is better than CEF active management. CEF funds can not perform better than ETFs because active strategy increases CEF transaction costs. ETF tax advantage over CEF has been discussed, however Harper, Madura, & Schnusenberg (2006) conclude that is difficult to generalize it.
9 I-Shares was the pioneer of making ETF available for every retail investor around the world, they are today the main ETF provider in the world with more than 711 thousand million US dollars in assets. I-Shares are committed to help investment consultants in using it in the best way. I-Shares are currently managed by BlackRock. Despite I-Shares are able to replicate foreign index return, Pennathur (2002) found that they still have a high degree of U.S. market exposure. I-Shares do not track perfectly the benchmark, they invest about 95% on the index and leave the remaining to look for other assets like emergent markets, according to Pennathur (2002) this strategy is followed to look for risk sharing and low correlation. The capability of I-shares following MSCI indexes decreased in the past years due to Asian crisis, it forced redemption and forced to reduce transaction costs.
More often than not, an investor may want to increase his exposure to a certain index, without having to buy additional shares of ETF or CEF to increase that exposure. A common solution is to invest in LETFs (Leverage ETFs). Investing in LETFs is a common attempt to earn superior returns when betting on the direction of the market, however LETF may be unsuitable for buy/hold investors because it offers a big exposure to some ETF.
The fund manager will invest 2 times or 3 times the value of the index to try to replicate 2 or 3 times the return of the fund.
However, despite leveraged ETFs fund managers attempts to earn superior returns, according to Avellaneda & Zhang (2010) more often than not LETFs underperform (have moderate returns combined with high volatility) static leverage ETF (over-perform large return with relatively lower volatility). Avellaneda & Zhang (2010) state that LETF underperform is linked with their need to be rebalanced frequently, in the need to sell low and buy high, is going to lead to underperform to static leverage portfolios. In that way, Avellaneda & Zhang (2010) identified: funding rate, expense ratio, cost of borrowing (when short); convexity (relation of LETF prices and beta) associated with beta and realized variance as the main variables that the relation between LETF and its underlying ETF depends on.
LETF will not guarantees the desired return (the same as static ETF), is possible to adjust the holding of LETF by making dynamic hedging, in that way we should be able to replicate the target return of ETF without additional risk, due to volatility fluctuations. However, LETFs are more suitable for high frequency traders due to their very high trading needs.
10
4. Data
To be able to make a comparative analysis between ETF funds and CEF funds is necessary to select a representative sample of the U.S. market fund. U.S. market fund is the more developed market fund in the world, it has a high number of funds, a huge variety and it has available data. A survivorship bias-free sample from Lipper with 1.117 ETFs and CEFs were the initial possible funds for the final sample. To filter funds, two main criteria were used: all the funds should have at least 5 years of observations and each ETF and CEF should share a benchmark.
If some index do not have both ETFs and CEFs tracking them they were automatically off the sample.
Despite the 5 years of observations, longer data was included in CEF funds in order to analyze CEF volume evolution throughout the years. Five years of observations should guarantee the decrease of the weight of one-time events, such as crisis events.
After all criteria were applied the sample was narrowed to 46 funds divided into: 19 ETFs and 27 CEFs with all of them traded in United States of America exchange. Price, volume, market value, NAV and price index were the variables extracted in order to analyze performance, volume and mispricing of each fund in the sample.
All data was extracted from Bloomberg Terminal and Thomson Reuters Datastream. In the analysis daily data is used in order to provide a larger number of observations.
The following tables present CEFs (table 1), ETFs (table 2) and the link between each fund and its benchmark (table 3).
Table 1 and 2 describe several features of CEF and ETF funds used. Columns present code, name, geographical focus, inception date, mean and standard deviation.
11
Table 1 Description of CEF sample
Code Fund name Geo. Focus Date Mean S. Deviation 1 ING Risk Managed Natural Resources Fund Global 24-10-2006 -0,04% 1,61% 2 Asia Tigers Fund Inc Asia Pacific 29-11-1993 0,02% 1,95% 3 B. Rock Int. Growth and Income Trust Global ex US 30-05-2007 -0,06% 1,98% 4 AllianzGI Global Equity & Conv. Inc. Fund Global 26-09-2007 -0,03% 2,19% 5 Lazard World Dividend & Income Fund Inc Global 27-06-2005 -0,02% 1,78% 6 B. Rock Global Opportunities Equity Trust Global 26-05-2005 -0,03% 1,79% 7 PIMCO Global StocksPLUS & Income Fund Global 26-05-2005 0,00% 2,20% 8 AllianzGI InteR. & Premium Strategy Fund Global ex US 27-04-2005 -0,04% 1,79% 9 Morgan Stanley E. M. Fund Inc Global ex US 25-10-1991 0,02% 2,10% 10 Templeton E. M. Fund Global 05-03-1987 0,01% 1,48% 11 India Fund India 14-02-1994 0,02% 2,50% 12 H&Q Life Sciences Investors USA 08-05-1992 -0,01% 1,51% 13 H&Q Healthcare Investors USA 23-04-1987 0,00% 1,47% 14 Eaton Vance Enhanced Eq. Income Fund II USA 26-01-2005 -0,02% 1,60% 15 First Trust Dividend and Income Fund Global 20-09-2007 -0,05% 2,33% 16 Eaton Vance Tax-Adv. Div.Income Fund USA 30-09-2003 0,00% 1,61% 17 Royce Micro-Cap Trust Inc USA 14-12-1993 0,01% 1,77% 18 Royce Value Trust Inc USA 19-11-1986 0,00% 1,65% 19 Eaton Vance Tax-Man. Global Eq. Inc Fund Global 27-02-2007 -0,05% 1,86% 20 Alpine Total Dynamic Div. Fund Global 26-01-2007 -0,10% 2,23% 21 Eaton Vance Tax-Man. Diver. Eq. Inc Fund USA 30-11-2006 -0,04% 1,69% 22 Kayne Anderson Energy Develop. Company USA 21-09-2006 0,01% 2,70% 23 Alpine Global Dynamic Dividend Fund Global 26-07-2006 -0,08% 2,34% 24 Advent/Claymore Enha. Gr. & Inc. Fund Global 26-01-2005 -0,03% 1,47% 25 Denali Fund USA 25-11-2002 0,10% 1,67% 26 Adams Express Co USA 30-10-1959 -0,01% 1,27% 27 BlackRock Enhanced Capital & Inc. Fund USA 30-04-2004 -0,02% 1,49%
Note: Date stands for inception date of the fund, for CEF funds represents when IPO is launched and the fund became available for retail investor.
12
Table 2 Description of ETF sample
Note: Despite all CEF funds in this sample are traded on the American market they can own assets with a different geographical focus.
Code Fund Geo. Focus Date Mean S. Deviation 1 Direxion Daily Energy Bull 3x Shares USA 06-11-2008 0,04% 5,21% 2 Select Sector Energy SPDR Fund USA 16-12-1998 0,03% 2,05% 3 IShares MSCI All Coun. Asia ex Japan ETF Global Ex US 13-08-2008 0,03% 2,13% 4 IShares MSCI ACWI ex US ETF Global Ex US 26-03-2008 0,00% 1,89% 5 SPDR MSCI ACWI ex-US ETF Global Ex US 10-01-2007 0,00% 1,87% 6 IShares MSCI ACWI ETF Global 26-03-2008 0,01% 1,75% 7 IShares MSCI EAFE ETF Global Ex US 14-08-2001 0,01% 1,74% 8 IShares MSCI E. M. ETF Global Ex US 07-04-2003 0,02% 2,35% 9 IShares Nasdaq Biotec. ETF USA 05-02-2001 0,05% 1,45% 10 IShares Russell 1000 Growth ETF USA 22-05-2000 0,04% 1,26% 11 IShares Russell 1000 Value ETF USA 22-05-2000 0,02% 1,43% 12 ProShares Ultra Russell2000 USA 23-01-2007 0,00% 3,84% 13 IShares Russell 2000 ETF USA 22-05-2000 0,03% 1,79% 14 Direxion Daily S&P 500 Bull 3X Shares USA 05-11-2008 0,26% 2,22% 15 ProShares Ultra S&P500 USA 19-06-2006 0,02% 2,89% 16 IShares Core S&P 500 ETF USA 15-05-2000 0,02% 1,40% 17 SPDR S&P 500 ETF Trust USA 22-01-1993 0,02% 1,41% 18 SPDR S&P 500 Value ETF USA 25-09-2000 0,05% 1,09% 19 IShares S&P 500 Value ETF USA 22-05-2000 0,02% 1,51%
13
Table 3 Matching between benchmarks and funds
Code Benchmark ETF CEF
1 Energy S. Sec. Index Daily Energy 3x(1) SPDR Energy(2)
Risk Managed(1)
2 MSCI AC Asia ex Japan NR USD IShares Asia(3) Asia Tigers(2) 3 MSCI AC World ex USA NR
USD
IShares ACWI(4) SPDR MSCI(5)
B. Rock International(3)
4 MSCI AC World NR USD IShares ACWI(6) Allianz GI(4) Lazard WD(5) B. Rock Global(6) 5 MSCI EAFE NR USD IShares EAFE(7) PIMCO(7)
Allianz International(8) 6 MSCI EM NR USD IShares E. M. (8) Morgan Stanley E.M.(9)
Templeton E.M.(10) 7 NASDAQ Biotec. CR IShares Nasdaq(9) H&Q Life(12)
H&Q Healthcare(13) 8 Russell 1000 Growth TR IShares Russel Gr.(10) E. Vance Enhanced II(14) 9 Russell 1000 Value TR IShares Russel Val.(11) First Trust(15)
E. Vance Tax-Adv.(16) 10 Russell 2000 TR ProShares Russel(12)
IShares Russel (13)
Royce Micro-Cap(17) Royce Value(18) 11 S&P 500 TR Direxion Daily 3X(14)
ProShares ultra (15) IShares Core(16) SPDR ETF trust (17)
E. Vance Tax-M. Global(19) Alpine Total(20)
E. Vance Tax-M. Div. (21) Kayne Anderson(22) Alpine Dividend Fund(23) Advent/Claymore(24) Denali Fund(25) Adams Express(26) 12 S&P 500 Value TR Index SPDR Value ETF (18)
IShares S&P Value (19)
B. Rock En.Capital(27)
13 MSCI India NR USD N/A India Fund(11)
14
5. Methodology
Following the literature on performance evaluation, several ratios were used to evaluate fund performance based on return measures and risk-adjusted returns.
5.1 Indicators
Mean ( ) and standard deviation of returns (σp) will be the initial guidelines for fund evaluation, for return and risk comparison. The analysis will be based on risk adjusted returns in order to have a more accurate value of the real performance of the funds.
Alpha was computed trough excel, making a regression with return of the security and returns of the benchmark using function intercept. Further it will be presented Jensen Alpha as well. Alpha concept is to look for excess returns in funds existent in the markets.
Market model is a regression constructed to explain the relation existent between excess returns on the market and an observable market index. Market model specified that stock returns can be explained properly by the broad market index. So this model uses an observable index as a proxy for the market model (that is not possible to observe) and uses observable realized returns from each securities that track some benchmark in order to estimate in an easy way the asset beta.
Market model equation is the following:
T (1)
Where,
=total security return β = security beta
= market return T = error term
15 5.2 Risk measures
5.2.1 Beta (β): Is a systematic risk measure. It measures how a security return will follow benchmark return. 1 is the reference value which means that security return movement must be towards the same direction as benchmark, so both returns should be connected.
Beta will be used as reference of how each fund follows their benchmark and how much is expected to follow their return. Beta can be computed trough excel function slope making a regression between security returns and benchmarks returns.
5.2.2 Specific Risk (σep): Is the risk that can be diversified away. Each investor only bears that
risk to look for extra return (due to extra risk beard). Specific risk can be obtained by excel STEYX function using security and benchmark returns X and Y variables.
5.3 Risk-adjusted returns
To compare performance of both funds is necessary to use risk adjusted measures in order to corroborate the conclusion for which fund to choose.
5.3.1 Jensen Alpha measures abnormal return over an expected (benchmark) return. (2)
Whereas,
= alpha return =risk free rate
5.3.2 Sharpe Ratio
(3) Where,
σp = standard deviation
Sharpe Ratio measures the unit of extra return (risk premium over the risk free rate) per unit of total risk beard. Logic is: a higher value means a better fund performance.
16 5.3.3 Treynor Ratio
(4)
Treynor Ratio measures extra return (over the risk free return) per unit of portfolio risk (β). The reasoning is the same as for Sharpe Ratio a higher value represents a better performance.
5.3.4 Sortino Ratio
(5) Where;
T – Benchmark return
DR – Semi-standard deviation
Sortino Ratio is an update of Sharpe Ratio. It also measures funds/securities in a return-risk logic, however it does not penalize the upside potential volatility (because it is not a bad thing) and only penalizes the downside volatility – volatility under the target, downside volatility. Once more the higher value is the better fund.
5.3.5. Appraisal Ratio
(6)
Whereas:
σe = unsystematic risk
Appraisal ratio is used to measure a fund manager picking ability. It compares fund alpha to unsystematic risk. Going along with previous ratios a higher value represents a higher performance of the fund.
17 5.4 Tracking error
Tracking error is a measure that has the goal of analyzing how much a fund tracks an index, which means that the return achieved by the fund should be more or less close to the one achieved by the index depending on the tracking error. A lower tracking error is better and with that we should expect a portfolio return closer to benchmark return.
(7)
T.E. = Tracking error Rb = Benchmark return
n = number of return periods (days)
If the tracking error is zero (0) means that the fund tracks perfectly the index. According to Pennathur (2002) we should expect low tracking error for ETFs.
5.5 Hit ratio
(8)
Hit ratio concept is easy to understand. Its goal is to measure how many times each fund beat (outperform) their benchmark. A value over 0.500 is already considered good, because the fund wins in the majority of cases.
Despite CEFs attempt to beat the benchmark, according to Bal & Leger (1996) most of times they fail to achieve that.
5.6 Mispricing
As mentioned in the Literature Review CEF funds trade at discount approximately one year after inception. When funds trade at discount or premium, relatively to their NAV – Net Asset Value, the real share price, it means that the price is not correct – is mispriced.
18 This analysis looked for mispriced funds investigating which benchmarks have more mispriced funds and how mispricing is distributed throughout the sample.
Next, are going to be presented summary statistics of mispricing presented in sample used in the analysis in order to characterize variables such as mean, standard deviation, maximum or minimum were used. Below is presented the mispricing equation:
(9)
Table 4 Mispricing by fund type
Fund Mean Standard deviation Max Min Sum N
CEF -0,0555 0,1252 0,8804 -0,4032 -3228,633 58194
ETF 0,0004 0,0064 0,1211 -0,0971 11,4042 31446
Total -0,0359 0,1044 0,8804 -0,4032 -3217,229 89640
Note: All presented variables are relative to the variable mispricing.
Table 4 presents summary statistics for the variable mispricing by fund type.
A larger number of observations for CEFs than ETFs was included to study volume before and after ETF inception.
19
6. Results
6.1 Performance evaluation
In order to compare ratios among all funds, the sample was divided by the 12 benchmarks that comprise both ETFs and CEFs. Sharpe Ratio, Treynor Ratio, Appraisal Ratio, Sortino Ratio and Hit Ratio were the ratios used in the analysis, which are mainly risk-adjusted measures.
In the analysis, first it was computed each one of the five ratios for all funds presented. Then, inside each benchmark it was computed which fund, either CEF or ETF, performed better comprising all the funds of each benchmark for each ratio used. Which means that using the values already computed it was only necessary to identify which fund type was best inside each benchmark in every one of the ratios.
At last, after knowing which fund type was best for each ratio inside each benchmark, it was only necessary to count which fund type was best more times in each benchmark.
The summary of results of the last two steps of these computations is possible to check in tables 5 and 6. Those tables present all the benchmarks, the ratios used and the combination of results. The last row summarizes which fund performed better in a risk-adjusted way in each benchmark. Between table 5 and 6 there is one difference: the sample size used. Table 5 summarizes the results when all the observations of each fund were used to compute the ratios, where can exist a huge difference in number of observations (for each year added or subtracted each fund can have more or less 250 observations – trading days).
However, when using all the observations for all funds the results can become biased because a worse period from one fund can become “hidden” in a larger number of observations accounted and in the same way a great year for one fund with fewer observations can have an over increase in the performance evaluation ratios. So, in order to achieve a more accurate comparison the sample size was narrowed. It was narrowed in order to all funds from each benchmark have the same number of observations, so, all the funds can be compared using the same time-frame and crossing the same events decreasing the possibility of an over or under reaction between them. When using all observations of all funds Sharpe Ratio and Treynor Ratio give the exact same conclusion either CEF or ETF, however, which does not happen once the sample is narrowed.
20 Appraisal Ratio measures a fund manager picking ability, because CEF funds are actively managed and ETFs do not, it should be expect that CEF funds perform better in all funds despite the sample size. However, the results are mixed (each fund type is best in Appraisal Ratio about 50% of times) which can state that CEF fund manager ability to look for extra return is low.
Ta b le 5 Fu n d e v a lu a tio n : S u m m a ry o f re sul ts u si n g a ll o b se rv a tio n s o f ea ch fu n d s Ea ch r o w re p res en ts fo r ea ch r a ti o w h et h er it w ere ET F o r C EF th a t a ch ie ve t h e b es t p er fo rm a n ce i n a ve ra g e b et w ee n a ll t h e fu n d s in cl u d ed i n e a ch b en ch m a rk . T h e la st r o w s u m m a ri zes w h ic h f u n d t yp e p er fo rm ed b et te r b et w ee n a ll f u n d s in si d e ea ch b en ch m a rk i n t h e m a jo ri ty o f ra ti o s u se d . R ati o/B enc hmar k Ene rgy Asia W or ld ex U S A W or ld EAFE E. M. Na sdaq R ussel 1000 Gr . R ussel 1000 V a. R ussel 2000 SP TR S P Va lue S ha rpe
ETF CEF ETF ETF ETF CEF ETF ETF ETF CEF ETF ETF
Tr
eynor
ETF CEF ET
F
ETF ETF CEF ETF ETF ETF CEF ETF ETF
Appr aisal C EF C EF
ETF CEF ETF CEF CEF ETF ETF CEF CEF ETF
S
or
ti
no
ETF ETF ETF ETF ETF ETF ETF ETF ETF ETF ETF ETF
Hit ETF CEF ETF CEF CEF ETF ETF CEF ETF ETF ETF CEF
B
est F
und
ETF CEF ETF ETF ETF CEF ETF ETF ET
F
CEF ETF ETF
In both sample sizes there are two benchmarks that have total accordance in which fund type is the best. In the first case World ex USA and Russel 1000 Value are better with ETF no matter what ratio is used, with the narrowed sample Russel 1000 Value is able to maintain ETF dominance and instead of World ex USA is S&P Value that accomplishes ETF dominance with all the funds used.
21 After analyzing the results with the first stage, ETFs seem to have performed better, being the best fund 9 out of 12 possible times. Attached in tables 12 to 19 is possible to have more detail about the fund evaluation using all observations.
Ta b le 6 F u n d e v a lu a ti o n : S u m m a ry o f re sul ts u sin g o n ly th e co m m o n p er io d o f o b se rv a tio n s fo r ea ch fu n d with th e sa m e b en ch m a rk Ea ch r o w r ep re se n ts fo r ea ch r a ti o w h et h er it w ere ETF o r C EF th a t a ch ie ve t h e b est p er fo rm a n ce i n a ve ra g e b et w ee n a ll t h e fu n d s in cl u d ed i n e a ch b en ch m a rk . T h e la st ro w s u m m a ri zes w h ic h f u n d t yp e p erf o rm ed b et te r b et w ee n a ll fu n d s in si d e ea ch b en ch m a rk i n t h e m a jo ri ty o f ra ti o s u se d . R ati o/B enc hmar k Ene rgy Asia W or ld ex U S A W or ld EAFE E. M. Na sdaq R ussel 1000 Gr . R ussel 1000 Va . R ussel 2000 S P TR S P Va lue S ha rpe C EF
ETF ETF ETF ETF ETF ETF ETF ETF ETF ETF ETF
Tr
eynor
CE
F
ETF ETF ETF ETF ETF/
C
EF
ETF ETF ETF ETF/
C EF C EF ETF Appr aisal C EF
ETF ETF CEF ETF CEF CEF ETF ETF CEF CEF ETF
S
or
ti
no
ETF ETF ETF ETF ETF ETF ETF ETF ETF ETF ETF ETF
Hit ETF CEF CEF CEF EFC ETF ETF CEF ETF ETF ETF ETF
B
est F
und
CEF ETF ETF ETF ET
F
ETF ETF ETF ETF ETF ETF ETF
Despite the narrowed sample drops a lot of observations, it does not affect the final outcome, by the opposite it enhances the final conclusion even stronger. Instead of ETF being the best fund 9 out 12 times, ETF are able to accomplish that 11 out 12 times.
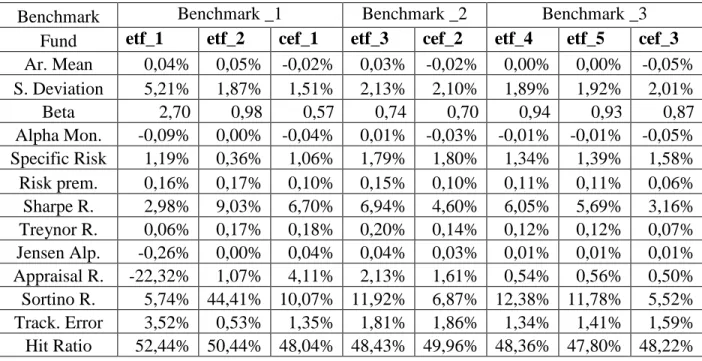
22 Attached in tables 20 to 27 is possible to have more detail about the fund evaluation when is used the same number of observations for funds inside each benchmark.
6.2 Mispricing analysis
In the following tables (7 and 8) are presented results from the mispricing analysis that characterizes the sample.
Table 7 Mispricing analysis
Number of observations = 89236 R-squared = 0,0718
Adjusted R-squared = 0,0717
Table 8 Mispricing analysis
Mispricing Coefficient Standard Error t Statistic
ln_ret 0,1456 .0175 8,34
year 0,0029 .0001 24,73
CEF -0,0519 .0007 -71,6
_cons -5,8595 .2370 -24,7
-cons stands for constant
In the previous tables is possible to understand that CEF is trading at discount and ETF is trading at premium, because CEF coefficient is negative and statistically significant. The presence of CEF discount in the sample corroborates what was discussed and reviewed in the literature – CEF eventually end up trading at discount some time after inception.
One can conclude that as the years go by, mispricing tends to increase, which goes along with the literature because CEF price is said to be at discount after approximately one year, so more time after the inception reflect future CEF discount that has the trend to increase throughout the years. When return increases, mispricing increases as well. All these results are statistically significant despite R2 tell us that this model explains few (7.18%) of mispricing.
23 Of the 13 benchmarks just one of them does not show in average, mispricing. All mispricing values are small, which makes it hard to take advantage of arbitrage opportunities. Most of CEF funds show in average mispricing which goes along with what was expected initially.
However ETF funds in a large majority also show mispricing which can suggest that ETF are not as efficiently priced as it was expected and that ETF arbitrage is not that easy to accomplish, otherwise institutional investors could take advantage of a lot of opportunities with ETF funds. Each fund and benchmark summary statistics are attached in tables 29 to 37 where is possible to find more detail.
All data used is end of day price which means that during the day arbitrage can exist just for a few seconds and even by a very small amount, which means that in the majority of cases arbitrage can only compensate with a very large trade.
Attached in table 41 a) to m), is possible to analyze benchmark mispricing regressions, whether benchmarks are at premium or discount and what is their evolution throughout the years. Benchmark 5 (MSCI EAFE NR USD Index) is the only one that is trading at premium, the remaining ones are trading at discount. All mispricing coefficients are statistically significant for all benchmarks. MSCI EAFE NR USD Index (benchmark 5), is used in the U.S. as the main benchmark to ensure international equity performance. The index comprises developed markets outside North America, such as Europe, Asia, Australia and Far East.
In benchmarks 1, 5, 6, 7, 9 and 12 the coefficient is positive and statistically significant for year, which means that mispricing tends to increase across the years. By the other hand benchmarks 3, 4, 8, 10 and 11 mispricing tends to decrease across the years. Only for benchmark 2 is not possible to take any conclusion because the coefficient is not statistically significant.
At last, the ln_ret coefficient is positive and statistically significant for benchmarks 2, 3, 4, 5, 6, 7 and 9, which means that when return increases mispricing increases as well. However, for the remaining benchmarks is not possible any conclusion because the coefficient is not statistically significant.
24 6.3 Volume Analysis
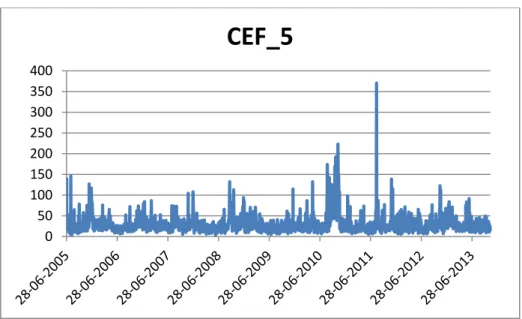
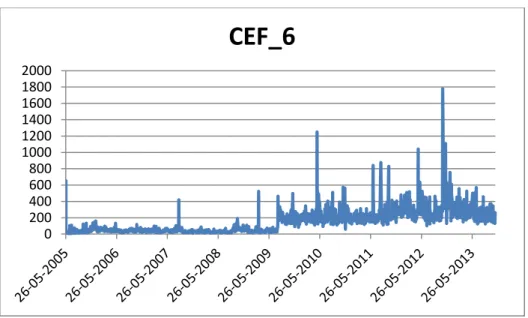
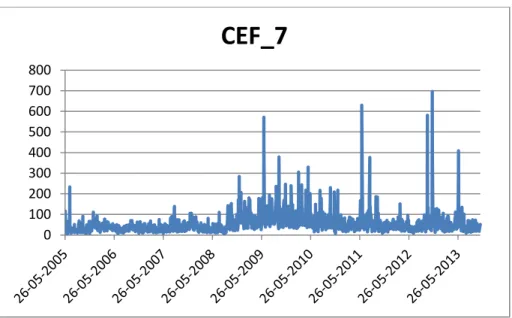
In this section is going to be presented CEF volume analysis. In table 9 is computed CEF funds average trading volume across the entire sample.
Table 9 CEF funds average trading volume
Funds Average Trading Volume
cef_1 80,77 cef_2 19,02 cef_3 384,09 cef_4 34,45 cef_5 28,92 cef_6 149,35 cef_7 52,48 cef_8 49,86 cef_9 39,66 cef_10 120,20 cef_11 345,04 cef_12 51,88 cef_13 67,04 cef_14 153,02 cef_15 42,08 cef_16 187,14 cef_17 58,22 cef_18 146,06 cef_19 995,53 cef_20 991,84 cef_21 483,12 cef_22 61,60 cef_23 131,92 cef_24 47,72 cef_25 9,37 cef_26 109,41 cef_27 100,37
Note: All funds were divided according to their benchmarks. Then, CEFs trading volume was computed after the inception of the similar ETF (competitor within the same benchmark). For benchmarks that have more than one ETF, CEFs daily average trading volume was computed for each one of those different inception dates. The new average volume computed is between the ETF inception until 7 November of 2013 (last day of observation). Trading volume variation is shown at table 10 after the introduction of an ETF. The results are in percentage which represents the direction of the evolution of trading volume.
25
Table 10 CEF volume variation after peer ETF inception
Bench._1 cef_1 etf_1 0,00% etf_2 4,61% Bench. _2 cef_2 etf_3 -39,53% Bench. _3 cef_3 etf_4 1,78% etf_5 0,00%
Bench. _4 cef_4 cef_5 cef_6
etf_6 -0,53% 0,84% 35,91%
Bench. _5 cef_7 cef_8
etf_7 1,86% 2,69%
Bench. _6 cef_9 cef_10
etf_8 9,08% 16,01%
Bench. _7 cef_12 cef_13
etf_9 27,99% 20,84%
Bench. _8 cef_14
etf_10 2,74%
Bench. _9 cef_15 cef_16
etf_11 0,00% 0,93%
Bench. _10 cef_17 cef_18
etf_12 22,62% 29,61% etf_13 13,59% 17,02%
Bench. _11 cef_19 cef_20 cef_21 cef_22 cef_23 cef_24 cef_25 cef_26
etf_14 4,32% 12,25% 6,21% -10,11% 8,60% 2,77% -42,08% 22,39% etf_15 0,00% 0,00% 0,00% 0,00% 0,00% 1,47% -25,80% 15,25% etf_16 0,00% 0,00% 0,00% 0,00% 0,00% 2,01% -25,10% 13,00% etf_17 0,00% 0,00% 0,00% 0,00% 0,00% 2,01% -25,10% 13,00% Bench. _12 cef_27 etf_18 11,44% etf_19 11,44%
If<0% volume decreased; If>0% volume increased; If=0% volume stable; CEF average trading volume was recomputed one time for each new ETF fund following the same benchmark that entered the market. The new CEF volume computed comprises observations between ETF fund inception and the last day of observations of the sample (07/11/2013). After, it was computed the variation in percentage, of CEF trading volume using all observations and CEF trading volume after each ETF inception.
Table 11 purpose is to summarize the results from table 10, which means that after the average trading volume is recomputed and after all the variations are accounted is necessary to identify what is the main trend of CEF average trading volume after the inception of a similar ETF. There were three possible outcomes: the average volume could remain stable either because ETF
26 inception was prior to that CEF or because after the ETF inception there was no difference. The remaining possible outcomes were that CEF average trading volume could increase or decrease after the inception of a similar ETF.
Table 11 Summary of volume variation
Volume variation/
Benchmark code 1 2 3 4 5 6 7 8 9 10 11 12 Total % Increased 1 0 1 2 2 2 2 1 1 4 12 2 30 54,55 % Decreased 0 1 0 1 0 0 0 0 0 0 5 0 7 12,73 % Stable 1 0 1 0 0 0 0 0 1 0 15 0 18 32,73 % Total observations 2 1 2 3 2 2 2 1 2 4 32 2 55 100,00%
Note: In the first row benchmarks are identified by code. Second, third and fourth row accounted for the number of times the volume changed in each direction in each benchmark. The number of observations depends on the number of CEF and ETF funds included in each benchmark, benchmark 11 that include 4 ETFs and 8 CEFs has a higher number of observation because the average volume for each ETF inception was recomputed one time for each one of the different CEFs present in the sample. The last column summarizes in percentage the variation of the trading volume.
CEFs average trading volume increase 55% of times after the inception of a similar ETF and remain stable in 33% of times. According to the Literature Review when a new ETF fund is launched the interest in the similar CEF decreases, which means that investors want to trade all their CEF shares for ETF shares as soon as possible.
This phenomena is going to lead to more sell order for CEFs than usual because investors want to trade them out, eventually that leads to an increase of CEF trading volume. So, the results achieved in table 11 go along with the literature.
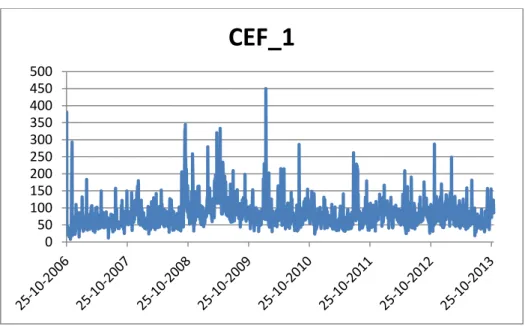
In order to give a visual idea of CEF trading volume before and after the inception of an ETF is possible to find graphs computed for each one of the 27 CEFs and for the CEF trading volume after the inception of each one of the new ETFs in the appendix in figures 1 to 59. For ETF launched before the inception of some CEF a graph was not computed.
27
7 Conclusion
In this thesis I have put myself in the role of the common investor that faces several investment opportunities in the market. Every investor despite their wealth wants to be sure that they invest their money in the best possible way, which means making the best asset allocation decision possible.
Asset allocation is one the most important decisions in modern finance it is the process of choosing which asset class will give the investor the desired return according to the risk he is committed to bear.
Each asset class offers several products as well as the mutual fund industry. It is necessary to choose which product to invest on.
In the mutual fund market the choice eventually comes between Exchange Traded-Funds (ETFs) and Closed-End-Funds (CEFs). CEFs are a mature security on the market, they are traded since 1950s by the other hand ETFs are a younger security, on the market since 1991, which makes interesting to study if the “new” security is able to achieve a superior performance.
So, to make a comparison between these two mutual funds, U.S. market fund is for sure the best to use: the more developed market in the world, huge variety and quantity of funds and there is available data to access.
In order to start the analysis between ETFs and CEFs it was defined a sample based on criteria such as funds having at least five years of observations and the majority of CEFs and ETFs should share a common benchmark between them, which means that each benchmark included in the sample must have both ETFs and CEFs in the sample tracking them. After starting with 1.117 from Lipper these criteria reduce the sample to 46 funds: 19 ETFs and 27 CEFs.
The analysis focused on a performance evaluation, but also in a liquidity analysis to understand what is the evolution of CEF volume after a similar ETF (tracking the same benchmark) is launched and in a mispricing study of both funds, to understand whether or not they are correctly priced or not.
In order to be able to make all the studies mentioned previously the data extracted focused on price, volume, market value and NAV from funds and price index from the benchmarks.
After, it was possible to use all extracted data to compute the necessary ratios and measures to analyze the sample. For the performance evolution were used five ratios: Treynor, Sharpe,
28 Sortino, Hit and Appraisal Ratio, those ratios were applied to all funds included into the sample and the result was clear: ETFs performed better than CEFs.
It is important to mention that ETFs performed better in two ways: the first all the ratios were applied using all observations available for each fund, the second all the ratios were applied using only the common period of fund observations with the same benchmark.
Despite CEF funds are actively managed and ETFs do not, CEF funds only manage to perform better than ETF in Appraisal Ratio, that measures a fund manager picking ability, about 50% of times, which means that CEF fund managers can not add as much extra return as expected in the majority of cases.
In the liquidity analysis the results show that CEF average trading volume tends to increase after the inception of a similar ETF (tracks the same benchmark). In order to get to this conclusion was necessary to compute for all observations the average CEF trading volume and the average volume only after the introduction of a similar ETF (using fewer observations), after, it was computed the variation respectively to the initial volume. So, in 55% of cases CEF volume increased after the introduction of an ETF, this conclusion goes along with the literature because many authors conclude that when a new ETF is launched investors want to sell as soon as possible their CEF shares, which eventually leads to an increase in CEF volume.
Finally, in the mispricing analysis is possible to conclude that despite the majority of funds show in average mispricing, CEF funds trade at discount while ETF funds trade at premium. This conclusion matches the literature because as several authors conclude CEF funds trade at discount some time after inception and ETF tend to be more correctly priced because their arbitrage is easier than CEF arbitrage.
As a bottom line for the analysis, is recommend to mutual funds investors that they should prefer ETFs rather than CEFs, because ETFs perform better using risk-adjusted returns, they provide higher liquidity, lower costs, tax-advantage and their price tends to be more accurate relatively to their NAV which means that ETF price is not expected to fall into discount so fast as CEF does. At last, evidence shows that CEF fund manager ability to look for extra return does not have as much success as expected, because ETFs often perform better in Appraisal Ratio, so there is no point to choose CEF funds over ETF funds.
29
8 Bibliography
Avellaneda, M., & Zhang, S. 2010. Path-dependence of leveraged ETF returns. SIAM Journal on Financial Mathematics. http://epubs.siam.org/doi/abs/10.1137/090760805, February 14, 2014.
Bal, Y., & Leger, L. 1996. The performance of UK investment trusts. Service Industries Journal. http://www.tandfonline.com/doi/abs/10.1080/02642069600000007, February 19, 2014.
Barnhart, S., & Rosenstein, S. 2010. Exchange‐ Traded Fund Introductions and Closed‐ End
Fund Discounts and Volume. Financial Review.
http://onlinelibrary.wiley.com/doi/10.1111/j.1540-6288.2010.00281.x/full, February 14, 2014.
Guedj, I., & Huang, J. 2008. Are ETFs replacing index mutual funds. http://mypp.asb.unsw.edu.au/schools/bankingandfinance/Documents/I. Guedj - Are ETFs Replacing Index Mutual Funds.pdf, February 14, 2014.
Harper, J., Madura, J., & Schnusenberg, O. 2006. Performance comparison between exchange-traded funds and closed-end country funds. Journal of International Financial …. http://www.sciencedirect.com/science/article/pii/S104244310500034X, February 14, 2014. Hughen, J., & Mathew, P. 2009. The efficiency of international information flow: Evidence from
the ETF and CEF prices. International Review of Financial Analysis. http://www.sciencedirect.com/science/article/pii/S1057521909000027, February 14, 2014. Kato, K., Linn, S., & Schallheim, J. 1990. Are there arbitrage opportunities in the market for
American depository receipts? Journal of International Financial …. http://www.tandfonline.com/doi/abs/10.1300/j282v01n01_04, February 17, 2014.
Leonard, D., & Shull, D. 1996. Investor sentiment and the closed-end fund evidence: Impact of the January effect. The Quarterly Review of Economics and Finance. http://www.sciencedirect.com/science/article/pii/S1062976996900320, February 17, 2014. Manzler, D., & Slezak, S. 2008. The Closed-End Fund Premium Puzzle and Portfolio/Fund Risk
Differences. Fund Risk Differences (March 18, 2008).
http://papers.ssrn.com/sol3/papers.cfm?abstract_id=1108489, February 14, 2014.
Markowitz, H. 1952a. Portfolio selection*. The journal of finance. http://onlinelibrary.wiley.com/doi/10.1111/j.1540-6261.1952.tb01525.x/full, March 10, 2014.
Markowitz, H. 1952b. The utility of wealth. The Journal of Political Economy. http://www.jstor.org/stable/1825964, March 10, 2014.
30 Pennathur, A. 2002. Diversification Benefits of iShares and Closed‐ End Country Funds. Journal of Financial …. http://onlinelibrary.wiley.com/doi/10.1111/1475-6803.00036/full, February 14, 2014.
Yeyati, E., & Ubide, A. 1998. Crises, contagion, and the closed-end country fund puzzle. http://www.google.com/books?hl=en&lr=&id=uvloRsV26nsC&oi=fnd&pg=PA4&dq=levy-yeyati+ubide+1998&ots=WQYm-wY_to&sig=vKgFNE_Z1P8VVRJzl2y8Ra4xxng,
February 19, 2014.
Other bibliography used:
Notes by Ramos, S. (2013)
Terminals
Datastream Bloomberg
31
9 Attachments
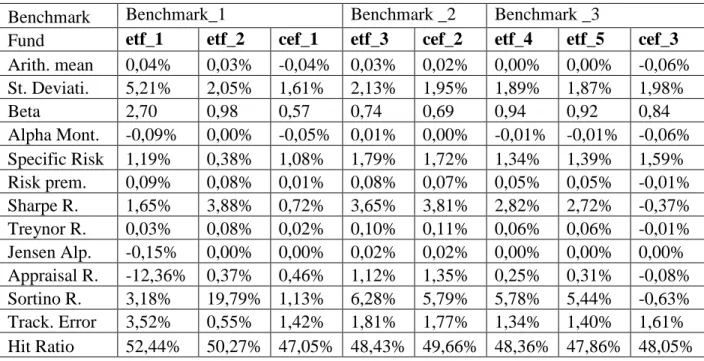
Table 12 – Performance analysis with entire sample Benchmarks 1, 2 and 3
Benchmark Benchmark_1 Benchmark _2 Benchmark _3
Fund etf_1 etf_2 cef_1 etf_3 cef_2 etf_4 etf_5 cef_3 Arith. mean 0,04% 0,03% -0,04% 0,03% 0,02% 0,00% 0,00% -0,06% St. Deviati. 5,21% 2,05% 1,61% 2,13% 1,95% 1,89% 1,87% 1,98% Beta 2,70 0,98 0,57 0,74 0,69 0,94 0,92 0,84 Alpha Mont. -0,09% 0,00% -0,05% 0,01% 0,00% -0,01% -0,01% -0,06% Specific Risk 1,19% 0,38% 1,08% 1,79% 1,72% 1,34% 1,39% 1,59% Risk prem. 0,09% 0,08% 0,01% 0,08% 0,07% 0,05% 0,05% -0,01% Sharpe R. 1,65% 3,88% 0,72% 3,65% 3,81% 2,82% 2,72% -0,37% Treynor R. 0,03% 0,08% 0,02% 0,10% 0,11% 0,06% 0,06% -0,01% Jensen Alp. -0,15% 0,00% 0,00% 0,02% 0,02% 0,00% 0,00% 0,00% Appraisal R. -12,36% 0,37% 0,46% 1,12% 1,35% 0,25% 0,31% -0,08% Sortino R. 3,18% 19,79% 1,13% 6,28% 5,79% 5,78% 5,44% -0,63% Track. Error 3,52% 0,55% 1,42% 1,81% 1,77% 1,34% 1,40% 1,61% Hit Ratio 52,44% 50,27% 47,05% 48,43% 49,66% 48,36% 47,86% 48,05% Table 13 – Performance analysis with entire sample Benchmarks 4 and 5
Benchmark Benchmark _4 Benchmark _5
Fund etf_6 cef_4 cef_5 cef_6 etf_7 cef_7 cef_8 Arith. mean 0,01% -0,03% -0,02% -0,03% 0,01% 0,00% -0,04% Stand. Deviation 1,75% 2,19% 1,78% 1,79% 1,74% 2,20% 1,79% Beta 1,17 1,19 1,06 1,10 0,83 0,65 0,79 Alpha Monthly -0,01% -0,04% -0,04% -0,05% -0,01% -0,02% -0,06% Specific Risk 0,81% 1,54% 1,27% 1,25% 1,35% 2,02% 1,47% Risk premium 0,06% 0,02% 0,03% 0,02% 0,06% 0,05% 0,01% Sharpe Ratio 3,68% 1,12% 1,84% 1,34% 3,32% 2,09% 0,48% Treynor Ratio 0,05% 0,02% 0,03% 0,02% 0,07% 0,07% 0,01% Jensen Alpha -0,01% 0,00% 0,00% 0,00% 0,01% 0,02% 0,00% Appraisal Ratio -1,38% -0,30% -0,14% -0,19% 0,73% 0,79% 0,12% Sortino ratio 10,87% 2,20% 3,42% 2,52% 6,19% 2,97% 0,76% Tracking Error 0,86% 1,56% 1,27% 1,25% 1,37% 2,07% 1,49% Hit Ratio 48,54% 49,97% 50,21% 50,78% 47,60% 49,65% 48,83%
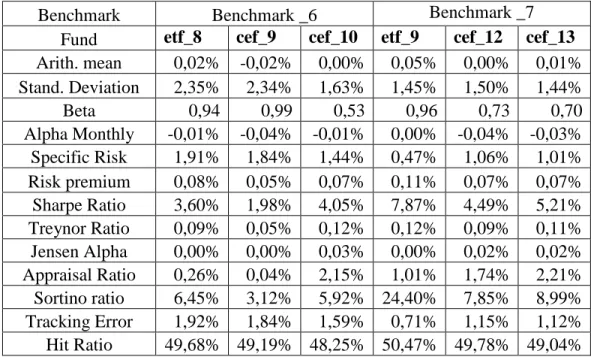
32 Table 14 – Performance analysis with entire sample Benchmarks 6 and 7
Benchmark Benchmark _6 Benchmark _7
Fund etf_8 cef_9 cef_10 etf_9 cef_12 cef_13 Arith. mean 0,02% 0,02% 0,01% 0,05% -0,01% 0,00% Stand. Deviation 2,35% 2,10% 1,48% 1,45% 1,51% 1,47% Beta 0,94 0,98 0,48 0,96 0,55 0,54 Alpha Monthly -0,01% -0,02% -0,01% 0,00% -0,02% -0,02% Specific Risk 1,91% 1,67% 1,34% 0,47% 1,16% 1,10% Risk premium 0,07% 0,07% 0,06% 0,10% 0,04% 0,05% Sharpe Ratio 3,10% 3,23% 4,24% 7,06% 2,93% 3,34% Treynor Ratio 0,08% 0,07% 0,13% 0,11% 0,08% 0,09% Jensen Alpha 0,00% 0,00% 0,03% 0,00% 0,02% 0,02% Appraisal Ratio 0,22% 0,09% 2,41% 0,91% 1,74% 2,04% Sortino ratio 5,56% 5,18% 5,86% 21,90% 4,28% 4,83% Tracking Error 1,92% 1,67% 1,49% 0,71% 1,42% 1,38% Hit Ratio 49,68% 49,35% 48,88% 50,47% 50,48% 49,77% Table 15 – Performance analysis with entire sample Benchmarks 8 and 9
Benchmark Benchmark _8 Benchmark _9 Fund etf_10 cef_14 etf_11 cef_15 cef_16 Arith. mean 0,04% -0,02% 0,02% -0,05% 0,00% Stand. Deviation 1,26% 1,60% 1,43% 2,33% 1,61% Beta 0,93 0,88 0,92 0,76 0,93 Alpha Monthly 0,00% -0,05% -0,01% -0,07% -0,04% Specific Risk 0,41% 1,12% 0,43% 1,96% 0,97% Risk premium 0,09% 0,03% 0,07% 0,00% 0,05% Sharpe Ratio 6,85% 1,68% 4,74% -0,18% 2,90% Treynor Ratio 0,09% 0,03% 0,07% -0,01% 0,05% Jensen Alpha 0,01% 0,00% 0,01% 0,00% 0,00% Appraisal Ratio 1,56% 0,30% 1,23% -0,05% 0,32% Sortino ratio 18,82% 3,10% 14,23% -0,29% 6,14% Tracking Error 0,66% 1,16% 0,67% 2,00% 1,00% Hit Ratio 48,49% 48,96% 50,96% 49,54% 50,28%