HEDGING FOREIGN CURRENCY AND INTEREST RATE RISKS
WITH DERIVATIVES:
HOW MUCH DOES IT INCREASE THE FIRM’S VALUE?
Florbela Galvão da Cunha
Tese submetida como requisito parcial para obtenção do grau de
Mestre em Finanças
Orientador(a):
Prof. Doutor José Dias Curto
Prof. Auxiliar, Departamento de Métodos Quantitativos
I dedicate this work to my father, who always gave me the strength to pursuit my goals and to always give my best in everything I do.
I would like to thank my supervisor Professor José Dias Curto, from ISCTE Business School, for being always available and supportive when I needed. I also wish to thank Professor Amrit Judge, from Middlesex University Business School, for his valuable comments and suggestions. His published works were an important source of inspiration for my thesis.
INDEX ABSTRACT 1. INTRODUCTION 1 2. METHODOLOGY 4 3. EMPIRICAL STUDY 9 4. CONCLUSIONS 29 REFERENCES 31
APPENDIX 1 – VARIABLE DEFINITIONS APPENDIX 2 – MODEL DEFINITIONS APPENDIX 3 – UNIVARIATE APPROACH
PANEL A – FULL SAMPLE PANEL B – IBERIAN SAMPLE PANEL C – ITALIAN SAMPLE
APPENDIX 4 – REGRESSION ANALYSIS – TOBIN’S Q3 PANEL A – FULL SAMPLE
PANEL B – IBERIAN SAMPLE PANEL C – ITALIAN SAMPLE
34 35 36 36 37 38 39 39 40 41
Hedging foreign currency and interest rate risks with Derivatives: How much does it increase the firm’s value?
ABSTRACT
Traditional finance theory suggests that a company can’t increase its value by changing the riskiness. However, recent studies show that it is possible to increase the firm’s value using hedging instruments. In my research I pretend to show that hedging with derivatives increases firm’s value, as already have been demonstrated in several different markets. The sample includes the 336 non-financial firms quoted in Lisbon, Madrid and Milan stock markets at the end of 2006.
This study presents empirical evidence on the valuation effects of Foreign Currency (FC) and Interest Rate (IR) hedging with derivatives, measured by Tobin’s Q. Depending on the Tobin’s Q definition, I found a 4.48%, 8.92% or 11.88% significant premium for derivative hedging firms. I also found that 91.1% hedging firms are derivative users. Sample was separate in Iberian Market (Lisbon and Madrid stock markets) and Italian (Milan stock market) subsamples. Statistical and regression methods evidence that to the Iberian firms hedging activity has more impact on firm’s value than to Italian ones. Results evidence important statistical significant premiums for foreign currency and interest rate derivative hedgers in Iberian Market, about 6.37% to 20.75%, whereas Italian Market displayed significant value only with interest rate derivative hedging firms.
Keywords: Firm’s value; Corporate hedging; Derivatives; Foreign currency hedging; Interest rate hedging.
1. INTRODUCTION
In the perfect Modigliani and Miller (MM) World (1958), risk management is a useless corporate financial function, by not giving to firm shareholders any tool or advantage besides the already available ones like holding well-diversified portfolios. In this framework, corporate hedging policy seems to be irrelevant.
Unfortunately we are not living in a perfect world. According to several recent theories, some elements like taxes, access to external financing and the international market exposure growth, have been exploiting the frictions between the MM world assumption and the real markets behavior. The positive theory of corporate hedging, developed by Smith and Stulz (1985), was based on the demonstration that imperfect capital markets justify corporate hedging because it can add value to firms.
The continuous transformations in the financial environment and in the worldwide capital markets induce to a higher financial risks exposure, mainly interest rates; foreign currency and commodity’s price, requiring therefore a more exigent risk management. Many previous studies have examined why firms might be hedging and its effect on firm’s value, most of them about UK and USA markets. Since commodity prices usually seem to be limited to specific industries, empirical researches have been focused on interest rate and foreign currency risks.
In this paper, I have extended this analysis to the Portuguese, to the Spanish and to the Italian markets, using the non-financial firms quoted in 2006.
Smith and Stulz (1985), in their positive theory of corporate hedging as above referred, argument that firms hedge for the following main reasons: taxes, costs of financial distress and managerial risk aversion. Their study demonstrated how corporate hedging can add firm’s value when they face convex costs such as progressive taxation and bankruptcy costs.
During the last two decades several studies were done regarding the hedging motivation, including its correlation with corporate aspects such as: growth opportunities for the firm, investment policy, capital structure and firm size.
Nevertheless, researches in direct impact of hedging on firm’s value only recently have begun. The first important paper was done by Allayannis and Weston (2001). This work examined the usage of foreign currency derivatives in a sample of 720 large US non-financial firms and was first posted in 1998.
In my study I will try to find evidence of firm’s increased value when they hedge Foreign Currency (FC) and/or Interest Rate (IR) risks with derivatives, focused on the 336 non-financial firms quoted in Lisbon, Madrid and Milan stock markets. As a proxy for the firm’s value, I used Tobin’s Q variable. This variable has been used by several authors, representing the dependent variable in a multivariate approach, as following described.
Belghitar et al. (2008) analyzed the top non-financial UK firms ranked by market value at the end of 1995 and their results provide evidence of a significant relationship with firm’s value, measured by Tobin’s Q. In their studies, they found a hedging premium of 14.7% resulting from FC derivative hedging. The corresponding result for IR derivative hedging was 18.6%. This study provided evidences that hedge interest rate risks with derivatives increase UK firm’s value more than hedging foreign currency risks.
Allayannis and Weston (2001) studied the impact on non-financial firm’s value regarding the usage of foreign currency derivatives (FCD’s). As a proxy for firm’s value they also used Tobin’s Q, computed as market value of assets divided by replacement cost of assets (mean equal to 1.18 and median equal to 0.95, smaller than the mean which indicates that the distribution of Tobin’s Q is skewed to the left). They found a positive relationship between firm’s value and the FCD’s usage. According to these authors, the benefit of using Tobin’s Q as a proxy for firm’s value is that it allows doing comparisons across firms in an easier way than comparisons based on other variables as stock returns or accounting measures where a risk adjustment or normalization is required. They found that, on average, non-financial firms that face currency risks and hedge these risks with derivatives have a 4.87% higher value than non-derivative hedgers. Allayannis and Weston also tested two additional Tobin’s Q definitions: (1) the market value of the firm to the book value of total assets; (2) the market value of equity to book value of total sales. The results obtained were independent from the method firm’s value was measured.
Kapitsinas (2008) analyzed the impact of derivatives usage on the firm’s value, using 81 Greek non-financial firms listed in the Athens stock market with exposure to financial risks, for the years 2004-2006. These firms have their annual report published according to the International Financial Reporting Standards (I.F.R.S), which makes the derivative usage information research into an easier work. He also used Tobin’s Q as a proxy for evaluating the firm’s value. In his empirical study he found that, on average, non-financial firms that use derivatives in general and/or foreign currency and interest rate derivatives in particular, have a positive and significant effect on firm’s value of 4.6%.
Mackay and Moeller (2007) modeled and estimated the value of corporate risk management using 34 oil refiners as a sample. They found that hedging concave revenues and leaving concave costs exposed, each represent between 2% and 3% of the firm’s value, using derivatives or other securities. They also use Tobin’s Q as a proxy for the firm’s value, computed as a market-to-book value ratio (mean equal to 1.26 and median equal to 1.22, also smaller than the mean which indicates that Tobin’s Q distribution is skewed to the left).
Sometimes, the question of hedging is not clear enough for all corporate stakeholders, institutional investors, shareholders and bondholders, and treasury managers. Nevertheless, there are some empirical evidences that institutional investors also agreed in hedging activity, but motivations can differ from the ones that managers choose (Salomon and Joseph, 2000). The key question for the shareholders is if firm’s value can be increased by hedging activity. There are some empirical studies, especially in US and UK markets, suggesting that hedging adds value to firms. In the US market IR hedging is more valuated, whereas in UK market FC hedging is more important.
Some of the previous studies had limited information about the hedging positions, justified by the fact that in most countries firms were only recently obliged to reveal to the public either the risks they face or actions they take to manage these risks. United States was the major exception; firms are required to disclose information about usage of financial instruments with off-balance sheet risk since the nineteen’s.
Due to this limitation, most of the studies used firm surveys to reach their conclusions. The major issue about these surveys is the response rate: mostly around 30% or 40%, depending on the country it has been done. Regarding this matter, in order to obtain a representative sample, it would be necessary to starting with a large number of firms.
Fortunately, the International Financial Reporting Standards (IFRS) have already been implemented in many worldwide countries, including the members of the Economic and Monetary Union (EMU) in Europe. As a consequence, firms in these countries have the obligation to disclose, in their annual reports, whether they use derivative contracts for hedging or for trading purposes, providing also information about all kind of risks they face and the actions they take to properly handle with them.
In my study I have already benefited from these firms obligations, since I used 2006 data information and the derivative report obligation was already implemented in the chosen countries: Portugal, Spain and Italy. Information was collected from annual reports and DataStream database. Considering the low surveys response rate and as only quoted firms have their annual reports published in the internet, I only included quoted firms (Lisbon,
Madrid and Milan stock markets). As already mentioned, I also used Tobin’s Q as a proxy for firm’s value.
Empirical studies were done separately for full sample (non-financial firms quoted in Lisbon, Madrid and Milan stock markets; 336 firms), Iberian market (non-financial firms quoted in Lisbon and Madrid stock markets; 159 firms) and Italian market (non-financial firms quoted in Milan stock market; 177 firms). I also found some evidences that in average hedging financial risks, foreign currency and interest rate, increase firm’s value. Moreover, Iberian market shows a stronger effect on firm’s value when hedging their FC (IR) financial risks. The Italian market evidence a weaker impact of hedging activity in firm’s value, where only derivative interest rate users display any statistically significant value.
The remainder of the work proceeds as follows. Section 2 discusses the samples construction and the definition of variables, Tobin’s Q and control variables. Section 3 presents the sample and sub-samples descriptions, the methodology and the analysis results, using Univariate and Multivariate approaches. Section 4 summarizes our concluding remarks.
2. METHODOLOGY
The objective of this work is to prove that derivative hedging firms included in my sample, the non-financial firms quoted in Lisbon, Madrid and Milan stock markets, displayed higher firm value than non-derivative hedgers, following the statistical analysis displayed in previous studies. I tried to find evidences that hedging the interest rate and foreign currency risks increase the firm’s value, by using the Tobin’s Q as a proxy for the firm’s value.
The main reasons why non-financial firms hedge their financial risks are largely studied, either in UK (Clark and Judge, 2006; Judge, 2006) or in USA markets (Nance et al., 1993; Graham and Rogers, 2002), but also in Portugal (Mota, 2002; Ferreira and Mota, 2005), Spain (González et al., 2007), Italy (Bodnar et al., 2000; Bodnar et al., 2008) or even including several countries all over the world (Bartram et al, 2006; Foo and Yu, 2005).
The reasons for hedging are mainly the same: costs of financial distress, foreign currency transactions level, operating cash flow volatility, underinvestment’s costs and convexity of taxes function. Even though, there are some specific differences between each country. For instance, UK firms are much more sensible to foreign currency hedging than USA. Belghitar et al. (2008) showed that 70.4% of their UK firms sample was classified as
foreign currency hedgers, while Allayannis and Ofek (2001) reported that only 44% of US firms used FC derivatives.
In this study, I started from the point where hedging reasons are already known. I only analyzed financial risks and the hedging firm definition means non-financial Foreign Currency (FC) and Interest Rate (IR) risks hedging firms.
To test the hypothesis that hedging with derivatives increases firm’s value, I separated the analyzes according to three samples/subsamples: (1) full sample, including non-financial firms quoted in Lisbon, Madrid and Milan stock markets; (2) Iberian sample, including financial firms quoted in Lisbon and Madrid stock markets; (3) Italian sample, including non-financial firms quoted in Milan stock markets.
In each sample/subsample, I analyzed 8 different combinations of hedging/non-hedging sample (Models), as following described: (1) Model 1 includes in hedging sample all interest rate and/or foreign currency hedgers; (2) Model 2 includes in hedging sample all derivative interest rate and/or foreign currency hedgers; (3) Models 3 and 4 include in hedging sample all derivative foreign currency hedgers; (4) Model 5 includes in hedging sample only derivative foreign currency hedgers; (5) Models 6 and 7 include in hedging sample all derivative interest rate hedgers; (6) Model 8 includes in hedging sample derivative interest rate only hedgers (as described in Appendix 2).
As in previous studies (Allayannis and Weston, 2001; Kapitsinas, 2008), I started by a univariate analysis setting the hypothesis that derivative IR (FC) hedgers determine higher firm’s values than non-derivative hedgers. To infer that hedging increases the value of the firm, we need to exclude the effect of other variables that could impact on firm’s value, measured by the Tobin’s Q. To reach these conclusions, as in some other studies (Mackay and Moeller, 2007; Belghitar et al., 2008), I used a multivariate statistical approach, based on several variables as following described.
Variables description:
Tobin’s Q, the proxy for the firm value, is the dependent variable defined as: (1) Tobin’s Q1, the sum of total assets and market value of equity minus the book value of equity, all divided by total assets (Jin and Jorion, 2006; Belghitar et al., 2008; Pramborg, 2004); (2) Tobin’s Q2, computed as the market value for the firm to the book value of total assets (Mackay and Moeller, 2007). I also used a third definition for Tobin’s Q (Q3), as market value of equity to book value of equity (Kapitsinas, 2008) and the results were similar to Tobin’s Q2 (Appendix 4 - Panels A, B and C).
For the three definition of Tobin’s Q (Q1, Q2 and Q3), the Models have been estimated in three samples/subsamples separately as above described (full sample, Iberian subsample and Italian subsample).
To infer that hedging increases firm’s value we have to exclude the effect of all other variables that could impact on firms’ value (Tobin’s Q). These control variables were used as independent variables in a multivariate approach. In common with several previous studies, I control for (1) Size, (2) Profitability, (3) Leverage, (4) Investment grow, (5) Access to Financial Markets, (6) Industrial Diversification and (7) Geographical Diversification as following explained:
1. Size:
There is no clear evidence about size influence on firm’s value. According to Peltzman (1977) analysis, size leads to a higher efficiency. Also, there are several previous studies consistent with the fact that firm’s size tends to lead to use more likely derivatives because of their economies of scale in hedging costs. Ross (1996) defended that economies of scale exist in hedging. His results were confirmed by Tufano (1996), Mian (1996) and Berkman and Bradbury (1996). Dolde (1993) concluded that large firms would use more derivatives because of their higher investment in personnel, training and software to set up an in-house risk management program.
Even though there are some evidences that small firms would better need from derivatives hedging financial risks than the biggest ones which have naturally offsetting positions in their vast operations that mitigate financial risks (Crabb, 2003). According to this author, the only definitive tool for financial risk management available to small business is the financial derivatives. However, some studies indicate that smaller businesses do not use derivatives as extensively as large ones. Some reasons are referred to explain this behavior, as hedging costs and treasurer academic qualification.
In my work, I decided to control the effect of Size in firm’s value using natural logarithm of total Assets as a proxy for it. Allayannis and Weston also used the natural log of Total Assets to control the effect of size and alternatively also used the log of total sales and the log of capital expenditures; the results were very similar.
2. Profitability:
It is expectable that firm’s profitability has a positive impact on firm’s value. So I expect to conclude that if hedgers are more profitable, as several previous studies had
evidenced, these firms would have higher Tobin’s Q. Profitability was used as a control variable in previous studies. I used Return on Capital Employed (ROCE), as Belghitar et al. (2008), defined as the pre-tax profit plus total interest charges as a portion of total capital employed plus borrowing repayable within 1 year less total intangibles, to analyze profitability variable. A positive sign for the estimated coefficient is expected.
3. Leverage:
The structure of capital tends to affect the firm’s value. To control for the effect of Leverage I used the Financial Leverage Ratio, calculated as the book value of total debt divided by the book value of total debt plus the market value of equity as Belghitar et al. (2008). Allayannis and Weston (2001) also used Leverage as a control variable, but defined it as the long-term debt divided by shareholders equity. Firms with high leverage tend to hedge more (Dolde, 1995), which must represent a higher Tobin’s Q. A positive sign for the relation is expected.
4. Investment Grow:
Because hedging firms are more likely to have larger investment opportunities (Allayannis and Weston, 2001; Belghitar et al., 2008), such control is important. Additionally, Myers (1977) and Smith and Watts (1992) have also argued that there are evidences that firm’s value also depends on the future investment opportunities. Regarding this reference, I also decided to include this variable. Similar to Yermack (1996), Servaes (1996) and Allayannis and Weston (2001), I used the ratio of capital expenditure to sales as a proxy for investment opportunities. Some previous studies had also used R&D expenditures as a proxy for investment opportunity. As I couldn’t find consistent data for R&D, I assume zero for its value. A positive relation to the firm’s value is expected.
5. Access to Financial Markets:
If firms have limited access to financial markets, their Q ratios may be higher because they undertake only positive net present value (NPV) projects. To proxy for the ability to access to financial markets, I chose the dividend yield as Belghitar et al. (2008). Some studies used a dividend dummy (Allayannis and Weston, 2001). I would prefer to use dividend yield, since with this ratio I can get a representative value of the relationship between dividend and share price for each company. I therefore expect a negative coefficient. Both, dividend yield or dummy dividend, are referred in previous studies with negative relation expectation.
6. Industrial Diversification:
Several theoretical arguments suggest that diversification increases value (Williamson, 1970; Lewellen, 1971), while other arguments suggest that diversification is negatively related to the firm’s value, due to the agency problems between managers and shareholders (Jensen, 1986). Even though, there are substantial empirical evidences suggesting that industrial diversification is negatively related to firm’s value (Berger and Ofek, 1995; Lang and Stulz, 1994; Servaes, 1996; Allayannis and Weston, 2001).
To control for the industrial diversification, I used a dummy variable that equals 1 if the firm operates in more than one segment and 0 otherwise. In full sample, 59.52% of the firms are diversified across industries. Allayannis and Weston (2001) found in their sample a 63% of the firms that diversified industrial segments. A negative relation is expected.
7. Geographic diversification:
Several previous studies suggest that operating in several countries increases firm’s value (Morck and Yeung, 1991; Bodnar et al., 2000). Considering foreign sales as operations abroad, I choose the foreign sales to total sales ratio as a proxy for geographic diversification. In my study, abroad doesn’t mean necessarily using a currency different from euro, since I could not find this information properly separated for all sample firms, even in Datastream Database or in the annual reports. Some of these foreign sales refer to an EMU country. This ratio was also used in several previous studies (Allayannis and Weston, 2001; Belghitar et al., 2008). A positive relation is expected.
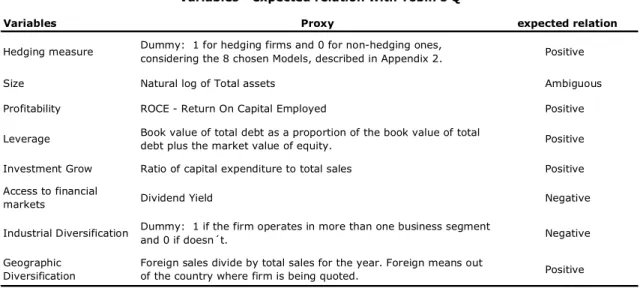
Table 1 presents the independent variables and the expected signs for the relationship between them and the firm’s value.
3. EMPIRICAL STUDY
A. Sample Description and source of data
The sample includes all 336 non-financial firms quoted in Lisbon, Madrid and Milan stock markets, in 2006. I only chose non-financial firms because the financial ones are usually both users and intermediaries in derivative transactions. Due to the fact that they often act as market makers, their motives and behavior are normally very different from those of non-financial firms and could bias results from empirical analysis.
Since the International Financial Reporting Standards (I.F.R.S.) impose firms to report the information of hedging activities and the derivative usage in their annual reports, it is easier to get qualified and standard hedging activity information. All firms in the three analyzed countries, Portugal, Spain and Italy were obliged to reflect IFRS rules in their annual reports. All data included in my tests was collected from 2006 annual reports and Datastream database.
Firstly, I started to analyzing the Iberian market (non-financial firms quoted in Lisbon and Madrid stock markets), due to their proximity and because there are several firms working in both markets. As the sample dimension wasn’t big enough to perform statistical
Variables Proxy
Hedging measure Dummy: 1 for hedging firms and 0 for non-hedging ones,
considering the 8 chosen Models, described in Appendix 2. Positive
Size Natural log of Total assets Ambiguous
Profitability ROCE - Return On Capital Employed Positive Leverage Book value of total debt as a proportion of the book value of total
debt plus the market value of equity. Positive Investment Grow Ratio of capital expenditure to total sales Positive Access to financial
markets Dividend Yield Negative
Industrial Diversification Dummy: 1 if the firm operates in more than one business segment
and 0 if doesn´t. Negative
Geographic Diversification
Foreign sales divide by total sales for the year. Foreign means out
of the country where firm is being quoted. Positive Variables - expected relation with Tobin's Q
Table 1
Table 1 resumes the expected relationship between dependent variable, Tobin's Q, and all variables used as independent ones in a Multivariante approach. The definition of variables are presented in Appendix 1.
tests and inference, I decided to include another European country that I thought could be the most similar one in terms of hedging firm’s behavior, and the choice was Italy.
This study classifies as IR (FC) hedgers firms those that clearly refer this matter in their 2006 annual report. I found, in general, that non-financial firms use derivatives to reduce the financial risk exposure, rather than to speculate.
Table 2 presents data about the number of FC (IR) hedgers amongst the sample of 336 firms. 73.8% of these firms hedge and 91.1% of hedgers are derivative users (Panel A). About 61.9% of derivative users are classified as both foreign currency and interest rate hedgers (Panel B). While 15.5% of them only hedge foreign currency exposure, 22.6% hedge exclusively interest rate exposure (Panel C).
Panel D shows that 52.1% of the firms in my sample are classified as derivative foreign currency hedgers, whereas 56.8% uses interest rate derivatives. Regarding the full sample data, I found that IR hedging is more important than FC hedging; 56.8% of firms are IR derivative hedgers, while only 52.1% hedge their foreign currency risks. This difference in favor of IR hedging is verified in the three analyzed markets. Even though, in Spain the difference is less significant. I also provide information from UK market and in this case FC hedging is much more important than IR hedging. Belghitar et al. (2007) report that 70.4% of UK firms are classified as FC derivative hedgers, while only 44.4% hedge their IR risks with derivatives.
Table 3 summarizes statistical information about variables used in econometric analysis. I compute Tobin’s Q for 336 firms (the number of observations). In this study I included three different Tobin’s Q definitions used as a proxy for firm value (Q1, Q2 and Q3). The Q Median displays the following values: Q1(1.40), Q2(0.74) and Q3(2.20) which are smaller than their Means Q1(1.64), Q2(1.00) and Q3(2.91), indicating that the distribution of Tobin’s
Full Sample Nr % Nr % Portugal 40 28 70.0% 25 89.3% Spain 119 91 76.5% 77 84.6% Italy 177 129 72.9% 124 96.1% Total 336 248 73.8% 226 91.1% Derivative FC(IR) Hedgers FC + IR hedgers Nr % Nr % Nr % Portugal 25 19 76.0% 23 92.0% 17 68.0% Spain 77 63 81.8% 64 83.1% 50 64.9% Italy 124 93 75.0% 104 83.9% 73 58.9% Total 226 175 77.4% 191 84.5% 140 61.9% Derivative FC(IR) Hedgers Nr % Nr % Portugal 25 2 8.0% 6 24.0% Spain 77 13 16.9% 14 18.2% Italy 124 20 16.1% 31 25.0% Total 226 35 15.5% 51 22.6%
Full Sample FC + IR hedgers
Nr % Nr % Nr % Portugal 40 19 47.5% 23 57.5% 17 42.5% Spain 119 63 52.9% 64 53.8% 50 42.0% Italy 177 93 52.5% 104 58.8% 73 41.2% Total 336 175 52.1% 191 56.8% 140 41.7% Full Sample Nr % Nr % Portugal 40 2 5.0% 6 15.0% Spain 119 13 10.9% 14 11.8% Italy 177 20 11.3% 31 17.5% Total 336 35 10.4% 51 15.2%
Table 2 presents data on the number of Foreign Currency (FC) and Interest Rate (IR) hedgers amongst the sample of 336 non-financial firms quoted in Lisbon, Madrid and Milan stock exchange, in 2006. A firm is defined as a FC (IR) hedger if it provides a qualitative disclosure of any FC(IR) hedging activity on its Annual Report. Panel A provides data on the number of FC (IR) hedging and the FC(IR) derivatives hedging. A firm is defined as a derivatives hedger if this information is clearly referred on its Annual Report. Panel B presents information about FC, IR and FC + IR derivatives hedging firms, amongst the 226 non-financial Derivative Hedgers, while Panel C displays information about FC and IR only hedgers. Panels D and E presents the same information as Panels B and C, but amongst the 336 non-financial firms.
FC hedgers
FC Only hedgers IR only hedgers IR hedgers
Panel E: Derivative FC or IR only hedgers, amongst full sample Table 2
Foreign Currency (FC) and Interest Rate (IR) Hedging
Derivatives FC (IR) hedgers FC(IR) hedgers
FC hedgers IR hedgers
Panel A: FC (IR) hedgers
Panel B: Derivative FC (IR) hedgers, amongst derivative hedgers
Panel D: Derivative FC (IR) hedgers, amongst full sample
Panel C: Derivative FC or IR only hedgers, amongst derivative hedgers
Q is skewed to the left. This conclusion is consistent with the findings in other previous studies, as Belghitar et al. (2005) and Allayannis and Weston (2001).
Like other empirical studies, I used the natural log of Tobin’s Q as dependent variable in the linear regression models. With natural log we can interpret the changes in Tobin’s Q value as an approximate percentage change in the firm’s value, which make it easier to understand.
As stated before, with this work I intend to verify if hedging with derivatives increases firm’s value and which kind of hedging risk, interest rate or foreign currency, has higher impact on it. Regarding this matter, each hedging risk was isolated as much as possible, employing several sample variations (Models) as following described:
Model 1: all FC and/or IR hedging firms are defined as hedgers. Non-hedging sample includes all non hedgers;
Variables N Mean Median Std.Dev Min Max
Tobin's Q1 336 1.64 1.40 1.08 0.476 13.01
Tobin's Q2 336 1.00 0.74 1.13 0.02 12.27
Tobin's Q3 332 2.91 2.20 3.26 0.00 46.35
Market Value of Equity (millions) 336 5,383 464 24,773 0.42 357,530
Book Value of Equity (millions) 336 10,509 193 156,683 -127 2,869,882
Total Assets (millions) 336 39,277 573 605,022 16.76 11,087,180
Return on Capital Employed - ROCE (%) 330 7.19 6.71 17.31 -108.10 184.38
Leverage (%) 336 30.49 28.61 21.35 0.00 99.52
Investment Grow (%) 332 12.95 5.09 41.76 0.00 667.50
Dividend Yield (%) 327 1.43 0.98 1.68 0.00 8.69
Industry Diversification (dummy) 336 0.60 1.00 0.5 0.00 1.00
Geographic Diversification- Foreign sales
ratio (%) 326 33.29 28.47 29.77 0.00 99.39
Table 3
Variables - Summary Statistics
Table 3 summarizes statistical information about variables used in this study. Tobin's Q1 is computed as the sum of total assets and market value of equity minus the book value of equity, all divided by total assets. The second definition of Tobin's Q (Q2) is market value of the firm divided by the book value of total assets. The third one, Tobin's Q3 , is market value of equity to book value of equity. Market Value of Equity is defined as the share price multiplied by the number of shares in issue (ordinary and preferences) and Book Value of Equity is defined as equity capital plus reserves, both used to calculate Tobin's Q variable, as well as total assets. Total Assets refers to book value of total assets. Return on Capital Employed (ROCE) is calculated as Pre-tax profit plus total interest charges divided by total capital employed plus borrowing repayable within 1 year less total intangibles.
Leverage is measured as book value of total debt as a proportion of the book value of total debt plus the market value of equity. Investment Grow is calculated as a ratio of Capex (Capital Expenditure) to total sales. Dividend Yield is the gross dividend
divided by share price. Industry Diversification dummy takes on the value of 1 if the firm operates in more than one business segment. Geographic Diversification is the foreign sales divided by total sales. We consider foreign exportation even if it is refers to an European Economic and Monetary Union (EMU) country.
Model 2: all FC and/or IR derivative hedgers are included in hedging sample. Non-hedging sample includes non-derivative hedgers;
Models 3 to 5: all FC derivative hedgers were included in the hedging sample, with some differences between them. Models 3 and 4 include all FC derivative hedgers in hedging sample, even if they hedge IR risks, and model 5 only includes FC derivative hedgers.
Models 6 to 8: all IR derivative hedgers were included in the hedging sample, with some differences between them. Models 6 and 7 include all IR derivative hedgers in hedging sample, even if they hedge FC risks, and model 8 only includes IR derivative hedgers (see definition in Appendix 2).
When I define FC (IR) hedging as the use of FC (IR) derivatives, then firms that hedge FC (IR) using non-derivatives methods will be effectively defined as non-hedgers, except in Models 4 and 7; in Model 4 foreign currency derivative hedgers are out of the hedging sample and in Model 7 interest rate derivative hedgers are also out of the non-hedging sample.
Hedging condition is a dummy variable with value 1 for the firms that hedge and 0 for non-hedgers.
As mentioned before, I used several control variables to better infer if hedging activity increases the firm’s value. Table 4, Panels A and B, presents the Pearson correlation coefficients for the variables used in empirical analysis. Panel A defines Tobin’s Q (Q1) as the sum of total assets and market value of equity minus the book value of equity, all divided by total assets and in Panel B I included the second definition of Tobin’s Q (Q2), as the market value for the firm to the book value of total assets.
Consistent with a priori expectations, the matrix shows that, in Panel A, Profitability (ROCE), Investment Grows (IG) and Geographical Diversification (GD) are positively correlated with Tobin’s Q and Dividend Yield (DY) and Industrial Diversification (ID) are negatively correlated. Although Leverage (LEV) is negatively correlated, against our expectation, and firm size (LOGTOTA) has also a negative correlation. However, in this case, the correlation is not statistically significant. In Panel B, I achieved the same results except with Dividend Yield (DY) that is positive correlated with Tobin’s Q2, contrary to a priori expected results.
In spite of the agreement between expected and observed sign for the correlations, some of them are not statistically significant. For example, the correlation between LOGQ1 and IG, ID, GD and DY is not statistically different from zero, at a 5% significance level. Thus, even confirming the expected sign correlation, results are not statistically significant. I found
the same results for correlation between LOGQ2 and IG, ID and GD; the observed sign correlations were similar to the expectation but without statistical significance.
Panel A: Correlation between control variables and Tobin's Q1
Correlation t-Statistic
Significance LOGQ1 LOGTOTA LEV IG ID GD DY ROCE
LOGQ1 1.0000 --- --- LOGTOTA -0.093107 1.0000 -1.638492 --- 0.1023 --- LEV -0.581183 0.192409 1.0000 -12.51349 3.435465 --- 0.0000 0.0007 --- IG 0.104224 0.036416 0.100900 1.0000 1.836149 0.638480 1.776984 --- 0.0673 0.5236 0.0766 --- ID -0.028092 0.212115 0.090192 -0.041416 1.0000 -0.492408 3.803102 1.586753 -0.726295 --- 0.6228 0.0002 0.1136 0.4682 --- GD 0.010394 0.118873 -0.001259 -0.065742 0.042254 1.0000 0.182125 2.097703 -0.022057 -1.154398 0.741015 1.0000 0.8556 0.0367 0.9824 0.2492 0.4593 --- DY -0.045759 0.319429 0.001379 -0.003217 -0.030345 -0.025562 1.0000 -0.802598 5.906275 0.024161 -0.056367 -0.531938 -0.448033 --- 0.4228 0.0000 0.9807 0.9551 0.5952 0.6544 --- ROCE 0.206756 0.142887 -0.207743 -0.332975 0.050667 0.027059 0.144982 1.0000 3.702662 2.529531 -3.721128 -6.187274 0.888894 0.474294 2.567418 --- 0.0003 0.0119 0.0002 0.0000 0.3748 0.6356 0.0107 --- Table 4 Pearson correlation
Table 4, Panels A and B, report Pearson Corrrelation coefficients for variables used in the tests. LogQ1 is the natural log of sum of total assets and market value of equity minus the book value of equity, all divided by total assets. LogQ2 is the natural log of the market value for the firm to the book value of total assets. Log TotA is a natural log of total assets and represents the firm size. ROCE, is a proxy for profitability. LEV is the Leverage. IG is the Investment Grow. DY is Dividend Yield, the proxy for access to the financial markets. ID is a dummy variable and represents the Industrial Diversification. GD is the Geographic Diversification, calculated as a foreign ratio. The definition of the variables are presented in Appendix 1. The estimations were conducted by using the Eviews econometric software, edition 6.0.
Panel B: Correlation between control variables and Tobin's Q2
Correlation t-Statistic
Significance LOGQ2 LOGTOTA LEV IG ID DY GD ROCE
LOGQ2 1.0000 --- --- LOGTOTA -0.136208 1.0000 -2.409011 --- 0.0166 --- LEV -0.798153 0.192409 1.0000 -23.21301 3.435465 --- 0.0000 0.0007 --- IG 0.041337 0.036416 0.100900 1.0000 0.724903 0.638480 1.776984 --- 0.4691 0.5236 0.0766 --- ID -0.053550 0.212115 0.090192 -0.041416 1.0000 -0.939616 3.803102 1.586753 -0.726295 --- 0.3482 0.0002 0.1136 0.4682 --- GD 0.026048 0.118873 -0.001259 -0.065742 0.042254 -0.025562 1.0000 0.456544 2.097703 -0.022057 -1,154,398 0.741015 -0.448033 --- 0.6483 0.0367 0.9824 0.2492 0.4593 0.6544 --- DY 0.005330 0.319429 0.001379 -0.003217 -0.030345 1.0000 0.093394 5.906275 0.024161 -0.056367 -0.531938 --- 0.9257 0.0000 0.9807 0.9551 0.5952 --- ROCE 0.167311 0.142887 -0.207743 -0.332975 0.050667 0.144982 0.027059 1.0000 2.973434 2.529531 -3.721128 -6.187274 0.888894 2.567418 0.474294 --- 0.0032 0.0119 0.0002 0.0000 0.3748 0.0107 0.6356 ---
B. Firm’s Value and Foreign Currency (FC) and Interest Rate (IR) hedging: a Tobin’s Q Analysis
Univariate tests:
The most frequent hypothesis the hedging literature deals with is that derivative hedging firms are rewarded by investors with higher valuation compared to non-users and thus a significant difference between hedgers and non-hedgers in terms of firm’s value should emerge, as a premium that could be attributed to derivatives usage. In order to empirically check this hypothesis, I performed equality tests for means and medians of the firm’s value, given by Tobin’s Q (Q1, Q2 and Q3), as well as a comparison of all control variables, defined in Appendix 1, between hedgers and non-hedgers.
The tests were performed separately for full sample and subsamples, Iberian an Italian ones. Moreover, on each sample and subsample, I tested separately derivative hedgers (Model 2), FC derivative hedgers (Model 3) and IR derivative hedgers (Models 6), as shown in Appendix 3 (Panels A, B and C).
Panel A presents the results of the t-test for the equality of means and the Wilcoxon test for the equality of medians between: (i) derivative hedgers and non-hedgers; (ii) FC derivative users and non-FC derivative users; (iii) IR derivative users and non-IR derivative users, to the full sample. Panels B and C present the same tests for Iberian and Italian subsamples, respectively. Referring to each Model, I included four columns. First column displays mean, median, standard deviation and the number of observations (firms) for hedgers. The second one gives the same data for non-hedgers. Column 3 displays differences between hedgers and non-hedgers means and medians. The fourth one refers to the p-values resulting from the tests.
In the full sample (Panel A), the test reveals that the differences in the mean’s value of Tobin’s Q1 is positive, except for IR derivative hedgers, and statistically insignificant in all the comparisons, whereas with Tobin’s Q2 the differences are all negative except for FC derivative hedgers, but also statistically insignificant at a 5% significance level. With Tobin’s Q3, the means difference is positive, except in Model 6 and there is also no statistical significance. The means difference in control variables Dividend Yield (DY) and Geographic Diversification (GD) is always positive and statistically significant at 1%, as well as the natural log of Total Assets.
In the Iberian sample, Panel B, the test reveals similar results for the means difference of Tobin’s Q (Q1, Q2 and Q3) in comparison to the full sample, Panel A. All results are also
statistically insignificant at a 5% significance level. As in Panel A, the means difference in control variables Dividend Yield (DY), Geographic Diversification (GD) and natural log of Total Assets (Log TotA) are always positive and statistically significant.
In Italian sample, Panel C, the test reveals that the differences in the mean value of Tobin’s Q (Q1, Q2 and Q3) are all positive. However none of them are statistically significant, as in full sample and Iberian subsample. The means difference in control variables Total Assets (TotA), Leverage (LEV) and Geographic Diversification (GD) are always positive and statistically significant at 1%, as well as natural log of Total Assets (Log TotA).
The results don’t support properly the hypothesis that derivative hedging usage increases the firm’s value, comparing with non-derivative hedgers. On that account a multivariate approach is required in order to isolate other factors that usually affect firm’s value, as I analyze next.
Multivariate analysis:
As explained before, I examined in a univariate setting the hypothesis that, on average, derivative IR (FC) hedgers determine higher firm’s values than non-derivative hedgers. However, to document properly a relationship between the use of derivatives and firm’s value we need to control for variables that could impact on firm’s value, as described earlier. Regarding this matter, I also tested my hypothesis in a multivariate setting, including the following variables: (1) Size, by using the log of total assets (TotA) as a proxy; (2) Profitability, using Return On Capital Employed (ROCE) as a proxy; (3) Leverage (LEV), using book value of total debt as a proportion of the book value of total debt plus the market value of equity as a proxy; (4) Investment grow (IG), using ratio of capital expenditure to total sales as a proxy; (5) Access to financial markets, using the Dividend Yield (YD) as a proxy; (6) Industrial Diversification (ID) dummy, taking value one if the firm operates in more than one business segment as a proxy and 0 otherwise; (7) Geographical Diversification (GD), using the ratio of foreign sales to total sales as a proxy.
The analysis was based on the linear regression model of Allayannis and Weston (2001) formulated as:
1 2 3 4
5 6 7 8
' i i log i i i
i i i i i
LogTobin sQ Hedging TotA ROCE LEV
IG DY ID GD
α β
β
β
β
β
β
β
β
ε
= + + + +
+ + + + + (1)
Tobin’s Q is the proxy for the firm’s value and the hedging dummy take different values depending on the sample hedging definition, Models 1 to 8 (Appendix 2). As the Tobin’s Q
natural log is considered, hedge dummy coefficient β is interpreted as a premium or a discount, measured in percentage, for firm’s value, depending on the positive or negative signal, respectively. The analysis was conducted by the three definitions for the dependent variable, Tobin’s Q (Q1, Q2 and Q3). There is a slice difference between first two definitions (Q1 and Q2), as following described:
Tobin’s Q1: Defined as the sum of total assets and market value of equity minus the book value of equity, all divided by total assets, represented as:
Q1 TotA MVE BVE TotA BVE MVE
TotA TotA TotA
+ − −
= = + (2) TotA: Book Value of total Assets
MVE: Market Value of Equity BVE: Book Value of Equity
Tobin’s Q2: Defined as Market Value of the firm divided by the book value of total assets, represented as:
2Q MVE TotA
= (3) MVE: Market Value of Equity
TotA: Book Value of total Assets
Comparing both definitions Q1 includes Q2 on its formulation. I formulated the differences between them as following described:
Q1 Q2 1 MVE BVE MVE 1 BVE
TotA TotA TotA
−
− = + − = − (4)
The difference between both formulas comes up from Book Value of Equity (BVE). In the first definition of Tobin’s Q (Q1), the results are more influenced by the relationship between Book and Market Value of Equity that can push the firm’s value down. With Tobin’s Q1, firm’s value is not only influenced by market perception but also by book registration.
The third definition of Tobin’s Q, Q3, only compares Market Value to Book Value of Equity, and the econometric results were too close to the ones resulting from the Tobin’s Q2 as described in the end of this Section.
Econometric Issues:
Heteroscedasticity is a quite common phenomenon in cross-section data and in order to check the error’s homokedasticity assumption, I performed the White test. When conclusion points to heteroskedasticity, the White correction for standard errors was performed using Eviews econometric software.
Furthermore, the existence of high correlation among independent variables is a commonly addressed problem in econometric studies, which may leads to inconsistent results. In order to detect any multicollinearity problems, I performed the collinearity diagnostic using SPSS. Regarding collinearity statistics, the Variance Inflation Factor (VIF) always output values <10, meaning a lower intensity correlation between variables. Collinearity diagnostic didn’t also display any variance proportion > 0.50 in more than one variable for each dimension. According to the collinearity diagnostic results, the correlation between control variables revealed not troublesome for the estimation results.
Due to the inconclusive results of the Durbin-Watson statistic, I also computed the LM Breusch-Godfrey test and the results point, as expected, for the absence of autocorrelation in the errors. Thus, I just corrected the standard errors by the White procedure.
Results:
The empirical results, according to the equation (1), are presented in Tables 5 to 7, Panels A and B, where the same regression is estimated twice, considering the Q1 and Q2 definitions of Tobin’s Q. In each Table, a different sample/subsample was used: (1) Table 5 reports full sample results, including firms from the three stock markets (Lisbon, Madrid and Milan stock markets); (2) Table 6 displays Iberian market (Lisbon and Madrid stock markets) and (3) Table 7 reports the outcome of regression for Milan stock market quoted firms. Under each column the 8 Models results are displayed according to the definitions in Appendix 2.
As observed in previous studies, a statistical significant positive increased value comes up when firms use derivatives on its hedging activities. According to the different Tobin’s Q definition, regression results give very different values for R-squared (R2) as following described: with Q1, the model displays results between 37% and 45%, whereas when using Q2 this value increases and ranges from 65% to 70%. Considering the different definition of Tobin’s Q1 and Q2, it seems that used variables better explain the firm’s value with Tobin’s Q2 as a dependent variable.
Regarding the statistical significance of a dummy hedging coefficient, when full sample is considered, almost all estimated coefficients are statistically significant, except for models
5 and 8, whether using Q1 or Q2 definitions, pointing evidence that hedging activity increased the firm’s value. Meanwhile, when I tried to isolate FC (IR) only hedgers (Models 5 and 8) results show non statistical significance in these Models. We could find some explanation in their tiny hedging sample. In 336 firms we only have 35 foreign currency and only 51 interest rate derivative hedgers.
Some differences appear when full sample is separated in two subsamples: Iberian and Italian markets. Using Q1 as a proxy for the firm’s value, in Iberian and Italian subsamples, we rarely find a hedging dummy estimated coefficient statistically significant, whereas with Q2 there are several statistical significant coefficients, as described next. Regarding control variables, I observe that variables Leverage (LEV) and Investment Grow (IG) denote in most of 8 Models a statistical significance at 1% level, using Q1 or Q2 definition, within full sample or Iberian and Italian subsamples.
Table 5, Panels A and B, displays a significant premium for hedging firms and derivative users, confirming that foreign currency and interest rate hedging activity is reward by market investors. This Table outcome the test results for full sample, including the three analyzed stock markets: Lisbon, Madrid and Milan.
The significant values, with Q1 and Q2 definitions, were all positive and statistical significant as expected, except in models 5 and 8.
The hedging dummy displays one discount coefficient in Panel A (Model 8) and another in Panel B (Model 5), but without statistical significance. Against my expectation, there is no evidence that derivative hedgers (Models 2 to 8) have higher firm’s value than hedgers, whether using derivatives or not (Model 1). Results are probably influenced by the fact that 91.1% of hedging firms are derivative users.
When using Tobin’s Q1, derivative hedgers (Model 2) are rewarded with a premium of 4.48%, at a 5% significant level, as well as FC derivative hedgers with statistical significant coefficients of 4.41% and 5.39% (Models 3 and 4). Interest rate derivative hedgers are also rewarded by investors with a statistical significant coefficients of 3.75% and 4.16% (Models 6 and 7), but only at a 10% significance level.
Hedging dummy coefficients are higher when using Tobin’s Q2, as following described: hedgers (Model 1) are rewarded with a 10.13% premium, at a 1% significance level, as well as derivative hedgers (Model 2) with a premium of 8.92%. Moreover, FC derivative hedgers are also rewarded by investors with statistical significant coefficients of 7.49% (Model 3) and 10.30% (Model 4), at 5% and 1% level respectively. Interest rate
derivative hedgers are also rewarded with 10.46% and 9.88% premiums, at a 1% significance level.
The estimated coefficients for several control variables output the expected signal, but only some of them are statistically significant. The natural log of total assets (TotA), a proxy for firm size, has a negative sign as in Lang and Stulz (1994), but without statistical significance. Contraire to expected results, on average, firms with higher leverage (LEV) have lower value and the corresponding estimated coefficients are statistically significant in all models (at 1% level), as it was found in Greek stock market analyzed by Kapitsinas (2008). The capital expenditure as a percentage of total sales (IG) is also statistically significant, at 1% level, and the average effect is positive as expected, in line with most previous research. Action in many business segments (Industrial Diversification - ID) and the ratio of foreign sales to total sales (Geographic Diversification - GD) have no statistical significance. The ID coefficients are positively related to the Q1 and Q2, against my expectations.
The GD effect appears negative or positive depending on the analyzed Model. I predicted a GD positive sign as several previous studies. However there are some theories suggesting that Geographic Diversification is an outgrowth of Agency problems, suggesting a negative relation with the firm’s value. We can find an explanation for GD inconstancy when full sample is divided: with respect to the Iberian market GD is mostly negatively correlated with firm’s value, whereas in Italian market it has a positive correlation (Tables 6 and 7). Dividend Yield (DY) level is almost always negatively related with firm’s value, as expected, supporting the ability of the firm to access to the financial markets. Though, its value is not statistically significant. Profitability (ROCE) and firm’s value have a positive relationship as theory predicts, except in Model 7, in Panel B, but also without statistical significance.
FC(IR) Hedgers
FC(IR) Deriv. Hedgers
Tobin's Q1 Model 1 Model 2 Model 3 Model 4 Model 5 Model 6 Model 7 Model 8
Hedging dummy 0.0565 ** (2.5105) Deriv. Hedging dummy 0.0448 ** (2.0594) FC hedging dummy 0.0441 ** 0.0539 ** 0.0045 (2.1484) (2.1771) (0.1409) IR hedging dummy 0.0375 * 0.0416 * -0.0016 (1.8897) (1.8695) (-0.0737) Log TotA -0.0069 -0.0065 -0.0080 -0.0084 -0.0001 -0.0059 -0.0054 -0.0002 (-0.5826) (-0.5380) (-0.6492) (-0.6507) (-0.0082) (-0.4720) (-0.4581) (-0.0176) LEV -0.0050 *** -0.0051 *** -0.0050 *** -0.0052 *** -0.0050 *** -0.0051 *** -0.0048 *** -0.0050 *** (-9.3222) (-9.3017) (-9.3153) (-8.3947) (-9.3000) (-9.2315) (-9.8155) (-9.2964) IG 0.0009 *** 0.0009 *** 0.0010 *** 0.0007 *** 0.0009 *** 0.0009 *** 0.0008 *** 0.0009 *** (-4.5388) (4.4796) (4.5866) (2.8453) (4.2543) (4.2473) (5.2584) (4.2208) ID dummy 0.0081 0.0091 0.0068 0.0072 0.0082 0.0073 0.0204 0.0079 (0.4485) (0.5024) (0.3712) (0.3555) (0.4485) 0.403517 (1.0875) (0.4304) GD 0.0000 -0.0001 -0.0001 -0.0002 0.0001 0.0000 0.0001 0.0001 (-0.1410) (-0.2224) (-0.4034) (-0.5526) (0.3699) (-0.0225) (0.1807) (0.3661) DY -0.0086 -0.0086 -0.0083 -0.0089 -0.0074 -0.0085 -0.0070 -0.0074 (-1.6242) (-1.5777) (-1.5449) (-1.5515) (-1.3828) (-1.5673) (-1.2192) (-1.3788) ROCE 0.0018 0.0018 0.0018 0.0021 0.0018 0.0019 0.0006 0.0018 (1.2506) (1.2181) (1.1944) (1.1950) (1.1797) (1.2236) (0.6453) (1.1769) C 0.3012 *** 0.3112 *** 0.3289 *** 0.3306 *** 0.2947 *** 0.3162 *** 0.2976 *** 0.2962 *** (4.6792) (4.7611) (4.881) (4.7496) (4.3946) (4.6923) (4.3748) (4.4681) Nr of observ. 309 309 309 263 309 309 276 309 Nr of Hedgers 230 210 164 164 33 177 177 46 R2 0.4078 0.4026 0.4027 0.4146 0.3920 0.4005 0.3735 0.3920 Adjusted R2 0.3920 0.3867 0.3868 0.3961 0.3758 0.3845 0.3547 0.3758 Table 5
Regression Analysis: non-financial firms quoted in Lisbon, Madrid and Milan Stock Market
Panel A: Dependent Variable - Tobin's Q1
Foreign Currency (FC) Hedging Interest Rate (IR) Hedging
Effects of Derivatives use on firm's value - regression results: Table 5 presents the results for regression on the use of derivatives on firm value. The dependent variable is the logarithm of Tobin's Q1, Panel A, and Tobin's Q2, Panel B, as a proxy for firm's value and is calculated as: (1) Q1, division of the sum of total assets and market value of equity minus the book value of equity, all divided by total assets; (2) Q2, Market Value of Equity divided by total assets. Under each column we analyzed a different definition of hedging sample, Models 1 to 8. The variable Hedging is always a dummy variable, equal to 1 when firm hedge according to the question of each Model (hedger, Model 1;derivative hedger, Model 2; FC derivative hedger,Models 3 to 5; IR derivative hedger, Models 6 to 8). TotA is the natural logarithm of total assets, a proxy for firm value. LEV stand for Leverage. IG stands for investment grows. ID dummy stands for diversification in industrial segments. GD stands for geographic diversification. DY stands for dividend yield, a proxy for the access to financial makets. ROCE stands for the return on capital employed, a proxy for profitability. And C stands for the constant. ***, ** and * denote significance at the 1%, 5% and 10%, respectively. t-statistics are based on White standard errors and appears between ( ). The definition of the variables and Models are presented in Appendix 1 and Appendix 2, respectively. The estimations were conducted by using the Eviews econometric software, edition 6.0.
To better recognize any differences between evolved countries, I separated full sample in two subsamples: Iberian Market and Italian markets, as above explained. Firms quoted in the Lisbon stock market were not separated from Iberian Market because of its quite small sample. I only got 40 non-financial firms quoted in Lisbon stock market.
Table 6, Panels A and B, refers to the Iberian market. Comparing Iberian market results (Table 6) to the Italian ones (Table 7), I found strong evidences that derivative hedging is much more valuated in Iberian market.
FC(IR) Hedgers
FC(IR) Deriv. Hedgers
Tobin's Q2 Model 1 Model 2 Model 3 Model 4 Model 5 Model 6 Model 7 Model 8
Hedging dummy 0.1013 *** (3.1003) Deriv. Hedging dummy 0.0892 *** (2.8738) FC hedging dummy 0.0749 ** 0.1030 *** -0.0573 (2.5283) (2.9240) (-1.2485) IR hedging dummy 0.1046 *** 0.0988 *** 0.0169 (3.6712) (3.1111) (0.4866) Log TotA -0.0130 -0.0136 -0.0143 -0.0279 -0.0017 -0.0170 -0.0080 -0.0004 (-0.4073) (-0.4215) (-0.4427) (-0.8107) (-0.0525) (-0.5234) (-0.2213) (-0.0122) LEV -0.0146 *** -0.0146 *** -0.0145 *** -0.0145 *** -0.0146 *** -0.0147 *** -0.0145 *** -0.0145 *** (-17.6112) (-17.7609) (-17.6452) (-16.1284) (-17.1985) (-17.7827) (-18.0555) (-17.3368) IG 0.0012 *** 0.0012 *** 0.0013 *** 0.0016 *** 0.0012 *** 0.0012 *** 0.0010 *** 0.0012 *** (4.7597) (4.6747) (5.0105) (3.7592) (4.5890) (4.4843) (4.4694) (4.7884) ID dummy 0.0171 0.0191 0.0148 0.0290 0.0145 0.0150 0.0290 0.0178 (0.6660) (0.7400) (0.5666) (1.0081) (0.5517) (0.5913) (1.0968) (0.6678) GD 0.0002 0.0001 0.0000 -0.0001 0.0005 0.0001 0.0002 0.0004 (0.3349) (0.1620) (0.0507) (-0.0989) (0.9882) (0.2170) (0.4771) (0.9249) DY -0.0017 -0.0018 -0.0010 0.0010 0.0004 -0.0024 -0.0039 0.0005 (-0.1626) (-0.1711) (-0.0983) (0.0946) (0.0432) (-0.2363) (-0.3359) (0.0477) ROCE 0.0010 0.0010 0.0009 0.0018 0.0011 0.0012 -0.0005 0.0010 (0.5637) (0.5358) (0.5004) (0.8210) (0.5469) (0.6093) (-0.4135) (0.5134) C 0.2527 0.2737 * 0.2993 * 0.3328 * 0.2541 0.3001 * 0.2468 0.2358 (1.5942) (1.7147) (1.8522) (1.9541) (1.5685) (1.8646) (1.3844) (1.4609) Nr of observ. 309 309 309 263 309 309 276 309 Nr of Hedgers 230 210 164 164 33 177 177 46 R2 0.6675 0.6655 0.6628 0.6662 0.6576 0.6711 0.6720 0.6557 Adjusted R2 0.6586 0.6566 0.6538 0.6557 0.6484 0.6623 0.6622 0.6465 Panel B: Dependent Variable - Tobin's Q2
Regression Analysis: non-financial firms quoted in Lisbon, Madrid and Milan Stock Market
Panel A (Table 6) shows Iberian market with Tobin’s Q1 and, contrary to the full sample, the empirical analysis displayed only one statistical significant hedging dummy coefficient, 6.37%, with foreign currency derivative hedging sample (Model 3), at a 10% significance level. Although, in Panel B, using Tobin’s Q2 definition, there are as many significant coefficients as in the full sample analysis. Moreover, all significant coefficients output a positive sign, evidencing that Iberian market valuate financial, FC and IR, risk hedgers. As in the full sample, the hedging dummy estimated coefficients with negative signal have no statistical significance.
When using Tobin’s Q2, hedging dummy coefficients are almost always statistically significant: derivative hedgers (Model 2) are rewarded with a premium of 11.14%, at 5% significance level. The FC derivative hedgers are also rewarded by investors with statistical significant coefficients of 13.67% (Model 4) and 13.77%, at a 1% level. Moreover, the IR derivative hedgers also display statistical significant premiums of 10.73% (Model 6), at a 1% level, and 10.82% (Models 7), at a 5% level. The hedging dummy coefficient displays a discount value in two situations (Models 5 and 8), but not statistically significant. Also according to my expectation, results evidence that derivative hedgers (Models 2) have higher firm’s value than hedgers, whether using derivatives or not (Model 1), with a 1.41% (11.14%-9.73%) higher hedging dummy coefficient.
Analyzing control variables that can also contribute to the firm’s value, the following results were found: Log of Total Assets (Log TotA) has a negative sign as in full sample, but statistically significant in three situations, Models 3 and 4 with Tobin’s Q1, at a 10% significance level, and in Model 4 with Tobin’s Q2, at a 5% significant level; as in full sample (Table 5) firms with higher Leverage (LEV) have lower value and the estimated coefficients are all statistically significant, at a 1% level; the capital expenditure as percentage of total sales (IG) is statistically significant and also positive, as previously expected, and statistically significant, at a 1% level; Industrial Diversification (ID) and Geographic Diversification (GD) have also no statistical significance but while ID is positively related to the Q1 and Q2, GD appears negatively related with firm’s value (except in Model 5, with Q2), against the expectations; Dividend Yield (DY) appears negatively related with firm’s value, according to the previous expectation, supporting the ability of firms to access the financial markets, but also without statistical significance as in full sample; ROCE is positively related to the firm’s value when using Q1 definition (except in Model 7), as theory predicted, but negatively or positively related to the Q2 depending on the Model, without statistical significance as in full sample.
FC(IR) Hedgers
FC(IR) Deriv. Hedgers
Tobin's Q1 Model 1 Model 2 Model 3 Model 4 Model 5 Model 6 Model 7 Model 8
Hedging dummy 0.0523 (1.4066) Deriv. Hedging dummy 0.0504 (1.5087) FC hedging dummy 0.0637 * 0.0614 0.0290 (1.8371) (1.5947) (0.4768) IR hedging dummy 0.0349 0.0403 -0.0205 (1.1948) (1.2536) (-0.6131) Log TotA -0.0231 -0.0255 -0.0287 * -0.0303 * -0.0187 -0.0219 -0.0222 -0.0181 (-1.4296) (-1.5412) (-1.6648) (-1.7427) (-1.1383) (-1.2857) (-1.2774) (-1.0662) LEV -0.0054 *** -0.0055 *** -0.0054 *** -0.0056 *** -0.0055 *** -0.0056 *** -0.0052 *** -0.0055 *** (-6.9768) (-7.1346) (-7.0989) (-6.6598) (-7.2649) (-7.1884) (-7.3410) (-7.2164) IG 0.0008 *** 0.0008 *** 0.0009 *** 0.0009 *** 0.0008 *** 0.0008 *** 0.0008 *** 0.0008 *** (3.5760) (3.5163) (3.3943) (3.2238) (3.5532) (3.5376) (3.3602) (3.4806) ID dummy 0.0274 0.0311 0.0227 0.0290 0.0313 0.0304 0.0435 0.0280 (0.8835) (1.0084) (0.7355) (0.8215) (1.0119) (0.9850) (1.4508) (0.8664) GD -0.0005 -0.0005 -0.0007 -0.0004 -0.0005 -0.0005 -0.0007 -0.0005 (-0.9987) (-1.1493) (-1.3495) (-0.7096) (-0.9572) (-1.0107) (-1.3779) (-0.9397) DY -0.0119 -0.0119 -0.0135 -0.0118 -0.0095 -0.0115 -0.0115 -0.0100 (-1.1052) (-1.0775) (-1.2076) (-1.0263) (-0.8934) (-1.0306) (-1.0141) (-0.9463) ROCE 0.0013 0.0012 0.0012 0.0015 0.0011 0.0013 -0.0003 0.0011 (0.6911) (0.6578) (0.6476) (0.7183) (0.5960) (0.6680) (-0.3394) (0.6050) C 0.4511 *** 0.4763 *** 0.5037 *** 0.5000 *** 0.4592 *** 0.4680 *** 0.4598 *** 0.4644 *** (4.4130) (4.7711) (4.8229) (4.7204) (4.4629) (4.6052) (4.3611) (4.3474) Nr of observ. 147 147 147 129 147 147 133 147 Nr of Hedgers 110 95 77 77 14 81 81 18 R2 0.4463 0.4470 0.4530 0.4569 0.4372 0.4417 0.4424 0.4366 Adjusted R2 0.4142 0.4150 0.4213 0.4207 0.4046 0.4093 0.4064 0.4040 Table 6
Foreign Currency (FC) Hedging Interest Rate (IR) Hedging
Effects of Derivatives use on firm's value - regression results: Table 6 presents the results for regression on the use of derivatives on firm's value. The dependent variable is the logarithm of Tobin's Q1, Panel A, and Tobin's Q2, Panel B, as a proxy for firm´s value and is calculated as: (1) Q1, division of the sum of total assets and market value of equity minus the book value of equity, all divided by total assets; (2) Q2, Market Value of Equity divided by total assets. Under each column we analyzed a different definition of hedging sample, Models 1 to 8. The variable Hedging is always a dummy variable, equal to 1 when firm hedge according to the question of each Model (hedger, Model 1;derivative hedger, Model 2; FC derivative hedger,Models 3 to 5; IR derivative hedger, Models 6 to 8). TotA is the natural logarithm of total assets, a proxy for firm value. LEV stand for Leverage. IG stands for investment grows. ID dummy stands for diversification in industrial segments. GD stands for geographic diversification. DY stands for dividend yield, a proxy for the access to financial makets. ROCE stands for the return on capital employed, a proxy for profitability. And C stands for the constant. ***, ** and * denote significance at the 1%, 5% and 10%, respectively. t-statistics are based on White standard errors and appears between ( ). The definition of the variables and Models are presented in Appendix 1 and Appendix 2, respectively. The estimations were conducted by using the Eviews econometric software, edition 6.0.
Panel A: Dependent Variable - Tobin's Q1
Table 7, Panels A and B, refers to the non-financial firms quoted in Italian stock market. Results evidence hedging activity is less rewarded by market, either if firms manage their risks with derivatives or not, than Iberian market. A recent survey conducted in Italian market by Bodbnar et al. (2008) concludes that the percentage of firms using derivatives or insurance instruments are mainly the large ones and has not changed noticeably since 1999 (the beginning of the euro period).
In Panel A, with Tobin’s Q1 as a dependent variable, the regression results show no statistical significant hedging dummy coefficients. Though, Panel B, with Tobin’s Q2 as a
FC(IR) Hedgers
FC(IR) Deriv. Hedgers
Tobin's Q2 Model 1 Model 2 Model 3 Model 4 Model 5 Model 6 Model 7 Model 8
Hedging dummy 0.0973 * (1.7361) Deriv. Hedging dummy 0.1114 ** (2.2827) FC hedging dummy 0.1367 *** 0.1377 *** -0.0171 (2.6982) (2.6761) (-0.2081) IR hedging dummy 0.1073 *** 0.1082 ** -0.0374 (2.4291) (2.2296) (-0.5079) Log TotA -0.0458 -0.0531 -0.0593 -0.0697 ** -0.0352 -0.0487 -0.0425 -0.0365 (-0.9165) (-1.0531) (-1.1799) (-2.5754) (-0.6953) (-0.9691) (-0.7610) (-0.7245) LEV -0.0157 *** -0.0158 *** -0.0156 *** -0.0154 *** -0.0159 *** -0.0161 *** -0.0157 *** -0.0159 *** (-12.5663) (-13.1730) (-13.1918) (-15.3429) (-12.9675) (-13.4082) (-12.9188) (-13.0442) IG 0.0018 *** 0.0019 *** 0.0019 *** 0.0019 ** 0.0017 *** 0.0018 *** 0.0017 *** 0.0017 *** (3.5295) (3.5298) (3.4218) (2.2586) (3.6218) (3.5129) (3.1463) (3.6039) ID dummy 0.0279 0.0350 0.0169 0.0523 0.0340 0.0331 0.0460 0.0292 (0.6489) (0.8137) (0.3862) (1.0480) (0.7770) (0.7756) (1.0968) (0.6146) GD -0.0001 -0.0003 -0.0006 -0.0004 0.0000 -0.0002 -0.0002 -0.0001 (-0.1501) (-0.3542) (-0.6434) (-0.4356) (-0.0534) (-0.2244) (-0.2072) (-0.1302) DY -0.0050 -0.0058 -0.0091 -0.0016 -0.0010 -0.0064 -0.0090 -0.0015 (-0.2523) (-0.2891) (-0.4432) (-0.1154) (-0.0496) (-0.3162) (-0.4302) (-0.0726) ROCE 0.0000 -0.0001 -0.0002 0.0008 -0.0002 0.0001 -0.0017 -0.0003 (-0.0004) (-0.0582) (-0.0971) (0.6918) (-0.0981) (0.0599) (-1.2999) (-0.1300) C 0.5335 ** 0.5871 ** 0.6446 ** 0.6450 *** 0.5437 ** 0.5782 ** 0.5379 * 0.5580 ** (2.0026) (2.2224) (2.4116) (4.2651) (2.0160) (2.1793) (1.8574) (2.0608) Nr of observ. 147 147 147 129 147 147 133 147 Nr of Hedgers 110 95 77 77 14 81 81 18 R2 0.6862 0.6903 0.6958 0.7029 0.6781 0.6906 0.7028 0.6787 Adjusted R2 0.6680 0.6724 0.6781 0.6830 0.6594 0.6727 0.6836 0.6601
Foreign Currency (FC) Hedging Interest Rate (IR) Hedging Regression Analysis: non-financial firms quoted in Lisbon and Madrid Stock Exchange Market