Editor
Carla Nunes, FCT, Universidade do Algarve, Faro, Portugal
Editorial Board
Brion Duffy, Agroscope FAW Wadenswil Bacteriology, Switzerland Carla Nunes, FCT, Universidade do Algarve, Portugal
Christian Larrigaudiere, IRTA-Institut de Recerca i Tecnologia Agroalimentàries, Spain Josef Streif, Inst. Sonderkulturen & Produktsphysiologie, Hohenheim, Germany Maribela Pestana, FCT, Universidade do Algarve, Portugal
Maria Graça Barreiro, Instituto Nacional de Investigação Agrária, Portugal Maria Dulce Antunes, FCT, Universidade do Algarve, Portugal
Miguel Salazar, CICAE, Instituto Universitário Dom Afonso III, Portugal Mustafa Erkan, Akdeniz University, Turkey
Paolo Bertolini, Universita de Bologna, Italy Pol Tijskens, Wageningen University, Netherlands Shimshon Ben-Yehoshua, A.R.O. Volcani Centre, Israel Susan Lurie, A.R.O. Volcani Centre, Israel
The papers contained in this book report some of the peer reviewed Proceedings of the International Conference “Environmentally friendly and safe technologies for quality of fruit and vegetables”, but also other papers related with the subject were included. The manuscripts were reviewed by the Editor and Editorial Board, and only those papers judged suitable for publication were accepted. The Editor wish to thank to all the reviewers and authors for their contribution.
Proceedings of the International Conference “Environmentally friendly and safe
technologies for quality of fruit and vegetables”, held in Universidade do Algarve, Faro,
Portugal, on January 14-16, 2009. This Conference was a join activity with COST Action 924.Convener
Carla Nunes, Universidade do Algarve, Portugal
Scientific Committee
Carla Nunes, Universidade do Algarve, Portugal Amílcar Duarte, Universidade do Algarve, Portugal
Angelos Kanellis, Aristotle University of Thessaloniki, Greece Bart Nicolaï, Katholieke Universiteit Leuven, Belgium
Brion Duffy, Agroscope FAW Wadenswil Bacteriology, Switzerland
Christian Larrigaudiere, IRTA-Institut de Recerca i Tecnologia Agroalimentàries, Spain Domingos de Almeida, Universidade do Porto, Portugal
Josef Streif, Inst. Sonderkulturen & Produktsphysiologie Hohenheim, Germany Krzysztof Rutkowski, Research Inst. of Pomology and Floriculture, Poland Maria Dulce Antunes, Universidade do Algarve, Portugal
Maria da Graça Barreiro, Instituto Nacional de Investigações Agrárias, Portugal Mustafa Erkan, Akdeniz University, Turkey
Paolo Bertolini, Universita de Bologna, Italy Pol Tijskens, Wageningen University, Netherland Shimshon Ben-Yehoshua, A.R.O. Volcani Centre, Israel
Organizing Committee
Carla Nunes, Universidade do Algarve, Portugal Amílcar Duarte, Universidade do Algarve, Portugal Bart Nicolaï, Katholieke Universiteit Leuven, Belgium Maria Dulce Antunes, Universidade do Algarve, Portugal Maria Emília Costa, Universidade do Algarve, Portugal Maribela Pestana, Universidade do Algarve, Portugal
Miguel Salazar, Instituto Universitário Dom Afonso III, Portugal
Sponsors
COST, European Cooperation in the field of Scientific and Technical Research
Fundação para a Ciência e a Tecnologia
International Association of Students in Agriculture and Related Sciences, Faro
Serviço Técnico Pós-colheita do IRTA em Portugal Algarve.resorts.net
Câmara Municipal de Faro Câmara Municipal de Albufeira
Câmara Municipal de Aljezur Câmara Municipal de Lagos
Câmara Municipal de S. Brás de Alportel Crédito Agrícola, Caixa do Algarve A Farrobinha 80 g C.N. Kopke & Cª PrimeDrinks, S.A. Uniprofrutal Frutas Mourinho
Se c ti o n 1 . n on -d eS tr u c ti v e m et h o d S f o r m ea Su ri n g q u a li ty o f f ru it S a n d v eg et a bl eS
04. HOW TO ANALySE NON-DESTRuCTIVE DATA FOR
BIOLOgICAL VARIATION
LMM Tijskens1*, RE Schouten1, P Konopacki2, G Jongbloed3, M Kessler4
1 Horticultural Supply Chains, Wageningen University, the Netherlands 2 Institute of Pomology and Floriculture, Skierniewice, Poland
3 Delft University of Technology, Institute of Applied Mathematics, Delft, the Netherlands 4 Technical University of Cartagena, Group Applied Mathematics & Statistics, Cartagena, Spain
*E-mail: [email protected]
abstract
Biological variance is omnipresent. In animals, in humans, in biology, in sociology, medicine, you name it. In fact, life would be utterly boring without biological variation. Also in agricultural and horticultural produce, the ubiquitous variation causes a lot of trouble in dealing with the product in the supply chain. Basically, the majority of troubles and problems in the food production and supply chain is in one way or another related to the presence of variation between entities like individuals, up to batches, pallet loads, orchards and harvests, and down to cells and organelles. Many modern measuring techniques make it possible to analyse product entities without destroying the samples. These gathered, so-called longitudinal data, offer many advantages for extracting information. By using these techniques, it becomes possible to follow individual units (batches, fruit etc.) in time, and estimate the kinetics of change in (any) properties on an individual level. Destructively obtained data (cross-sectional data) can only be analysed at the level of mean values, neglecting completely the information on variance contained in data. Explained parts of data analysis con increase from 60-70% obtained on cross-sectional data to well over 90% obtained on longitudinal data, with the quantification of the biological variance present. The analysis of longitudinal data, however, requires a special approach and the use of special analysing techniques. The benefits of longitudinal data and their analysis using mixed effect non linear regression for extracting information on maturity and biological variance within a batch, is highlighted based on a large number of examples, already published or in preparation, covering the colour and firmness of nectarines, water loss in plums, mandarins and melons, firmness in Near Isogenic Lines of melons, colour of apples in storage and during growth. More and more papers are published that prove the usefulness for both theory and practice of the applied techniques and viewpoints on biological variation.
Introduction
More and more, experimental data are gathered using non-destructive measuring techniques (so-called longitudinal data). By using these techniques, it becomes possible to follow individual units (batches, fruit etc.) in time, and follow the kinetics of change in (any) properties on an individual level. Much more information can be extracted from this type of data than is possible on destructive data (so-called cross-sectional data), where one inevitably has to deal with mean values in some form. To gain information on the variance in properties between individuals, the analysis of longitudinal data, however, requires a special approach and the use of special analysing techniques.
In this paper, the benefits of longitudinal data and their analysis using mixed effect non linear regression for extracting information on maturity and biological variance within a batch, is highlighted based on a large number of examples, already published or in preparation, covering the colour and firmness of nectarines, water loss in plums, mandarins and melons, firmness in Near Isogenic Lines of melons, colour of apples in storage and during growth.
The increasing number of recent publications applying the same or similar technology indicates that the method is very useful in gaining more insight in the processes occurring in the produce.
En v ir o n m En ta ll y F ri En d ly a n d S a FE tE ch n o lo g iES F o r Q u a li ty o F F ru it S a n d vE g Eta bl ES Statistical Basics
All measured data contain variation. Where that variation resides in the data is not always clear. In many regression analyses applying basic statistical knowledge and procedures, it is explicitly assumed that the residual variation ( ) in the measured property is additive and distributed according to a Gaussian (normal) distribution. In Eq 1 an example is shown for a simple exponential behaviour including an asymptotic value
ymin. Exponential behaviour is a direct consequence of first order reaction, and is frequently encountered in
agricultural and horticultural research.
Eq 1
The fundamental basis of the presented technique is that the residual variation ( ) can be split up in two
parts: the variation caused by the measuring technique and/or equipment (the technical error t) and the
residual variation caused by the biological system of growth and harvest. Due to differences in location (due to e.g. different exposure to light), and the inevitable small variations in weather conditions (microclimate), soil structure and fertilisation, plants and plant parts do not grow and ripen in the same time. Harvest procedures are another source of variation, and added to previously described factors (sources of variation) will result in considerable variation in the state of maturity or time of development. That really represents the biological variation present in any batch of produce, whether still on the plant or post harvest. So, in short, the biological variation can in fact be expressed as a difference in time of development (biological
0) is bound to be different
for each individual fruit or entity in a batch.
In a mathematical sense, the biological variation in the equation (e.g. Eq 1), should be put exactly there
where it belongs: at the time variable (t). When the pre-exponential factor in Eq 1 (y0-ymin) is converted into
a exponential form as shown in Eq 2, the resulting expression is (Eq 3):
Eq 2
Eq 3
where yref is a chosen value (within the range of change observed) as a reference point to express the
t in Eq 3 are normally
distributed random variables with a mean and standard deviation. Applying different temperatures during storage, the rate constant k depends on the applied temperature (according to Arrhenius’ law). As a consequence, the estimated biological shift factors will also show a different value, even for the same fruit. To compare biological shift factors at different temperatures, one can convert them to a dimensionless
*
Modern measuring techniques are, in general, most of the time accurate and reliable. That means that the technical error is relatively small. If not, the technique of measurement will never provide informative data and will in the long run disappear completely.
So, Eq 3 expresses the exponential behaviour including (or pointing to) the variation in the data. Of course for more complex formulations of the exponential behaviour, or for completely different type of behaviour, the deduction has to be done anew. The line of reasoning, however, remains exactly the same. Some data were generated using Eq. 1 with the input values as shown in Table 1 and 2 that will be used to explain and elucidate the technology.
Se c ti o n 1 . n on -d eS tr u c ti v e m et h o d S f o r m ea Su ri n g q u a li ty o f f ru it S a n d v eg et a bl eS
data analysis
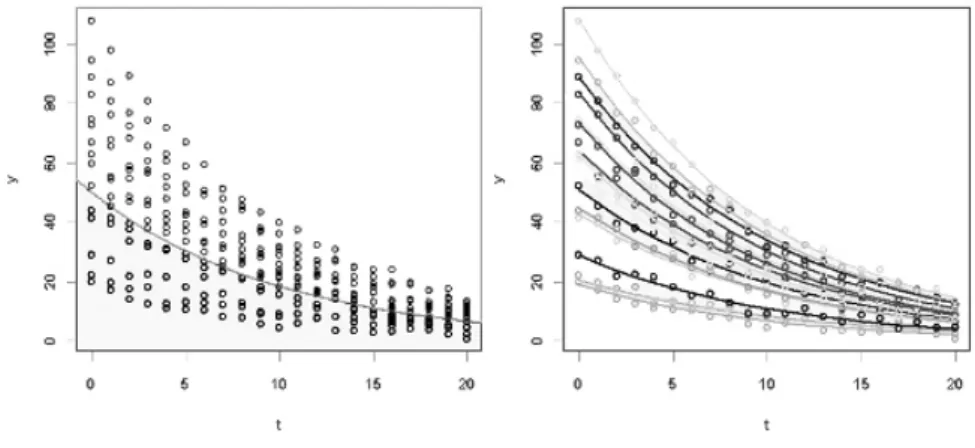
traditional approachIn Fig 1, an example is shown for the traditional representation, not using the individual information (Left). As a modeller and data analyst, one gets not very happy with this type of data. Analysing the data shown in Fig 1, using the traditional approach (classical non-linear regression), the results are not really satisfying. The explained part is about 58%, while the standard errors are large (Table 1). The estimated values are for themselves not that bad compared to the values used for simulating the data. The estimated behaviour is drawn as a solid line in Fig 1 Left.
Structured approach using full Benefits of longitudinal data
The main question is how to improve the analysis, in terms of reliability, accuracy and information extraction. Assuming that data were gathered using non destructive techniques using the same individuals repeatedly over time (longitudinal data), not only the measured values at the measuring time but also a code or number for the individual fruit are known. Fruit do mature and senesce in time, but the initial condition, where the fruit started at time zero will be and has to be identical for all points in time. When the data are highlighted as individual fruit, the representation is much more understandable (Fig 1 Right).
The same initial condition for each fruit also means that the biological shift factor, that is the shift in time to put each individual line over one another (Fig 1 Right), is identical for all data points in time for that one particular individual. Applying this knowledge about individuals, and assuming the rate constant to be the same for all fruit, one can estimate that common rate constant and one biological shift factor for each individual using standard non linear regression analysis. However, also more realistic and sophisticated methods were developed where some parameters in the model are assumed to be common for all individuals (fixed effects) whereas others vary randomly over the individuals (random effects). These so-called mixed effects regression automatically does just that: estimating some parameters in common (fixed effects) while some parameters are estimated for each individual (random effects). Of course any other factor in the data set can be used for other applications. Procedures of mixed effects estimation are available in the better statistical packages like SAS and S-Plus. A package that is freely available on the internet is R (R Development Core Team 2005). The deeper concepts of mixed effects analysis are described in a simple way by De Ketelaere et al. (2006).
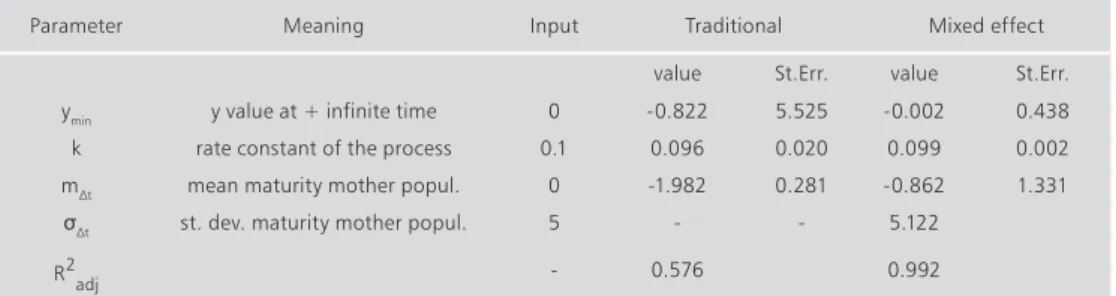
table 1. Data used in examples, input, traditional analysis, structured analysis.
Parameter Meaning Input Traditional Mixed effect
value St.Err. value St.Err.
ymin y value at + infinite time 0 -0.822 5.525 -0.002 0.438
k rate constant of the process 0.1 0.096 0.020 0.099 0.002
m mean maturity mother popul. 0 -1.982 0.281 -0.862 1.331
st. dev. maturity mother popul. 5 - - 5.122
R2adj - 0.576 0.992
table 2. Additional input information. yref # initial y value
50 ntime # number of times in a time series 21
nrep # number of repetitions 15
En v ir o n m En ta ll y F ri En d ly a n d S a FE tE ch n o lo g iES F o r Q u a li ty o F F ru it S a n d vE g Eta bl ES
fig 1. Simulated data according to an exponential behaviour. Left: unstructured, Right: structured per individual.
The results of mixed effects non linear regression analysis of the same data are also shown in Table 1. The
explained part (R2
adj) is very high, well over 99% and the standard errors of estimates are low, while the
estimated values are more close to the input values.
The estimated biological shift factors can be analysed separately on normality, e.g. using the Shapiro Wilk test. They also can be used to convert the calendar time (as measured) into a biological time (general state of Especially for graphical represen tation of the behaviour of all individuals, that is most useful and appealing. In Fig 2 the measured data are plotted against the biological time for all the individuals in the batch.
fig 2. Measured data points (dots) and simulated data (line) versus biological time, based on values from Table 1.
Examples from Practice
Studies dedicated to unravel the behaviour of biological variance were started some 12 years ago (Tijskens & Wilkinson 1996). During the last 5 years, however, the technology was developed and refined and at an increasing rate, studies were published that applied this technology in one way or another (see References).
Se c ti o n 1 . n on -d eS tr u c ti v e m et h o d S f o r m ea Su ri n g q u a li ty o f f ru it S a n d v eg et a bl eS
On every occasion, it is amazing to find out the benefits of the combination of non-destructive (longitudinal data) and mixed effects analysis. The obtained explained parts were always very high, well into to 90% (about 3211 observations over 540 individuals), frequently above 95 to 98%. In the next sections some examples will be presented to provide a feeling for its potential for agricultural and horticultural research.
Colour of apples in Storage
The colour of horticultural produce very often changes upon storage according to a logistic behaviour. In
a recent report, Tijskens et al. (2008) described the change in a*-value of ‘Granny Smith’ apples according
to this model. In Eq. 4, the function is shown. The full experimental setup, and the details of the analyses can be found in the original paper.
Eq 4
It was found that not only the initial condition in colour (col0
also the lower (green) asymptote (colmin) depended on the individual apple. The results of the analysis were
so reliable that a small effect of chilling injury could be noticed and modelled. The kinetic constants (rate constants and activation energies) were found to be generic for all three orchards. In Fig 3 the raw data versus calendar time and the standardised colour behaviour versus biological time are shown for storage at 10 ºC.
fig 3. Colour (a*-value) of ‘Granny Smith’ apples from 3 orchards in Slovenia, stored at 10 ºC (Nobs=529, Ngroups=90).
Left: Measured data versus calendar time, Right: Standardised data versus biological time.
firmness of near Isogenic lines of melons
Data on non-destructively measured firmness of near isogenic lines (26 lines in 2 consecutive seasons) was analysed using the biological shift factor systems according to an exponential model (first order kinetics Eq 1-3). Although the lines and the individuals in a line were greatly different with respect to size and shape, for each season the rate constant could be estimated in common (fixed effects) using mixed effects non linear regression analysis, while the biological shift factor and the asymptotic value were estimated for each individual fruit (random effects). The obtained explained parts were 97% (2005: 533 observations in 63 groups) and 91% (2006: 829 observations in 76 groups). A clear effect of the isogenic lines could not be detected. In Fig 4 the raw data, indicating the variation in a boxplot, and the standardised colour behaviour versus biological time are shown.
En v ir o n m En ta ll y F ri En d ly a n d S a FE tE ch n o lo g iES F o r Q u a li ty o F F ru it S a n d vE g Eta bl ES
fig 4. Firmness of NILs of melons, season 2006 (Nobs=829, Ngroups=76). Left: box plot of raw data, indicating the range and variance, versus time, right: standardised firmness versus biological time.
Colour and firmness of nectarines
The absorption of fruit flesh of nectarines (strongly related to the chlorophyll content of the fruit flesh) was measured using Time Resolve reflectance Spectroscopy using laser light at 670 nm. The absorption coefficient was determined at harvest (Tijskens et al. 2007) and in a separate experiment during storage
(Tijskens et al. 2006a). The TRS absorption coefficient μa was analysed according to a logistic behaviour
(Eq 4) using mixed effect non linear regression analysis. The kinetic rate constant could be estimated in common (fixed effects), while the biological shift factor was estimated separately for each fruit (random effects). The obtained explained parts were well over 96% for storage at 20 ºC and around 85% at 10 ºC. The difference in reliability is probably due to the increasingly relative importance of the technical variation
( t). The estimated biological shift factor for the stage of development expressed as light absorption,
was used as an estimate for the biological shift factor of the same fruit, but now expressed as firmness. Destructively measured firmness data were analysed using simple non linear regression analysis, but including the variation in stage of development as estimated from the light absorption coefficient, only determined at harvest. In Fig 5 some results are shown for raw data and generic firmness behaviour for one cultivar stored at 20 ºC.
fig 5. Firmness of nectarines (cv ‘Spring Bright’, season 2004) at 20 ºC. Left: raw data versus calendar time after harvest, right firmness versus biological time, estimated on the biological shift factor of flesh colour (Nobs=1738).
Se c ti o n 1 . n on -d eS tr u c ti v e m et h o d S f o r m ea Su ri n g q u a li ty o f f ru it S a n d v eg et a bl eS water loss
Weight of produce can easily be measured non-destructively, with almost no technical variation. Applying this measuring system repeatedly on individual fruit makes it possible to include the variation in the analysis. Moreover, it makes it possible to pinpoint where the variation resides. Applying mixed effect non linear regression analysis based on an exponential behaviour, which is a massive simplification of the generally
applied diffusive model (Eq 5), extremely high explained parts where obtained with R2
adj well over 99%
(Tijskens et al. 2010), irrespective of size, volume, area or even skin resistance.
Eq 5
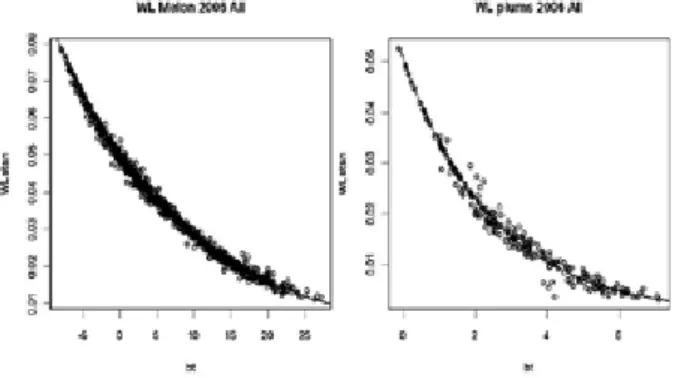
The variation in water loss in plums, melons and mandarins could be completely attributed to the fraction of weight, i.e. water available for transpiration. Based on these results, it was concluded that the generally diffusive approach, applied for the past 50-60 years, is not valid (enough) and that more dedicated research should be conducted to unravel the real mechanisms and processes ruling this water loss, by applying mixed effect analysis on dedicated longitudinal data. In Fig 6 some results are shown for melons and plums.
fig 6. Behaviour of individually measured weight loss of melons (Nobs=834, Ngroups=77) and plums (Nobs=240, weight that still can be lost (WLr-WL).
Conclusions
Non destructive measuring techniques make it possible to gather longitudinal data, measuring the same individuals over time. Applying mixed effect regression analysis using the coded individuals as random
factor, more reliable analyses can be obtained. Usually the obtained explained part (R2
adj) increases from
about 40 to 60% to more than 90%, sometimes to more than 99%. A clear picture can be obtained where the major impact of the omnipresent biological variation resides in the product or in the mechanism. The remainder of the variation, that is that part of the variation in the data that is not explained by the model or the technical variation, can be more clearly extracted and if necessary analysed further.
In short, the combination of non-destructive measuring techniques, longitudinal data and mixed effects analysis is a very powerful combination to increase the knowledge of produce and procedure to grow and store product in a fashion dedicated to maintain quality and health promoting compounds.
En v ir o n m En ta ll y F ri En d ly a n d S a FE tE ch n o lo g iES F o r Q u a li ty o F F ru it S a n d vE g Eta bl ES
acknowledgements
For the acknowledgements of the separate studies mentioned above, are mentioned in the original papers. One organisation, in common of all these studies, is the EU COST 924 action that financed several Short Term Scientific Missions to a number of the authors.
references
De Ketelaere B, Stulens J, Lammertyn J, Cuong NV, De Baerdemaeker J. 2006. A methodological approach for the identification and quantification of sources of biological variance in postharvest research. Postharvest Biol Technol 39:1–9
Hertog MLATM. 2002. The impact of biological variation on postharvest population dynamics. Postharvest Biol Technol 26:253–63
Hertog MLATM, Lammertyn J, Desmet M, Scheerlinck N, Nicolaï BM. 2004. The impact of biological variation on postharvest behaviour of tomato fruit. Postharvest Biol Technol 34:271–84
Lammertyn J, De Ketelaere B, Marquenie D, Molenberghs G, Nicolaï BM. 2003. Mixed models for multicategorical repeated response: modelling the time effect of physical treatments on strawberry sepal quality. Postharvest Biol Technol 30:195-207
R Development Core Team 2005. R: A language and environment for statistical computing. R Foundation for Statistical Computing, Vienna, Austria. ISBN 3-900051-07-0, Available at: http://www.R-project.org. Schouten RE, Otma EC, van Kooten O, Tijskens LMM. 1997. Keeping Quality of cucumber fruits predicted
by biological age. Postharvest Biol Technol 12:175-81
Schouten RE, Tijskens LMM, van Kooten O. 2002. Predicting keeping quality of batches of cucumber fruits based on a physiological mechanism. Postharvest Biol Technol 26:209–20
Schouten RE, Jongbloed G, Tijskens LMM, van Kooten O. 2004. Batch variability and cultivar keeping quality of cucumber. Postharvest Biol Technol 32:299-310
Schouten RE, Zhang X, Verschoor JA, Otma EC, Tijskens LMM, van Kooten O. 2009. Development of colour of Broccoli heads as affected by controlled atmosphere storage and temperature. Postharvest Biol Technol51:27–35
Tijskens LMM, Wilkinson EC. 1996. Behaviour of biological variability in batches during post-harvest storage. AAB Modelling Conference: Modelling in Applied Biology - Spatial Aspects. p. 267-8, 24-27 June 1996, Uxbridge, UK
Postharvest Biol Technol 27:15-25
Tijskens LMM, Heuvelink E, Schouten RE, Lana MM, van Kooten O. 2005. The biological shift factor.
Biological age as a tool for modelling in pre- and postharvest horticulture. Acta Hort687:39-46
Tijskens LMM, Eccher Zerbini P, Vanoli M, Jacob S, Grassi M, Cubeddu R, Spinelli L, Torricelli A. 2006a. Effects of maturity on chlorophyll related absorption in nectarines, measured by non-destructive time-resolved reflectance spectroscopy. Int J Postharvest Technol Innovation 1:178-88
Tijskens LMM, Herold B, Zude M, Schlüter O, Geyer M. 2006b. Biological variation in the apple orchard,
pp:27-34. In: Proc COST 924 workshop From plant to Human genes, Ovesná J, Pouchová V, Mitrová K,
(eds), November 2006, Prague, CZ. ISBN 80-86555-99-2.
Tijskens LMM, Eccher Zerbini P, Schouten RE, Vanoli M, Jacob S, Grassi M, Cubeddu R, Spinelli L, Torricelli A. 2007. Assessing harvest maturity in nectarines. Postharvest Biol Technol 45:204-13
Granny Smith apples. Modelling the effect of senescence and chilling injury. Postharvest Biol Technol 50:153–63
Tijskens LMM, Dos-Santos N, Jowkar MM, Obando J, Moreno E, Schouten RE, Monforte AJ, Fernández Trujillo JP. 2009. Postharvest firmness behaviour of near-isogenic lines of melon. Postharvest Biol Technol 51:320-6
Tijskens LMM, Jacob S, Schouten RE, Fernández-Trujillo JP, Dos-Santos N, Vangdal E, Pagán E, Pérez Pastor A. 2010. Water loss in horticultural products. Modelling data analysis and theoretical considerations. Acta Hort 858:465-71