UNIVERSIDADE DE LISBOA
FACULDADE DE CIÊNCIAS
DEPARTAMENTO DE BIOLOGIA ANIMAL
Climate adaptation at local level: characterising adaptation
options in Portugal
Susana Isabel Vicente Marreiros
Mestrado em Ecologia e Gestão Ambiental
Dissertação orientada por:
Tiago Capela Lourenço
Acknowledgements
I could not have written this dissertation without the help of the following people, whom I wish to thank. To Tiago Capela Lourenço, my advisor and former boss, for his encouragement, for all the fruitful discussions, and for his ability to share his encyclopedic knowledge of adaptation in a way that is both intelligible and captivating.
To João Pedro Nunes, my advisor, for his support and for all the pragmatic comments and good advice he gave me through the process of writing my dissertation.
To the current and former members of CCIAM. A special thank you to the constant support and motivation from Luís, Mário, Bruno, Andreia, Ângela, Sílvia, Ana Lúcia, Tomás, Marta, Ricardo, Ana de Jesus, Helena, and of course my advisors Tiago and João.
To the wonderful professors of the Masters in Ecology and Environmental Management, especially Filomena Magalhães and José Costa Lino.
To the ClimAdaPT.Local municipality officials for their work, with a special thank you to the ones I talked to during the early stages of my dissertation (when it was going in a different direction): Mariana Oliveira from Guimarães, Ana Lourenço and Inês Metelo from Lisbon, Pedro Conde from Seia, Margarida Frade and Sandra Pedro from Torres Vedras, Rosa Lopes from Coruche and Inês Rafael from Loulé.
To Bruno, Luís, Mário and Carolin, whose help and feedback I am very grateful for.
To my friends, who have always been wonderfully kind and supportive, especially Inês, Marta, Carolin, Ricardo, Rita Mendes, Rita Basto, Mara, Filipa and Jorge.
E como os últimos são os primeiros, o meu maior agradecimento (e na língua materna) é à minha Família, pelo amor e apoio incondicionais. Obrigada, Mãe, Pai, Lena, Margarida e Martinho. E aos meus queridos Avós, a quem dedico esta dissertação, obrigada por me ensinarem que nada se consegue sem trabalho.
Resumo (Português)
As alterações climáticas são um assunto cada vez mais importante e urgente. O aumento das emissões de gases com efeito de estufa e as alterações nos usos do solo causam mudanças profundas na atmosfera e provocam alterações nos padrões climáticos. As tendências atuais a nível global e regional, bem como as projeções climáticas para o futuro, apontam para um agravamento dos eventos climáticos extremos em todo o mundo. No contexto europeu, Portugal encontra-se particularmente vulnerável às alterações climáticas devido à sua localização, dado que o Mediterrâneo é a região europeia que enfrenta um maior número de impactos, e a Península Ibérica em especial tem sido alvo dos maiores aumentos de temperatura da Europa, estando projetado que estas tendências continuem a agravar-se. O aumento dos episódios de ondas de calor e dos incêndios florestais, a diminuição do volume de precipitação (com consequente agravamento das situações de seca) e a subida do nível médio das águas do mar têm causado impactos em Portugal e antevê-se que continuem a piorar no futuro.
Dada esta tendência que se verifica, é urgente atuar sobre as alterações climáticas através da mitigação (reduzindo as emissões de gases com efeito de estufa) e adaptação (evitando e/ou reduzindo danos e aproveitando as oportunidades que as alterações climáticas proporcionam). Estas duas formas de ação estão interligadas e são complementares, sendo ambas essenciais para lidar com as alterações climáticas e salvaguardar o futuro de ecossistemas, populações e atividades económicas.
Esta dissertação propôs a avaliação dos padrões de adaptação à escala local em Portugal. Os objetivos foram categorizar, padronizar e analisar as opções de adaptação de municípios portugueses, avaliar se existe uma ligação entre análise de risco, dados climáticos e adaptação, mapear o risco e a adaptação para eventos climáticos específicos, e induzir como o país se irá adaptar no futuro.
Como contextualização introdutória, analisou-se o estado-da-arte mundial, europeu e nacional em relação à adaptação, tornando o foco gradualmente mais local. Atualmente, existem vários instrumentos de adaptação a diferentes escalas. Portugal está bem encaminhado relativamente à adaptação, tendo 13 estratégias/planos a nível intermunicipal e 47 a nível municipal (EMAAC), com mais alguns a ser atualmente desenvolvidos, o que significa que a maior parte do continente e regiões autónomas está coberta por um ou mais instrumentos de adaptação.
O foco principal desta dissertação foram as 27 estratégias municipais de adaptação produzidas por técnicos municipais no âmbito do projeto ClimAdaPT.Local, que decorreu entre 2015 e 2016. Este projeto contou com o apoio de uma equipa científica e baseou-se numa metodologia específica denominada ADAM (Apoio à Decisão em Adaptação Municipal), que inclui a identificação de vulnerabilidades atuais e futuras, análise de risco, identificação e avaliação de opções de adaptação, integração nos instrumentos de gestão territorial, monitorização e revisão. Para uma análise mais objetiva das visões e intuitos dos municípios, nesta dissertação as opções de adaptação foram classificadas em 21 clusters, de acordo com o seu âmbito e objetivos principais. Esses dados padronizados permitiram ter uma visão geral das tendências de adaptação em Portugal: prevenir cheias/inundações, poupar água, sensibilizar a população e os técnicos locais, adaptar as práticas agroflorestais e realizar monitorização são as principais ações que os municípios se propõem a implementar.
O tipo de adaptação mais comummente referido pelos municípios estudados é referente às opções não estruturais (soft adaptation), as quais dizem respeito a ações que não requerem intervenções físicas, podendo ser de gestão, políticas, sociais, entre outras, sendo um dos exemplos mais comuns a educação ambiental. 63% das opções elencadas pelos municípios incluem-se nesta classe. Esta tendência é
particularmente relevante já que as opções não estruturais são mais flexíveis em relação à incerteza e frequentemente acarretam custos de implementação menores do que ações que requeiram a construção de infraestruturas.
Na maioria dos casos estudados nesta dissertação não há uma correlação direta entre adaptação, dados climáticos e análise de risco, havendo apenas duas exceções: i) a correlação significativa (p-value <0,02) entre a área municipal ardida e a proporção de opções para prevenir/recuperar de incêndios florestais, o que demonstra que os municípios reagem aos fogos florestais de grande dimensão, procurando evitar que se repitam no futuro, ou seja, são mais reativos do que proativos no que diz respeito à forma como se adaptam a este tipo de evento climático; ii) a correlação (p-value <0,10) entre o risco futuro de seca e a proporção de opções para poupança de água, mostrando um certo grau de preocupação com a forma como as secas afetam uma multiplicidade de setores. Para todos os outros casos, embora os municípios estejam geralmente a adaptar-se aos impactos esperados, a proporção de opções de adaptação para lidar com uma vulnerabilidade específica não tem relação com a gravidade desse risco ou com o quão extremo o clima se está a tornar. Além disso, algumas vezes um risco específico não foi analisado, mas foram elencadas opções de adaptação para lidar com esse risco, ou, contrariamente, o risco foi analisado, mas não foram criadas opções para se adaptar ao mesmo.
O processo de adaptação é complexo e depende de uma multiplicidade de fatores difíceis de quantificar e avaliar, tais como as especificidades e prioridades dos municípios e os backgrounds e funções dos técnicos envolvidos. Em última análise, a estratégia tem de ser aprovada pela hierarquia superior no município, portanto a sua estrutura e decisões estarão também dependentes das agendas políticas e dos orçamentos alocados ou expectados.
Tendo em conta os resultados desta dissertação, foram induzidas algumas tendências futuras relativamente à adaptação às alterações climáticas em Portugal: i) espera-se que o aumento de estratégias intermunicipais seja baixo, uma vez que quase todas as comunidades intermunicipais já possuem atualmente uma estratégia; ii) o desenvolvimento de EMAACs será mais lento do que até agora, mas esta tendência poderá mudar caso surjam novas oportunidades de financiamento; iii) é expectável que a prevenção e recuperação de fogos florestais continue a ser um processo reativo num futuro próximo, a menos que haja uma mudança de paradigma no país; iv) nos próximos anos haverá uma crescente implementação de opções de adaptação, marcando a passagem das políticas à prática; v) os técnicos locais estarão cada vez mais sensibilizados e informados sobre a temática das alterações climáticas, estando mais seguros das suas escolhas e propostas de adaptação; vi) o processo de adaptação continuará a ser complexo e difícil de prever ou analisar, no entanto poderá ser mais eficiente do que atualmente se forem seguidas algumas recomendações.
Assim, tendo em conta a importância crescente da adaptação às alterações climáticas em Portugal, e por forma a contribuir para o aumento da eficiência do processo adaptativo ao nível local e regional, foi criada uma lista de recomendações: assegurar que as equipas que elaboram as estratégias são transdisciplinares, estão bem informadas e conscientes das bases científicas que suportam as suas decisões; assegurar que as estratégias intermunicipais são suficientemente abrangentes e detalhadas para que as problemáticas de cada município sejam abordadas; avaliar todos os riscos possíveis em contexto de alterações climáticas e assegurar que são listadas opções que permitam a adaptação a cada um deles; adotar um formato específico para os nomes das opções de adaptação, tornando-as mais objetivas; revisitar o ciclo da metodologia ADAM periodicamente ao longo do tempo, atualizando cada um dos
Summary (English)
Climate change is an increasingly important and urgent issue. The rise in greenhouse gas emissions and the changes in land use result in deep changes in the atmosphere and cause shifts in the climatic patterns. The current global and regional trends and the future climate projections point to a worsening of extreme climate events across the world. In the European context, Portugal is particularly vulnerable to climate change due to its location. Increases in hot temperatures/heat waves and forest fires, decreases in precipitation volume and the rising sea level have been impacting Portugal and are projected to keep worsening in the future.
Given this current trend, it is urgent to act on climate change through mitigation (reducing the emissions of greenhouse gases) and adaptation (avoiding/reducing harm and taking advantage of opportunities that climate change provides).
This dissertation proposed the assessment of adaptation patterns at the local level in Portugal. The purpose is to identify trends and assess if there is a connection between risk analysis, climate data and adaptation.
As an introductory contextualisation, the state-of-the-art of the country regarding adaptation was analysed. Portugal currently has 13 adaptation strategies/plans at the inter-municipal level and 47 at the municipal level, with several more currently being developed, which means that most of the country is covered by one or more adaptation documents.
The core of this dissertation was the 27 municipal adaptation strategies that were developed by municipal officials in the scope the ClimAdaPT.Local project, using a specific methodology that included risk analysis, with the support of a scientific team. To more objectively analyse the municipalities’ views and goals, the adaptation options were classified into clusters, according to their main scope and objectives. This data allowed to have an overview of the adaptation trends: saving water, preventing flooding, raising awareness and adapting agricultural/forestry practices are the main actions the municipalities propose to implement.
The analysis showed that, for the majority of the cases, there is no direct correlation between adaptation, climate trends and risk analysis, with only two exceptions: i) significant correlation (p-value <0,02) between the municipal burnt area and the proportion of forest fire prevention/recovery options; ii) correlation (p-value <0,10) between the future risk of drought and the proportion of water saving adaptation options. For all the other cases, while the municipalities are generally adapting to the expected impacts, the proportion of adaptation options to deal with a specific vulnerability does not have any relation with how severe that risk is or how extreme the climate is becoming. Moreover, sometimes a specific risk was not evaluated, and there were adaptation options to address it, or oppositely the risk was evaluated but occasionally there were no options to adapt to it. The adaptation process is complex and depends on a multitude of factors such as the municipalities’ specificities and priorities and officials’ backgrounds. Since the methodology is cyclic, it should be revisited over time in order to ensure that adaptation responds to the pressing climate change issues in the municipality. Ultimately, the strategy must be approved by the higher hierarchy within the municipality, therefore the structure and decisions will also depend on what the political agenda is.
Finally, given the growing importance of climate change adaptation in Portugal, a list of recommendations was made with the purpose of contributing to the efficiency of the adaptation process at the local and regional level.
Palavras-chave
adaptação às alterações climáticas; eventos extremos; políticas de adaptação; impactos climáticos; análise de risco
Keywords
Index
Acknowledgements ... I Resumo (Português) ... II Summary (English) ... IV Palavras-chave ... V Keywords ... V Index ... VI Table index ... VIII Figure index ... IX List of abbreviations and acronyms ... X1. Introduction ... 1
1.1. Climate change: from global to local scale ... 1
1.2. Climate action – Mitigation vs adaptation ... 3
1.2.1. Adaptation concepts ... 5
1.3. The climate change adaptation context ... 8
Worldwide ... 8
European context ... 9
National level adaptation in Portugal ... 9
The early days of municipal adaptation in Portugal (2007-2014) ... 11
The ClimAdaPT.Local project (2015-2016) ... 11
Overview – current situation in Portugal (September 2019) ... 15
2. Objectives ... 17
3. Framework ... 17
4. Methodology ... 18
4.1. Analysing the adaptation options ... 18
4.1.1. Screening the adaptation options ... 18
4.1.2. Standardising the options into clusters ... 18
4.1.3. Discarding least common clusters ... 25
4.1.4. Calculating absolute and relative frequencies of adaptation options ... 25
4.2. Correlations between variables... 26
4.2.1 Selecting specific adaptation option clusters ... 26
4.2.2. Gathering the risk analysis ... 26
4.2.3. Gathering climate data ... 27
4.2.4. Calculating correlations ... 28
4.3. Mapping risk and adaptation ... 29
4.4. Methodology summary ... 29
5. Results ... 31
5.1. Initial distribution mapping of adaptation options by type ... 31
5.2. Initial list of standardised clusters ... 32
5.3. Discarded clusters ... 32
5.5. Absolute and relative frequencies of adaptation options ... 33
5.6. Climate data ... 34
5.7. Correlations between variables... 35
5.8. Mapping risk and adaptation ... 37
5.8.1. High temperatures/heat waves ... 37
5.8.2. Forest fires ... 38
5.8.3. Extreme precipitation/flooding ... 39
5.8.4. Droughts ... 40
5.8.5. Sea level rise ... 42
6. Discussion ... 44
6.1. Critique/limitations to this work ... 46
7. Conclusions ... 47 7.1. Main conclusions ... 47 7.2. Ways forward ... 48 8. References ... 49 Annexes ... 55 Annex I ... 56 Annex II ... 57 Annex III ... 102 Annex IV ... 130 Annex V ... 131 Annex VI ... 133 Annex VII ... 134
Table index
Table 4.1. Initial list of 24 standardised adaptation option clusters ... 19
Table 4.2. Selected adaptation options and climatic events they are directly connected to ... 26
Table 4.3. Summary of the selected variables of climate data and their details ... 27
Table 4.4. List of correlations studied ... 28
Table 5.1. Initial list of 24 standardised adaptation option clusters ... 32
Table 5.2. List of discarded clusters ... 33
Table 5.3. Final list of 21 standardised adaptation options ... 33
Table 5.4. Excerpt from the table of relative frequencies ... 34
Table 5.5. Most common options listed by the municipalities (proportionally) ... 34
Table 5.6. Maximum proportion of municipal area that was burnt in a year ... 35
Table 5.7. Results of the calculations of Spearman correlations ... 36
Figure index
Figure 1.1. Carbon dioxide data, measured at Mauna Loa Observatory ... 1
Figure 1.2. Projected changes in mean annual, summer and winter temperature in Europe ... 3
Figure 1.3. Observed and projected trends in global CO2 emissions ... 4
Figure 1.4. Types of climate change adaptation ... 7
Figure 1.5. Systematisation of subsection 1.3 of the Introduction ... 8
Figure 1.6. Thematic areas (vertical) and priority sectors (horizontal) in ENAAC 2020 ... 10
Figure 1.7. Map of the 27 municipalities involved in the ClimAdaPT.Local project ... 12
Figure 1.8. Conceptual scheme of the ADAM methodology ... 13
Figure 1.9. Risk matrix used in step 2 of the ADAM methodology ... 14
Figure 1.10. Current state of climate change adaptation plans/strategies... 16
Figure 4.1. Schematic summary of the correlation analysis ... 29
Figure 4.2. Summary of the methodology ... 30
Figure 5.1. ClimAdaPT.Local municipalities’ proportion of adaptation options ... 31
Figure 5.2. Scatter plot showing the highest analysed correlation ... 36
Figure 5.3. Mapping regarding high temperatures/heat waves ... 37
Figure 5.4. Mapping regarding forest fires ... 38
Figure 5.5. Mapping regarding extreme precipitation/flooding ... 39
Figure 5.6. Mapping regarding droughts ... 41
List of abbreviations and acronyms
Acronym/
abbreviation Full spelling
ADAM Decision Support in Municipal Adaptation [in Portuguese, Apoio à Decisão
em Adaptação Municipal]
AI Aridity Index
APA Portuguese Environment Agency [in Portuguese, Agência Portuguesa do
Ambiente]
AR5 IPCC’s Fifth Assessment Report
CAOP Official Administrative Map of Portugal [in Portuguese, Carta
Administrativa Oficial de Portugal]
CCIAM Climate Change, Impacts, Adaptation and Modelling [research group] cE3c Centre for Ecology, Evolution and Environmental Changes [research centre]
CO2 Carbon Dioxide
COP Conference of the Parties
EEA European Environment Agency
[when followed by the word “Grants”, it means European Economic Area] EMAAC Municipal Climate Change Adaptation Strategy [in Portuguese, Estratégia
Municipal de Adaptação às Alterações Climáticas]
ENAAC National Climate Change Adaptation Strategy [in Portuguese, Estratégia
Nacional de Adaptação às Alterações Climáticas]
EC European Commission
EU European Union
FCUL Faculty of Sciences of the University of Lisbon
FPC Portuguese Carbon Fund
GHG Greenhouse gases
GIS Geographic Information System
ICNF Institute for Nature Conservation and Forests [in Portuguese, Instituto da
Conservação da Natureza e das Florestas]
IPCC Intergovernmental Panel on Climate Change
IPMA Portuguese Institute for Sea and Atmosphere [in Portuguese, Instituto
Português do Mar e da Atmosfera]
NUTS Nomenclature of Territorial Units for Statistics [in Portuguese,
Nomenclatura das Unidades Territoriais para Fins Estatísticos]
PDM Municipal Master Plan [in Portuguese, Plano Diretor Municipal]
PIC-L Local Climate Impacts Profile [in Portuguese, Perfil de Impactos Climáticos
Locais]
PMAC AML
Lisbon Metropolitan Area Climate Change Adaptation Metropolitan Plan [in Portuguese, Plano Metropolitano de Adaptação às Alterações Climáticas da
Área Metropolitana de Lisboa]
PMDFCI Municipal Plan to Defend Forests Against Fire [in Portuguese, Plano
Municipal de Defesa da Floresta Contra Incêndios]
PNAC National Climate Change Programme [in Portuguese, Programa Nacional
PO SEUR
Operational Programme for Sustainability and Efficient Use of Resources [in Portuguese, Programa Operacional Sustentabilidade e Eficiência no Uso de
Recursos]
ppm Parts per million
QEPiC Strategic Framework for Climate Policy [in Portuguese, Quadro Estratégico
para a Política Climática]
RCP Representative Concentration Pathway
SLR Sea level rise
UNFCCC United Nations Framework Convention on Climate Change WWTP Wastewater treatment plant
1. Introduction
1.1. Climate change: from global to local scale
Climate change is “a change in the state of the climate that can be identified by changes in the mean and/or the variability of its properties and that persists for an extended period, typically decades or longer” (IPCC 2014a).
The cause of such changes can consist of natural processes or, most relevantly since the industrial era, in anthropogenic changes. Anthropogenic climate change is caused by the emission of greenhouse gases (GHG) into the atmosphere and by changes in land use, which result in shifts in the climatic patterns (IPCC 2014a).
The concentration of the three main GHG1 in the atmosphere is currently the highest of the last 800.000
years (IPCC 2014a). Carbon dioxide (CO2) is the more important individual GHG (Cloy and Smith
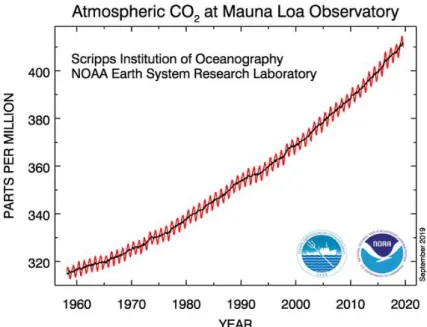
2018) and the main sources of its emissions are the use of fossil fuels (oil, coal, natural gas) and deforestation. The average CO2 concentration has already reached 400 parts per million (ppm), which
corresponds to a 40% increase since the year 1750 (EEA 2017a), and this value keeps rising. As an example, for the week beginning on the 15th of September 2019, the average CO
2 concentration at Mauna
Loa Observatory2 was 408,50 ppm. In the same week, 1 year before, that value was 405,67 ppm, while
ten years earlier it was 384,59 ppm (Figure 1.1) (NOAA 2019).
Figure 1.1. Carbon dioxide data, measured at Mauna Loa Observatory (NOAA 2019). The red curve represents the seasonal variation, while the black curve shows the seasonally corrected data
The increase in the global average temperature is the main expression of climate change, due to the change in energy flux (radiative forcing) caused at the top of the atmosphere (IPCC 2014a). Since the
1 The three main GHG are CO
2 (carbon dioxide), CH4 (methane) and N2O (nitrous oxide) (Cloy and Smith 2018). 2 Mauna Loa Observatory, in Hawaii, holds the longest record of direct measurements of CO
pre-industrial period, the global worldwide average temperature has already increased by approximately 1,0°C (IPCC 2018).
Global warming is not the only manifestation of climate change. Changes in the atmosphere cause sea level rise (SLR) and an increase in the frequency and intensity of extreme weather events such as heat waves, droughts, fires and extreme rainfall events (IPCC 2014a).
All these events cause vulnerabilities, many of which are difficult to assess. For example, food production is affected, water quality and availability decreases, biodiversity is pressured and disaster risk increases (Arnell and Gosling 2016; Rolim et al. 2017; Thom et al. 2017). In human systems, disadvantaged social groups are the ones with a lower ability to deal with the most severe climate impacts, which leads to increased exposure and creates a vicious cycle of inequality (UNDESA 2016). Past trends and future climate change projections show a strong variability across the planet and impact regions and sectors differently (IPCC 2013, 2014b), with the possibility of the same area being affected by different hazards simultaneously (Mora et al. 2018).
Regarding Europe in particular, there is a very clear climate heterogeneity within the continent. South-eastern and southern Europe have the highest number of sectors and domains severely affected by climate change, thus being considered hotspot regions (EEA 2017a). The Mediterranean faces more impacts than any other European region, such as a large increase in heat extremes, expansion of habitats for southern disease vectors, increasing risk of forest fires and increasing water demand for agriculture, which combined with a decrease in precipitation causes a decline in water availability (Navarra and Tubiana 2013; EEA 2017a). Meanwhile, the decreasing rainfall and increasing evaporation results in a decrease in flood discharges for medium to large scale catchments and an increase for small ones (Blöschl et al. 2019).
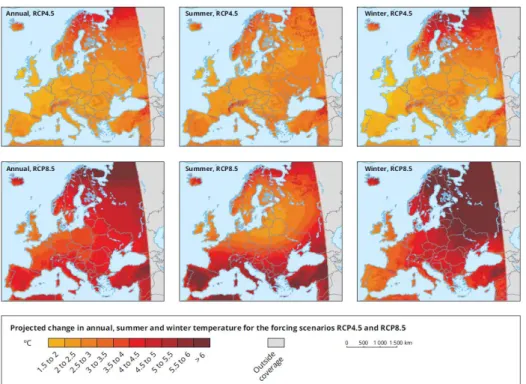
The Iberian Peninsula has experienced the strongest warming in Europe, mainly in the summer season, while Central and north-eastern Europe also experienced strong warmings. These trends are projected to worsen in the future (EEA 2017a) (Figure 1.2).
Figure 1.2. Projected changes in mean annual, summer and winter temperature in Europe for the forcing scenarios RCP4.5 and RCP8.53 (EEA 2017a)
Because of its geographical position in the most southwestern part of Europe, Portugal is one of the most vulnerable European countries regarding the impacts of climate change (Santos et al. 2002). The temperature in Portugal is increasing (EEA 2017b); the annual mean precipitation has had one of the highest decreases in Europe since 1960 (EEA 2016); forest fires burn thousands of hectares every year and generate massive ecological and economic losses (RCM n.o 6-B/2015 2015); and the mean sea level
keeps rising (Santos et al. 2002; Santos and Miranda 2006). The latest projections point to the worsening of these trends in the future, with an increase of 3,7°C in temperature4 (IPMA 2019a) and a decrease of
146mm in annual mean precipitation5 (IPMA 2019a) until the end of the 21st century.
1.2. Climate action – Mitigation vs adaptation
Climate change is considered a global issue (United Nations 2018), and the 13th goal of the United
Nations’ 17 Sustainable Development Goals consists of taking urgent action to combat climate change and its impacts (United Nations 2015a).
Given the threats and trends described above, it is urgent to act on climate change and reduce its cause, i.e. GHG concentration in the atmosphere. Mitigation consists of the decrease in the emission of those gases into the atmosphere. The countries that signed the Paris Agreement in 2015 committed to hold global warming to well below 2°C above pre-industrial levels and pursue efforts to limit warming to 1,5°C, with the purpose of preventing the most severe risks of climate change, particularly the
3 RCPs (Representative Concentration Pathways) are scenarios that take into consideration the concentration of GHG
emissions, other compounds, and land use/cover, over time. The higher the change in energy flux (radiative forcing), the more severe/pessimistic the scenario is. In RCP4.5, radiative forcing is stabilized at about 4.5 W/m2 after 2100. In RCP8.5, radiative
forcing is above 8.5 W/m2 by 2100 and continues to increase for some time (IPCC 2014a).
4 Calculations were made based on the difference (known as anomaly) between the yearly average of mean temperature for
1971-2000 and the most pessimistic future scenario (RCP8.5) for 2071-2100 in mainland Portugal.
5 Calculations were made based on the difference (known as anomaly) between the yearly average of accumulated precipitation
irreversible ones (United Nations 2015b). However, current trends of GHG emissions show it is highly unlikely that these targets will be met, as the observed data is following the pattern of the most pessimistic future scenario (Sanford et al. 2014) (Figure 1.3). And even if there was a drastic reduction in the emissions of GHG, climate would continue to change and its effects would still increase in severity for a very long time, due to the climate system’s characteristics of inertia6 (IPCC 2014a).
Figure 1.3. Observed and projected trends in global CO2 emissions under four RCP scenarios (Sanford et al. 2014)
Therefore, to deal with the effects of unavoidable extreme climate events (and their environmental, social and economic impacts), it is necessary to act through adaptation. In human systems, the purpose of adaptation is to moderate or avoid harm (and costs) or take advantage of positive opportunities caused by climate change (IPCC 2014c). By taking preventive measures, many subsequent costs can be avoided. For example, the investment of 1 Euro in adaptation measures to prevent flooding can save 6 Euro in damage costs (Feyen and Watkiss 2011); and if the focus is on early warning systems, the investment-savings ratio can increase to over 1:400 (Pappenberger et al. 2015). Regarding natural systems, human intervention can help the system’s adjustment to the effects of projected climate change (IPCC 2014c).
Thus, mitigation and adaptation are the two essential and complementary ways to tackle climate change (IPCC 2014a). They are strongly interconnected and often even overlap. For example, efforts like green infrastructure, building insulation and low-input agriculture are considered as both mitigation and adaptation (Winkelman et al. 2017).
1.2.1. Adaptation concepts
Since adaptation is a very broad topic, it is important to be aware of the concepts, approaches and terminology related to it, while keeping in mind that the frontiers between definitions are often tenuous. Below are some essential concepts in adaptation.
• Strategies, options and measures
There are different approaches and terminologies regarding strategies, options and measures in the climate change adaptation context.
An adaptation strategy can be seen as a specific approach or a goal, i.e. those that develop adaptation might have multiple different strategies (Gregg et al. 2018).
Another point of view regarding strategies is that they can be seen as a type of strategic planning that consists of guidelines to define a vision and goals, and allows for the analysis of vulnerabilities and risk, and for the definition of options or measures to adapt to climate change (Capela Lourenço et al. 2017). It is, in short, a document that comprehensively analyses the needs for adaptation and lists what actions should be done to address it. This definition is more complete and in line with the approach in the study area of this dissertation (Portugal), therefore this is what will be used from now on in this dissertation.
It is important to highlight that, whatever the approach is, strategies are key in helping practitioners to deal with – and prepare for – climate change impacts, reducing vulnerability and promoting resilience (Capela Lourenço et al. 2017; Gregg et al. 2018).
Regarding adaptation options, the IPCC defines them as “The array of strategies and measures that are available and appropriate for addressing adaptation. They include a wide range of actions that can be categorized as structural, institutional, ecological or behavioural” (IPCC 2018).
Going into more detail, it can be said that adaptation options are the result of operational planning, in which there is a selection between different possible adaptation actions through careful analysis and evaluation, in line with the knowledge and resources available (Capela Lourenço et al. 2017). This is the approach that will be used in this dissertation.
Adaptation measures consist of the specification and operationalisation of adaptation options, i.e., they are concrete actions that are taken in order to achieve the strategy’s goals. Measures can be objectively dimensioned and they are assigned a specific time and place (Capela Lourenço et al. 2017).
The concept of adaptation plan is often referred to in Portugal as a more operational document than a strategy. For example, a strategy aggregates options, while a plan would aggregate measures. However, in practice, the two concepts are used interchangeably and can almost be considered synonyms.
• Uncertainty
Uncertainty can be caused by insufficient information being available or from disagreements about already existing information (Capela Lourenço et al. 2014). This happens mainly because the cause of climate change, i.e. GHG emissions, cannot be precisely predicted or forecasted (Hallegatte 2009). These emissions depend on an unquantifiable number of variables and sectors (Cloy and Smith 2018).
Nowadays, climate projection models are becoming more robust and future trends can be identified. Although the gap between scientists and decision-makers is narrower than it was in the past, often the information provided by scientists is not usable by decision-makers due to diverging views on what is relevant, credible and usable (Porter and Dessai 2017), as well as a lack of clearly defined concepts and terminology (Capela Lourenço et al. 2014).
• Barriers
Three factors have been identified in the literature as being the main direct barriers for successful climate change adaptation (Biesbroek et al. 2013):
o The time span of climate change is much longer than that of politics and decision-making; o The sole way to study and communicate climate change is through scientific models; o There are always uncertainties and ambiguities inherent to climate change.
Governments can either enable adaptation across scales or act as a barrier to it, as often top-down approaches can reduce the possibility of local action (Biesbroek et al. 2013).
• Proactive vs reactive adaptation
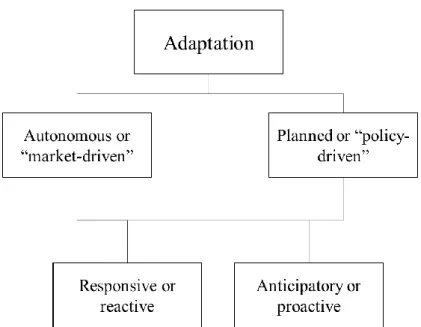
Climate change adaptation can be autonomous or planned, proactive or reactive.
Autonomous adaptation (also referred to as “market-driven adaptation” or spontaneous adaptation) is a “response to experienced climate and its effects, without planning explicitly or consciously focused on addressing climate change” (IPCC 2014b).
Meanwhile, planned adaptation (also referred to as “policy-driven adaptation”) refers to intentional policy decisions made towards the maintenance or achievement of a certain state. These decisions are connected to the knowledge that there have been (or there are about to be) changes in the current conditions (IPCC 2007).
Anticipatory adaptation (also referred to as proactive adaptation) “takes place before impacts of climate change are observed” (IPCC 2007), while responsive adaptation (also known as reactive adaptation) involves acting only when certain climate impacts are experienced and their negative effects are realized (Yousefpour et al. 2017a).
Figure 1.4. Types of climate change adaptation. Source: Own elaboration based on (IPCC 2007, 2014b; Bosello et al. 2009)
• Economic
There are different factors that influence how much is invested (both financially and on human resources) on climate change adaptation. Regarding the local level in particular, adaptation is only one in many issues faced by municipalities on a daily basis, so when decisions need to be made, often other issues seen as more relevant/urgent take the lead on the political agenda, such as health and education (Dannevig et al. 2013). This is even more common in low-income developing countries (Biesbroek et al. 2013), and there are studies that show that adaptation spend is more driven by the municipality’s wealth than by how vulnerable the population might be (Georgeson et al. 2016), which causes the more vulnerable communities to become even more at risk. Thus, it is important and urgent that the benefits of proactive adaptation – and the cost-reduction that comes with it – become more broadly known (Picketts 2018).
• No regrets, low regrets, win-win
According to the kind of benefits that they provide, adaptation options can be described as:
o No regrets: it makes sense to implement this kind of adaptation options regardless of climate change since they provide benefits under any kind of future scenario, even if the future’s uncertainty does not allow for a better-oriented policy action (Heltberg et al. 2009; Kundzewicz et al. 2018; Sanderson et al. 2018). These options are particularly beneficial because they provide immediate benefits and equip people with adaptation experience that can be further developed in the future (UKCIP 2007).
o Low regrets: this kind of adaptation options is similar to “no regrets”, but the benefits are primarily obtained under future climate change conditions (UKCIP 2007).
o Win-win: an adaptation option that has other positive outcomes besides the minimisation of climate risks. This might include social, economic or environmental benefits (UKCIP 2007). For example, when trees are planted to provide shade, they also contribute towards mitigation.
• Categories of adaptation options
Adaptation options can be categorized into green, grey and soft (EEA 2013; Climate-ADAPT 2017): o ‘Green’ adaptation refers to nature-based actions and takes advantage of natural ecosystem services to increase adaptive capacity and resilience; natural systems should be regarded as an essential part of the solution – and not of the problem – to fight climate change (Leitner and Capela Lourenço 2019); river restoration and tree planting are two of the most common examples of green adaptation;
o ‘Grey’ adaptation actions consist of technological and civil engineering constructions – such as dykes or the improvement of water sewage within a city – which promote the adaptation of built systems, land and humans;
o ‘Soft’ adaptation actions do not involve physical interventions and consist of managerial, legal, social, financial and policy approaches that potentiate adaptive capacity and increase awareness about climate change; their non-structural nature means they are often cheaper to apply (Parry et al. 2009); two examples are environmental education and extreme weather warning systems.
Certainly, different types of adaptation actions can (and should) be combined for optimum results. For example, a retention basin to prevent floods might need ‘grey’ infrastructure to complement the ‘green’ adaptation.
1.3. The climate change adaptation context
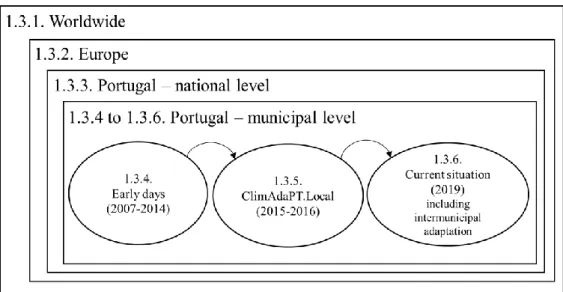
This subsection of the Introduction is divided into six topics (systematised in Figure 1.5). The climate change adaptation reality is zoomed in, from the worldwide to the municipal Portuguese context.
Figure 1.5. Systematisation of subsection 1.3 of the Introduction: The climate change adaptation context.
Worldwide
two years later, together with the second World Climate Conference, they called for a global treaty on climate change (United Nations 2015c).
The United Nations Framework Convention on Climate Change (UNFCCC) is an international environmental treaty that was adopted in 1992 and entered into force in 1994. Its main objective is to stabilise the concentration of GHG in the atmosphere, so that “dangerous anthropogenic interference with the climate system” is prevented (United Nations 1992), in a time scale that is sustainable and realistic to avoid threats for the different systems (ecological, agricultural, economic, etc) (United Nations 1992). Although it is very focused on mitigation, the adaptation component is also highlighted in the listed commitments: “cooperate in preparing for adaptation to the impacts of climate change; develop and elaborate appropriate and integrated plans for coastal zone management, water resources and agriculture, and for the protection and rehabilitation of areas, particularly in Africa, affected by drought and desertification, as well as floods” (United Nations 1992).
In 1995, the first Conference of the Parties (COP) was held, and these meetings have continued to happen yearly since then (United Nations 2015c, 2019a). One of the most important ones was COP21, which led to the Paris Agreement entering into force in 2016 (United Nations 2015b, 2019b). The Paris Agreement built upon the UNFCCC and, like the Convention, it addresses mitigation and the importance of reducing GHG emissions. However, the highlight on adaptation and its urgency is much stronger than before, coming hand-in-hand with mitigation and being perceived as equally crucial: “Parties recognize that adaptation is a global challenge faced by all with local, subnational, national, regional and international dimensions, and that it is a key component of and makes a contribution to the long-term global response to climate change to protect people, livelihoods and ecosystems” (United Nations 2015b).
The most current event regarding climate change at the time of the elaboration of this dissertation is the United Nations Climate Action Summit that will take place by the end of September 2019, which is particularly important due to the increasing urgency of the topic. The main purpose of this summit is “boosting ambition and rapidly accelerate action to implement the Paris Agreement” (United Nations 2019c).
European context
In 2013, the European Commission (EC) released a climate change adaptation strategy in order to encourage adaptation by EU member states (particularly in the most vulnerable sectors), while promoting knowledge for better-informed decision-making (European Union 2013). There are eight actions in which the strategy is based on, which include providing funding, bridging the knowledge gap and ensuring more resilient infrastructure (European Union 2013).
Five years after its publication, the EC released an evaluation of the strategy, which reflected on lessons learned and encouraged improvements for the strategy (European Union 2013; European Commission 2018; Sanderson et al. 2018).
National level adaptation in Portugal
Adaptation to climate change has increasingly gained prominence in Portugal since the beginning of this century. One key-moment for climate change adaptation at the national level happened in 2010
when the National Strategy for Adaptation to Climate Change (ENAAC) was approved (APA 2010), making Portugal a pioneer at the European level (RCM n.o 56/2015 2015).
ENAAC is currently in its second phase of implementation for 2014-2020, named ENAAC 2020 (APA 2015; RCM n.o 56/2015 2015). It is framed within the Strategic Framework for Climate Policy (QEPiC),
which also includes the National Climate Change Programme for 2020/2030 (PNAC 2020/2030)7 (RCM
n.o 56/2015 2015).
The ENAAC 2020 built upon the 2010 version while also improving and increasing its scope, promoting a better interaction between sectors, scales, communities and procedures (RCM n.o 56/2015 2015). The
strategy envisions “a country that is adapted to the effects of climate change through the continuous implementation of solutions based on technical-scientific knowledge and good practices” (RCM n.o
56/2015 2015). Its main objectives are improving the climate change knowledge level, implementing adaptation measures, and promoting the integration of adaptation in sectoral policies (RCM n.o 56/2015
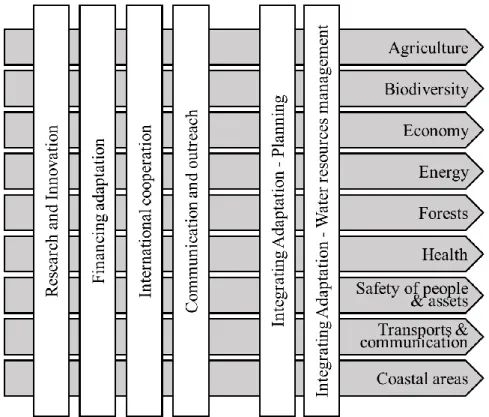
2015). ENAAC 2020 has defined a set of 9 priority sectors and six main thematic areas to help put the theory into practice (Figure 1.6).
Figure 1.6. Thematic areas (vertical) and priority sectors (horizontal) in ENAAC 2020 (translated to English by this dissertation’s author) (APA 2015; RCM n.o 56/2015 2015)
The coordination of each thematic area is a shared task between the Portuguese Environment Agency (APA) – which is the general coordinator of ENAAC – and the entities that have specific competences in each of those themes. Regarding the priority sectors, each of them has a working group which is coordinated by the central government entity that has jurisdiction in the sector. For example, the Biodiversity working group is coordinated by the Institute for Nature Conservation and Forests (ICNF), while the Health working group is coordinated by the Directorate-General for Health (RCM n.o 56/2015
ENAAC 2020 is having its final evaluation in 2020, after which a reviewing process will begin (RCM n.o 56/2015 2015).
The early days of municipal adaptation in Portugal (2007-2014)
Portuguese municipalities are very heterogeneous regarding the importance they give to climate change in their policy agendas (Campos et al. 2017), following Europe’s general trend (Aguiar et al. 2018). The municipal level action in climate change adaptation in Portugal started in 2007, when Almada presented its Local Strategy for Climate Change (Município de Almada 2007). Although this strategy was mainly focused on mitigation, it also mentioned key actions for adaptation.
A few years later, two municipal Strategic Plans for Climate Change were released: Sintra, in 2009 (Município de Sintra 2009), and Cascais, in 2010 (Município de Cascais 2017).
By the end of the year 2014, these were the only three adaptation documents in Portugal at the local level.
The ClimAdaPT.Local project (2015-2016)
ClimAdaPT.Local, a large-scale project, took place in 2015-2016 (ClimAdaPT.Local 2016). Its main objective was to support the development of municipal climate change adaptation strategies by the technicians of 27 Portuguese municipalities.8
At least two municipal officials from each municipality were engaged in the process since the beginning. This engagement of motivated and interested officials is crucial to achieving good results (Dannevig et al. 2013).
The municipalities involved in this project were selected based on geographical heterogeneity criteria. Those municipalities would have to be representative of the variety of the Portuguese territory, which includes socioeconomic diversity and vulnerability to different climate impacts (Penha-Lopes et al. 2016). At least one municipality per inter-municipal community (NUTS III9) of the Portuguese mainland
was selected, as well as one municipality for each of the autonomous regions/archipelagos: Madeira and Azores (each autonomous region also corresponds to one NUTS III). Figure 1.7 shows the spatial representation of the 27 municipalities. The municipality list per NUTS II and III can be found in Annex I.
8 For information about ClimAdaPT.Local’s funding, please refer to section 3 (Framework) of this dissertation.
9 The NUTS classification (Nomenclature of Territorial Units for Statistics) consists of a “hierarchical system for dividing up
the economic territory of the EU”. Its main objectives are to make European regional statistics more homogeneous and comparable, to analyse the regions in different scales, and to frame EU regional policies (Eurostat 2018).
Figure 1.7. Map of the 27 municipalities involved in the ClimAdaPT.Local project and their respective inter-municipal community (which corresponds to the NUTS III). Top left: Azores, with zoom on the São Miguel island; bottom left:
Madeira; right: mainland Portugal. Source: own work based on ClimAdaPT.Local 2016; INE 2019.
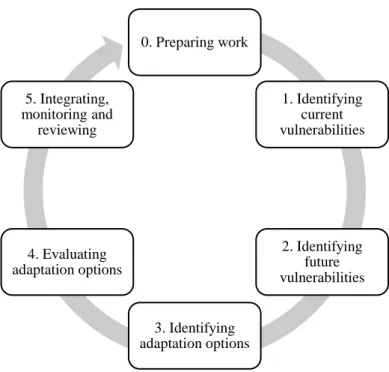
The methodology used in ClimAdaPT.Local was called ADAM (Decision Support in Municipal Adaptation) and resulted from a partnership between the Faculty of Sciences of the University of Lisbon and the UK Climate Impacts Programme (UKCIP)10 (Capela Lourenço et al. 2017). ADAM is a 6-step
cyclic methodology in which each step builds upon the previous ones (Figure 1.8). This methodology was disseminated through training sessions between the scientific team and the municipal officials. Additionally, guidebooks were produced, which clarified each step and the rationale behind it, in a way that would allow ADAM to be replicated in other municipalities in the future (ClimAdaPT.Local 2016; Capela Lourenço et al. 2017).
Figure 1.8. Conceptual scheme of the ADAM methodology, which was used to make the EMAACs during the ClimAdaPT.Local project
The ADAM methodology steps consist of: 0. Preparing work
The main goals of “Step 0” of the methodology are to ensure that municipal officers and technicians are prepared to start the process, namely through understanding why there is a need/motivation for adaptation in the municipality, what the EMAAC’s main goals will be, who will be part of the municipal strategy team and how the procedures will be organised (Capela Lourenço et al. 2017).
1. Identifying current vulnerabilities
In this first step, the municipal officers are expected to do research in order to identify the typology of climatic vulnerabilities the municipality was exposed to in the past. The sources for this information may include municipal databases/registries, civil protection information, news articles, etc. The information should be gathered in a Local Climate Impacts Profile (PIC-L), an Excel spreadsheet which works as a database and includes fields such as date of climate event, type of climate event, main impacts and details about the consequences, and which entities acted on it. This collection of information is particularly important to understand what were the most serious consequences experienced, where they took place, which actions were taken to deal with them and what the main knowledge gaps are (Capela Lourenço et al. 2017).
2. Identifying future vulnerabilities
After analysing the current vulnerabilities, the second step of the methodology focuses on future vulnerabilities. It is crucial in this step to have access to future climate projections, in order to promote a reflection on how future climate might affect the municipality and what the main changes are when compared to the current situation.
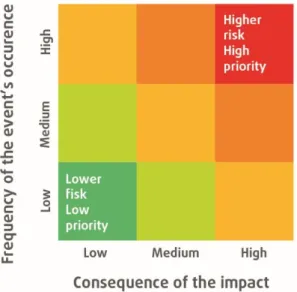
To better analyse and understand the evolution of risk in the municipality, a matrix evaluation was made for three time periods: current climate, medium-term future (2041-2070) and long-term
0. Preparing work 1. Identifying current vulnerabilities 2. Identifying future vulnerabilities 3. Identifying adaptation options 4. Evaluating adaptation options 5. Integrating, monitoring and reviewing
future (2071-2100). Each time period had an associated risk matrix, which incorporated two variables: frequency of the climate event’s occurrence and consequence of the impact, each of which would be given a number between 1 and 3 (where 1 means low and 3 means high). The result of the multiplication of the two numbers would be the risk value for a certain climate event. The municipality would be responsible for evaluating the consequence of the impact, while a scientific team should provide the evaluation for the frequency of the event’s occurrence based on climate projections. In the concrete case of the ClimAdaPT.Local project, that information was provided by the scientific team at the Faculty of Sciences of the University of Lisbon (FCUL). Figure 1.9 shows an example of the risk matrix, in which the green cell corresponds to a low risk of 1 (1×1) and the red cell represents a higher risk of 9 (3×3). The matrix is particularly useful to study which risks are to be given a higher priority in the municipality (Capela Lourenço et al. 2017).
Figure 1.9. Risk matrix used in step 2 of the ADAM methodology
3. Identifying adaptation options
Step 3 is about identifying and describing a list of potential adaptation options that would make the municipality more apt to respond to the risks and take advantages of the opportunities identified in the previous steps of the methodology. The list of adaptation options should include a description of each option, its main objectives, potential barriers, key sectors and main actors related to it (Capela Lourenço et al. 2017).
4. Evaluating adaptation options
This step is closely connected to the previous one as its main goal is to evaluate the adaptation options listed before. Each option will be evaluated against a series of criteria: effectiveness, efficiency, equity, flexibility, legitimacy, urgency, synergies and costs. Each criterion should be given a score between 1 (low) and 5 (high), and the final average of the eight criteria for each adaptation option would determine where it sits on the ranking (Capela Lourenço et al. 2017). This evaluation should be made by several colleagues from different departments in the municipality in order to ensure that different backgrounds and areas of expertise are contributing
• Integrating the adaptation options into the municipal planning documents: it is important that the planning documents are aligned with the adaptation options, in order to make the adaptation process more straightforward. To make sure that is the case, those documents should be studied and their ability to respond to adaptation options (either strategic, regulatory, operational or regarding spatial governance) should be assessed (Capela Lourenço et al. 2017).
• Monitoring and Evaluation of the adaptation strategy: in order for the strategy to keep its usefulness within the municipality, it should be monitored and evaluated regularly. The methodology should not be perceived as inflexible, and the steps should be revisited as often as it is necessary to ensure that the latest relevant information is taken into consideration. (Capela Lourenço et al. 2017).
At the ClimAdaPT.Local project’s final conference, the Network of Municipalities for Local Climate Change Adaptation was founded, with 30 municipalities. The main objective of this network is to increase the Portuguese municipalities’ ability to integrate climate change adaptation action (Fórum das Cidades 2016). The network currently includes 32 member municipalities and 14 partner institutions (Adapt.local 2019).
Overview – current situation in Portugal (September 2019)
Currently, there are 47 EMAACs in Portugal and 18 others in development (Base 2019).
To add to the EMAACs, there are also inter-municipal strategies, corresponding to the NUTS III. Thirteen inter-municipal strategies/plans have been implemented and 8 are currently being developed (Base 2019).
The most recent years have witnessed a slower pace in the development of EMAACs (Base 2019) and a fast growth of inter-municipal strategies/plans, triggered by the Operational Programme for Sustainability and Efficient Use of Resources (PO SEUR) funds (PO SEUR 2016; Base 2019)11.
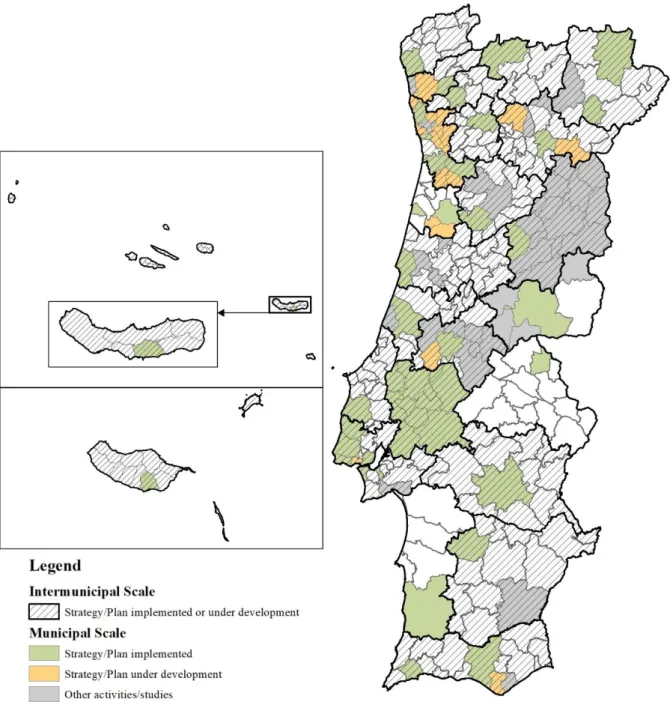
Some municipalities do not have an adaptation strategy/plan per se, but are developing other actions, such as defining specific adaptation measures, raising awareness about climate change, developing working groups, integrating projects that are studying different municipalities, and installing weather stations to improve warning systems (disaster preparedness) (AdaptForChange 2017; Mais Algarve 2018; Base 2019; CLIMRisk 2019; Município de Montemor-o-Velho 2019; Município de Murça 2019; Município de Sabrosa 2019). These municipalities are represented in the map below in the category “Other studies”.
In short, the current situation regarding adaptation in Portugal is that a considerable area of the country is (or will soon be) covered by at least one climate change adaptation document (Figure 1.10) (Base 2019)12.
11 PO SEUR is a programme created to operationalise the Portugal 2020 strategy, which is a partnership between Portugal and
the EC created with the purpose of promoting economic, social and territorial development in Portugal. With a strong focus on sustainability, this programme awarded Portugal with 25 billion Euro until the year 2020 (PO SEUR 2019).
12It is relevant to mention two uncommon situations: 1) although not all inter-municipal regions in the Alentejo have their own
adaptation strategies, they are covered by a larger scale adaptation document: the Alentejo region adaptation strategy. 2) the inter-municipal region of Terras de Trás-os-Montes is subdivided into two smaller municipal associations, which are both creating their adaptation strategies, therefore it was considered that the intermunicipal region is creating its own adaptation strategy.
Figure 1.10. Current state of climate change adaptation plans/strategies at municipal and inter-municipal level for the Azores, Madeira and mainland Portugal. Source: own work based on Base 2019.
2. Objectives
The main goal of this dissertation is to improve the understanding of climate change adaptation at the local level in Portugal, through the identification of trends and types of adaptation options.
This goal was divided in four specific objectives:
1) Categorise, standardise and analyse the adaptation options of the 27 municipalities that participated in the ClimAdaPT.Local project, in Portugal;
2) Study the correlation between risk analysis, climate data and adaptation options within these 27 municipalities;
3) Map risk and adaptation for specific climate events affecting those municipalities; 4) Based on this sample, induce how the country might plan for adaptation in the future.
3. Framework
This dissertation was elaborated within the Master Programme in Ecology and Environmental Management, hosted by the Faculty of Sciences of the University of Lisbon (FCUL).
A substantial and essential part of the data collected for the elaboration of this dissertation was publicly available and resulted from the ClimAdaPT.Local project (ClimAdaPT.Local 2016). This project was a part of the AdaPT Programme (managed by the Portuguese Environment Agency (APA)). It was co-financed at 85% by the EEA Grants13 and at 15% by the Portuguese Carbon Fund (FPC) (Capela
Lourenço et al. 2017).
The dissertation’s author was directly involved in the ClimAdaPT.Local project through her research grant at the Climate Change, Impacts, Adaptation and Modelling (CCIAM) research group, which is part of FCUL’s Centre for Ecology, Evolution and Environmental Changes (cE3c).
13 The European Economic Area Grants (EEA Grants) are funded by Iceland, Liechtenstein and Norway and their main goals
are to contribute towards a more socially and economically equal Europe, and to strengthen the relations between the three funder countries and the 15 beneficiary European countries (EEA Grants 2019).
4. Methodology
The next three subsections (4.1 to 4.3) consist of a detailed description of the methodology used in this dissertation: analysing the adaptation options, correlations between variables and mapping risk and adaptation. Subsection 4.4 presents a schematic representation of the whole methodology.
4.1. Analysing the adaptation options
Starting off with the analysis of the ClimAdaPT.Local municipalities’ adaptation options, the first step of the methodology included several actions that will be described in the subsections below: screening the adaptation options; initial mapping, standardising the options into clusters; discarding the least common clusters; and calculating absolute and relative frequencies.
4.1.1. Screening the adaptation options
A total of 653 climate change adaptation options were collected from the 27 municipal strategies created within the ClimAdaPT.Local project. No options were discarded at this point. The full list of adaptation options can be found in Annex II.
4.1.2. Standardising the options into clusters
Each municipality listed their adaptation options freely according to the ADAM methodology, which does not mention any specific rule on how to write and describe the options. This resulted in a variety of options written in different ways but that often have the same meaning. There was also a large difference regarding detail, with some options being more comprehensive than others.
Taking this into account, and in order to be able to analyse the adaptation options quantitatively, the first action to take was to standardise them, creating clusters that grouped similar options.
At first it was decided that, whenever necessary, one adaptation option could be included into two different standardised clusters, in order to preserve the main messages of that option. However, the use of that methodology meant that including each option in more than one cluster would artificially increase the number of adaptation options and the frequencies would not be possible to analyse. Therefore, it was decided that, in order to preserve the frequency of options, each should only be included into one standardised cluster - the main one, which often is the most specific one that mentions vulnerability to a specific kind of climatic event or is integrated into a specific sector.
Naturally, this categorisation meant the loss of information mentioned above. For a more detailed discussion about this, please refer to section 6 of this dissertation (Discussion).
After some changes in the standardised names and merges between similar options, the initial list of standardised clusters of adaptation options is represented on Table 4.2.14
Table 4.1. Initial list of 24 standardised adaptation option clusters
# Adaptation option cluster 1 Agroforestry practices
2 Aquaculture choices adaptation 3 Awareness-raising (general public) 4 Coastal management
5 Cold spell management 6 Disaster preparedness 7 Economic capacitation 8 Ecosystem protection
9 Energy efficiency improvement 10 Flood prevention
11 Forest fire prevention/recovery 12 Green areas improvement/increase 13 Heat wave management
14 Invasive species/pests management
15 Knowledge promotion (municipality officials and agents) 16 Land degradation prevention
17 Land use planning 18 Monitoring
19 Policy development/reviewing/implementation 20 Sustainable mobility improvement
21 Tourism promotion
22 Urban design improvements 23 Water saving
24 Water streams/aquifers sustainable management
A detailed description of each cluster of adaptation options follows below.
1. Agroforestry practices
This cluster of options relates to agricultural and forestry changes. It conveys a new attitude from the municipalities towards the new climatic reality, taking advantage of opportunities to produce new species that better deal with warmer temperatures, while also promoting the current native species that are more resilient to the effects of climate change and changing the urban paradigm by promoting urban gardens where inhabitants can grow their own crops.
Examples of pre-standardised adaptation options
Creating and promoting urban gardens; using autochthonous species on public gardens.
2. Aquaculture choices adaptation
This type of option was not included into any other cluster due to its distinctiveness. The need to study and promote aquaculture was mentioned due to the concern with the impacts of climate change in the fishing industry.
3. Awareness-raising (general public)
Given the urgent nature of climate change, it is crucial that the population is educated about it. Thus, this cluster includes every adaptation option that relates to awareness-raising and environmental education related to climate change issues. It might be targeted towards a specific age group, such as adults or school students.
Examples of pre-standardised adaptation options
Encouraging behavioural change; improving the residents’ knowledge about climate change in general; improving the farmers’ knowledge of best agricultural practices considering climate change; creating good-practice guides for the general public.
4. Coastal management
As a country with a proportionally large coastline, the Portuguese municipalities whose borders include the ocean are particularly concerned with coastal erosion and other damages that might arise from sea level rise and storm surge. This cluster relates to building protection infrastructures or restoring seaside ecosystems (dunes, beaches).
Also, with the seaside areas being threatened by these more intense climate events, it could be the case that the only way to avoid damage is to evacuate permanently from the more exposed locations. This cluster also gathers those adaptation options whose purpose is to retreat from vulnerable coastal areas.
Examples of pre-standardised adaptation options
Beach nourishment; dune restoration; creating breakwaters, ripraps and/or other kinds of coastal protections; relocating infrastructures situated in vulnerable areas.
5. Cold spell management
The climate projections for Portugal – and the World – point out to an increase in global mean temperatures and “it is virtually certain15 that, in most places, there will be more hot and fewer cold
temperature extremes” (IPCC 2013). Even though the municipality officials were aware of this reality, they addressed the need to deal with snow and ice in a few adaptation options.
6. Disaster preparedness
This cluster includes all the adaptation options that involve being ready to deal with the impacts of extreme weather events, including the creation of warning systems or the improvement of already existing ones in the municipality. Those warning systems are described generally, being aimed at “extreme events” and covering more than one kind of climatic event.
Examples of pre-standardised adaptation options
7. Economic capacitation
Europe’s economy is negatively affected by climate change in a significant way (Du et al. 2017). This fact was reflected upon by the officials of some ClimAdaPT.Local municipalities, who listed options to adapt the economy to climate change, reducing weaknesses and taking advantage of economic opportunities.
Examples of pre-standardised adaptation options
Promoting the development of sustainable economic activities; improving insurances to take into consideration the climate change trends; complementing the municipal budget with external financial funding.
8. Ecosystem protection
This cluster is comprised of adaptation options that have the purpose of protecting the habitats, including specific vulnerable communities. References to climate change are scarce in this category and it can be argued that these options would be implemented even if climate change was not a reality, thus they are no regrets options (view subsection 1.2.1 of the Introduction: Adaptation
concepts). Please note that options related to coastal management have their own specific cluster
and are not included in this.
Examples of pre-standardised adaptation options
Protecting the cork oak forest; protecting areas with special botanic value; management of natural resources.
9. Energy efficiency improvement
Energy efficiency can relate to energy saving, acclimatisation, biomass (e.g. using green cuttings) and use of renewable energies. This cluster is very broad, as it includes options that can be categorised as both mitigation and adaptation.
Examples of pre-standardised adaptation options
Using biomass for energy production; using renewable energies; promoting energy/thermic efficiency in buildings.
10. Flood prevention
These are adaptation options that prevent flooding. Many of the options improve drainage systems, while some of the options mention the creation of a specific plan.
Examples of pre-standardised adaptation options
Creating flood management plans; avoiding construction near water streams, increasing the permeable areas; separating the sewage systems (wastewater/rainwater); improving/restoring the drainage network; creating retention basins.