Establishing a Diphtheria Toxin-sensitive system for
cell ablation within the embryonic small intestine in
mouse
UNIVERSIDADE DO ALGARVE Faculdade de Ciências e Tecnologia
Establishing a Diphtheria Toxin-sensitive system for
cell ablation within the embryonic small intestine in
mouse
Mestrado Integrado em Engenharia Biológica
Trabalho efetuado sob a orientação da Doutora Natalia Soshnikova
e coorientação do Professor Doutor José Bragança
UNIVERSIDADE DO ALGARVE Faculdade de Ciências e Tecnologia
Establishing a Diphtheria Toxin-sensitive system for cell
ablation within the embryonic small intestine in mouse
Declaração de autoria de trabalho
Declaro ser o autor deste trabalho, que é original e inédito. Autores e trabalhos consultados estão devidamente citados no texto e constam da listagem de referências incluída.
Copyright © 2016,
porAna Patrícia Martins de Jesus
A Universidade do Algarve reserva para si o direito, em conformidade com o disposto no Código do Direito de Autor e dos Direitos Conexos, de arquivar, reproduzir e publicar a obra,
independentemente do meio utilizado, bem como de a divulgar através de repositórios científicos e de admitir a sua cópia e distribuição para fins meramente educacionais ou de
investigação e não comerciais, conquanto seja dado o devido crédito ao autor e editor respetivos.
Establishing a Diphtheria Toxin-sensitive system for
cell ablation within the embryonic small intestine in
mouse
Ana Patrícia Martins de Jesus
2016The work presented in this thesis was conducted at the Institute of Molecular Biology (Mainz, Germany), in the Developmental and Stem Cell Biology Laboratory, under the supervision of
There is no passion to be found in playing small, in settling for less than the life you are capable of.
ii
AKNOWLEDGMENTS
First of all, I would like to express my gratitude to my supervisors – Dr. Natalia Soshnikova, for giving me the opportunity to do my internship at the Developmental and Stem Cell Biology Laboratory of the Institute of Molecular Biology, and to Dr. José Bragança, for allowing me to give my first steps in the science world in his laboratory.
To my lab colleagues – Juri, Margarita, Lira and Maxim – thank you for receiving me so well, for all the help and companionship. To my blondie Berith, for all the good moments, delicious donuts and unforgettable memories.
To my friends who were always present, even though we were kilometers apart – Patrícia, Tatiana, Ana Raquel e Margarida.
To Eduarda, the first person I have worked with, my eternal gratitude for the all support during my time in (rainy) Germany and also for helping me keep my mental sanity during not so brighter times.
To my parents, who always gave me the freedom to design my own path and encouraged me to pursue my dreams, and my little sister, Catarina, that always knows how to put a smile on my face.
Finally, and even though a thank you is not enough, to João – who encouraged me to go abroad and never stopped believing in me when everything else was falling apart. Thank you for always being by my side.
iii
i. ABSTRACT
The mouse small intestine possesses a highly complex structure with finger-like protrusions – villi – surrounded by invaginations called the crypts of Lieberkühn. Until it reaches its mature form, the embryonic small intestine undergoes a series of morphological and molecular changes. However, little is known about the molecular program involved in the development and establishment of the mouse small intestine.
Id2, an inhibitor of DNA binding and differentiation, has been found to play a role in several biological processes, such as stem cell maintenance and tumorigenesis, and is a plausible candidate to be involved in the mechanisms mentioned above.
The present study investigated the possible Id2 role in the development of the mouse small intestine through the ablation of the Id2+ cell population via Diphtheria Toxin (DT). The work conducted aimed to establish a DT-sensitive cell system for the ablation of the Id2+ cell population in the mouse embryonic small intestine, and compare the genetic profiles between sorted Id2+ epithelial iDTR- and iDTR+ cell populations. It was also proposed to evaluate the contribution of Id2 in the emmergence of the Lgr5+ cell population.
Upon treatment of the embryos with DT, apoptosis was detected by immunohistochemistry targeting γH2AX in the iDTR+ embryos, with changes in the morphology of the iDTR+ embryonic small intestine also being showed by hematoxylin and eosin staining. Furthermore, upon cell sorting, Id2+ cells were found to be reduced when compared to control.
Gene expression of the sorted cells by qPCR also showed a decrease in Id2 levels. Analysis of the high-red iDTR+ cell population by qPCR of a panel of genes – Lgr5, PUMA, Ascl2, Wnt6, Wnt11, Sfrp5, Rspo1, Rspo3, Snai2, Smoc2, Id1, Id3, Kcnq1, Kcne3, TBP, St8sia3, Slc2a3, OneCut2 – suggests that this cell population acquires proliferative and stem cell characteristics. The analysis of the non-red iDTR+ cells genetic profile also suggests a proliferative character.
iv
ii. RESUMO
O intestino delgado de ratinho possui uma estrutura altamente complexa, apresentando protrusões – as vilosidades – rodeadas por invaginações, designadas criptas de Lieberkühn. O intestino delgado embrionário passa por uma série de alterações morfológicas e moleculares até atingir o seu estado maturo. No entanto, pouco se sabe acerca dos programas moleculares envolvidos no desenvolvimento e a maturação do intestino delgado de ratinho.
O gene Id2, um inibidor de ligação do DNA e de diferenciação, é descrito como possuindo um papel relevante em vários processos biológicos, nomeadamente na manutenção de células estaminais e a tumorigénese, sendo então um possível candidato a estar envolvido nos mecanismos mencionados anteriormente.
O trabalho apresentado investigou o possível envolvimento de Id2 no desenvolvimento do intestino delgado de ratinho, através da ablação da população celular Id2+ mediada pela Diphtheria Toxin (DT). Este projeto teve como objetivo estabelecer um sistema de células sensíveis à ação da DT para proceder à ablação da população celular Id2+ no intestino delgado embrionário de ratinho, bem como comparar os perfis genéticos entre células epiteliais iDTR -e iDTR+ isoladas. Outro dos objetivos propostos foi avaliar a contribuição de Id2 no aparecimento da população celular Lgr5+.
Após o tratamento dos embriões com a DT, foi detetada apoptose nos embriões iDTR+, através de ensaios de imunohistoquímica, tendo como alvo γH2AX, bem como alterações na morfologia destes embriões, detetada por staining com hematoxilina e eosina. Além disso, detetou-se uma redução na população Id2+ em embriões iDTR+, comparativamente às condições controlo.
Através de análise por qPCR, as células isoladas apresentaram um decréscimo da expressão de Id2. A população de células Id2+ high-red foi analisada geneticamente para o seguinte conjunto de genes – Lgr5, PUMA, Ascl2, Wnt6, Wnt11, Sfrp5, Rspo1, Rspo3, Snai2, Smoc2, Id1, Id3, Kcnq1, Kcne3, TBP, St8sia3, Slc2a3, OneCut2 –, e os resultados sugerem que esta população celular adquire características proliferativas e de células estaminais. A análise do perfil genético de células Id2+ non-red sugere igualmente um perfil proliferativo.
v
iii. TABLE OF CONTENTS
AKNOWLEDGMENTS ... ii
i. ABSTRACT ... iii
ii. RESUMO ... iv
iii. TABLE OF CONTENTS ... v
iv. LIST OF ABBREVIATIONS ... vii
v. LIST OF FIGURES ... xi
vi. LIST OF TABLES ... xvii
1. INTRODUCTION ... 1
1.1. Small intestine ... 1
1.1.1. Adult small intestine ... 1
1.1.2. Small intestine in embryos ... 4
1.2. Stem cells ... 6
1.2.1. Stem cells in adult small intestine ... 6
1.2.2. Stem cell markers ... 8
1.2.3. Stem cell niche ... 10
1.3. Cell differentiation and proliferation in the small intestine ... 12
1.3.1. Wnt/β-catenin pathway ... 13
1.3.2. BMP pathway ... 15
1.3.3. Notch pathway ... 17
1.3.4. Hh pathway ... 19
1.3.5. Eph/ephrin pathway ... 20
1.4. Cell lineage studies ... 21
1.4.1. Cell ablation ... 22
1.4.2. Diphtheria Toxin mediated cell ablation ... 22
1.4.3. Diphtheria Toxin Receptor ... 24
1.5. Id2 protein ... 26
2. OBJECTIVES ... 28
2.1. Project background ... 28
2.2. Goal ... 28
3. METHODOLOGY ... 30
3.1. Tamoxifen preparation and administration ... 30
3.2. DT administration ... 30
3.3. Sampling ... 30
3.4. Western Blot ... 31
vi
3.6. Histochemistry ... 34
3.6.1. Tissue processing... 35
3.6.2. Immunostaining ... 36
3.6.3. Hematoxylin and eosin staining ... 37
3.7. Isolation of intestinal cells ... 38
3.7.1. Isolation of epithelial cells ... 38
3.8. Genetic analysis ... 38
3.8.1. cDNA synthesis and amplification ... 38
3.8.2. Quantitative PCR ... 41
3.8.3. Statistical analysis ... 43
4. RESULTS AND DISCUSSION ... 44
4.1. Sampling ... 44
4.2. Establishment of the inducible system ... 44
4.2.1. iDTR expression in HprtCreiDTR mice ... 46
4.2.2. Genotyping ... 47
4.2.3. DT receptor localization and cell death assessment ... 48
4.2.4. Embryo morphology ... 51
4.3. Ablation of Id2 positive cells ... 53
4.3.1. Establishment of conditions ... 53
4.3.2. Isolation of intestinal epithelial cells ... 59
4.3.2.1. Genetic analysis of intestinal epithelial cells ... 74
5. CONCLUSIONS ... 82
6. FUTURE PERSPECTIVES ... 83
7. REFERENCES ... 84
vii
iv. LIST OF ABBREVIATIONS
[3H]dt Tritiated thymidine
aa Amino acids
APC Adenomous Poliposis Coli
Ascl2 Achaete-scute family bHLH transcription factor 2
Bmi-1 B cell specific Moloney murine leukemia virus integration site 1 BMP Bone Morphogenetic Protein
bp Base pairs
bw Body weight
CamKII Calcium/calmodulin-dependent kinase
CBC Crypt Base Columnar
cDNA Complementary DNA
CK1 Casein Kinase 1 CO2 Carbon Dioxide DAPI 4’, 6’-Diamidino-2-phenylindole Dhh Desert Hedgehog Disp Dipatched DLL Delta-like
DNA Deoxyribonucleic acid
dsDNA Double-stranded DNA
Dsh Disheveled
DT Diphtheria Toxin
DT-A Fragment A of Diphtheria Toxin DT-B Fragment B of Diphetheria Toxin
E Embryonic day
EF-2 Elongation factor 2 EGF Epidermal Growth Factor
EGFR Epidermal Growth Factor Receptor EpCAM Epithelial Cell Adhesion Molecule Eph Erythropoietin-producing hepatocellular ESC Embryonic Stem Cells
EtBr Ethidium Bromide
viii FACS Fluorescence Activated Cell Sorting
Fw Forward
Fzd Frizzled
gDNA Genomic DNA
GLP-2 Glucagon-like Peptide 2 GPI Glycosylphophatidylinositol Gpr49 G-protein coupled receptor 49 GSKβ3 Glycogen Synthase β3
h Hour
H&E Hematoxylin and eosin
HB-EGF Heparin-binding epidermal growth factor-like growth factor
Hh Hedgehog
HLH Helix-loop-helix
Id1 Inhibitor of DNA binding/Inhibitor of differentiation 1 Id2 Inhibitor of DNA binding/Inhibitor of differentiation 2 Id3 Inhibitor of DNA binding/Inhibitor of differentiation 3 iDTR inducible Diphtheria Toxin Receptor
Ihh Indian Hedgehog ISC Intestinal stem cells
JAG Jagged
Kcne3 Potassium voltage-gated channel, Isk-related subfamily, gene 3 Kcnq1 Potassium voltage-gated channel, subfamily Q, member 1
kDa kilo Dalton
KO Knockout
LD-PCR Long Distance Polymerase Chain Reaction
Lgr5 Leucine-rich-repeat-containing G-protein-coupled receptor 5 LRC Labelling Retaining Cells
LRP LDL-related Receptor Protein MAD Mothers Against Decapentaplegic MAPK p38 Mitogen-Associated Protein Kinase
MeOH Methanol
min Minute
mRNA Messenger RNA
ix NAD+ Nicotinamide Adenine Dinucleotide NECD Notch Extracellular Domain NEXT Notch Extracellular Truncation NICD Notch Intracellular Domain
NTM Membrane-tethered Intracellular Domain
O/N Overnight
OneCut2 One cut domain, family member 2 PCP Planar Cell Polarity
PCR Polymerase Chain Reaction
PFA Paraformaldehyde
PKC Protein Kinase C
proHB-EGF Membrane-anchored form of HB-EGF
Ptch Patched
PUMA p53 Upregulated Modulator of Apoptosis qPCR Quantitative Polymerase Chain Reaction
Rev Reverse
RNA Ribonucleic acid rpm Rotations per minute R-SMAD Receptor associated SMAD Rspo1 R-spondin 1
Rspo3 R-spondin 3
RT Room temperature
SC Stem cells
SDS-PAGE Sodium Dodecyl Sulphate Polyacrylamide Gel Electrophoresis
sec Seconds
Sfrp5 Secreted frizzled-related protein 5 sHB-EGF Soluble form of HB-EGF
Shh Sonic Hedgehog
Slc2a3 Solute carrier family 2 (facilitated glucose transporter), member 3 SMA From gene sma from small body size
SMAD Homologous of MAD protein from Drosophila and SMA protein from Caenorhabditis elegans
Smo Smoothened
x Snai2 Snail family zinc finger 2
St8sia3 ST8 alpha-N-acetyl-neuraminide alpha-2,8-sialyltransferase 3 TA Transit Amplifying
TAM Tamoxifen
TBP TATA-box Binding Protein
TCF/LEF T-cell Factor/ Lymphoid Enhancer Factor TGFβ Transforming Growth Factor β
Wnt11 Wingless family member 11 Wnt6 Wingless family member 6
xi
v. LIST OF FIGURES
Figure 1. 1. Structure of the adult small intestine in mammals. The tubular small intestine is formed
by 3 main layers of different tissues – the mucosa, the submucosa and the muscularis mucosa. These structures are oriented circumferentially around the lumen. In the mucosa, and facing the lumen, are the villi – responsible for making the small intestine the biggest surface in the body. Mouse image by ©Laurie O’Keefe (2007)9. ... 1
Figure 1. 2. Differentiated cells in the small intestine's epithelium. Absorptive cells are polarized
and have a basal nucleus while enteroendocrine cells have neurosecretory granules. A prominent feature of Goblet and Paneth cells is their secretory granules13 (shown in green). Image adapted from Crosnier
et al. (2006)12. ... 2
Figure 1. 3. Localization of the different cell populations in the crypt-villus axis of mouse small intestine epithelium. The crypt-villus axis is divided into two compartments: a proliferative and
monoclonal one, maintained by stem cells – the crypts –, and a differentiated and polyclonal one – the villus13. Image from Sancho et al. (2015)19. ... 4
Figure 1. 4. Schematic representation of embryonic intestinal development in mouse. (A) From
E8.0 to E9.5, the primitive gut tube is formed. At E10.5, the epithelial endoderm is pseudostratified (B) and after morphological changes occurred will give rise to a stratified epithelium (C). (D) Villi begin to emerge around E15.0 and are fully developed by E16.5. (E) By E18.5, the intestine has its adult morphology and the proliferative cells (green) only exist at the bottom of the crypts (F). Image adapted from Spence et al. (2011)2. ... 5
Figure 1. 5. Stem cells of the small intestine. There are two stem cell populations reported in the
literature - +4 cells and Crypt Base Columnar (CBC) cells. The genetic markers of each population are also portrayed. Image adapted from Sancho et al. (2015)19. ... 7
Figure 1. 6. Composition of the SC niche. Several molecular stimuli and cellular components take part
in the maintenance of the SC niche – a complex and heterotypic dynamic structure. Image from Lane et
al. (2014)47. ... 10
Figure 1. 7. Representation of the ISC niche. In the small intestine, Paneth cells support ISC through
the segregation of Wnt3, epidermal growth factors (EGF) and Notch. Other cells types surrounding the stem cells also play a role in the maintenance of the niche. Image adapted from Lane et al. (2014)47. 11
Figure 1. 8. Signalling pathways involved in the maintenance of intestinal homeostasis and their gradients of expression along the crypt-villi axis. Image adapted from Krausova and Korinek (2014)5.
... 13
Figure 1. 9. Schematic representation of the canonical Wnt/β-catenin pathway. In the absence of
the Wnt ligands Fzd and LRP5/6, β-catenin is degraded and the Wnt target genes are not expressed (a). When the canonical pathway is activated, β-catenin acumulates in the cytoplasm and, once in the nucleus, it binds to TCF/LEF to promote the expression of Wnt target genes (b)56. Image from van der
xii
Figure 1. 10. Representation of the BMP pathway. The signal transduction initiates when BMP binds
to type I or II serine/threonine kinase receptors. This association will result in the phosphorylation of R-SMADS (R-SMADS1, 5 and 8), that will associate with SMAD4. This complex will then translocate to the nucleus, where it further associates with coactivators or corepressors to regulate gene expression. Regulation of gene expression can also be achieved through non-canonical pathways, such as MAPK cascade. BMP signalling is modulated intracellularly (e.g., microRNAs, phosphatases and I-SMADS), extracellularly (e.g., Noggin) and also by co-receptors in the plasma membrane (e.g., Endoglin). Image adapted from Wang et al. (2014)68. ... 16
Figure 1. 11. Notch signalling pathway. Notch signalling is activated by three sequential cleavages:
S2 is catalysed by the ADAM-family of metalloproteases and the S3/S4 by γ-secretase. Upon NEXT processing, NICD will translocate intro the nucleus and Nβ, a small peptide, is released74,79. Image
adapted from Schweisguth (2004)79. ... 18
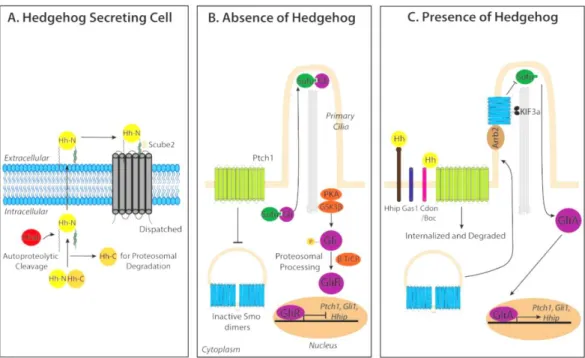
Figure 1. 12. Hh signalling pathway. The precursor of the active Hh protein undergoes some
modifications until its active form is secreted with the help of proteins Disp and Scube2 (A). In the absence of Hh ligand, Ptch catalytically inhibits the activity of Smo (B). Ptch is degraded once Hh binds to it and, as a consequence, Smo is activated and the Hh signal is tranduced to the cytoplasm, allowing the transcription of Hh target genes (C)87. Image from Cochrane et al. (2015)85. ... 19
Figure 1. 13. Schematic representation of the DT entry into cells. After DT-B (yellow) binds to the
HB-EGF precursor (1), the toxin is internalized into early endosomal vesicles (2). Later, and due to the acidic conditions of the late endosome, DT-A (red) is translocated to the cytosol where it catalyses the transference of the ADP-ribose moiety of nicotinamide adenine dinucleotide (NAD+) to a modified histidine residue on polypeptide chain elongation factor 2 (EF-2), inactivating it (3)99. Image adapted
from Murphy (2011)103. ... 23
Figure 1. 14. Schematization of the DT-mediated cell ablation. Transgenic mice carry the gene that
encodes the DT receptor preceded by a STOP cassette flanked by two loxP sites. Upon Tamoxifen administration, the STOP cassette is removed and the target cells start to express the receptor, making them sensible to the DT. ... 24
Figure 1. 15. Structure of HB-EGF protein. The mature form of HB-EGF (sHB-EGF) consists of a
propeptide, a heparin binding domain and an EGF-like domain. sHB-EGF is generated by proteolytic processing at the juxtamembrane domain (red arrow). The N-terminal propeptide is also processed (black arrow), but the biological significance of this processing is not clear. Numbers in the figure indicate amino acid residues from the N-terminus. Image from Iwamoto et al. (2006)114. ... 25
Figure 4. 1. Mouse embryo at E14.5 (A) and its internal organs (B). The internal organs dissected
included lungs (lu), liver (l), small intestine (si), stomach (st), as well as heart (h), large intestine (li), appendix (a) and kidney (not visible in the picture). Scale bars correspond to 2 mm. Pictures taken in Leica MF205 FA microscope. ... 44
xiii
Figure 4. 2. Western Blot analysis of HprtCreiDTR mice liver protein lysates targeting for HB-EGF
on a 15% acrylamide SDS-PAGE transferred to a PVDF membrane. Samples were blotted with
primary antibody Goat anti-Hbegf (1:2000) and secondary antibody Donkey anti-Goat IgG-HRP (1:3000). Lysates from negative and positive DT receptor mice are shown as iDTR- and iDTR+,
respectively. L corresponds to the ladder Color Prestaned Protein Standard, Broad Range (11-245 kDa) from New England BioLab® Inc. ... 46
Figure 4. 3. Genotyping results of HprtCreiDTR embryos treated with DT, for Hprt-Cre wt (200
bp), iDTR wt (650 bp), Hprt-Cre mut (120 bp) and iDTR mut (450 bp), on a 2% agarose gel in 1x TAE stained with ethidium bromide (EtBr). (-) and (+) are the negative and positive controls of the
PCR reaction. wt – wildtype. mut – mutant. L corresponds to the ladder GeneRuler 1Kb Plus DNA Ladder. ... 47
Figure 4. 4. Immunostaining against HB-EGF in 10 µm cryosections from HprtCreiDTR mouse
embryos. HB-EGF (magenta) and DAPI (blue) stainings are presented in the first and second columns
(from left to right), respectively. Bright-field (BF) images are shown in the third column and merge of all the pictures on the last one. Scale bars correspond to 10 µm. ... 49
Figure 4. 5. Immunostaining against γH2AX in 10 µm cryosections from HprtCreiDTR mouse
embryos. γH2AX (green) and DAPI (blue) stainings are presented in the first and second columns (from
left to right), respectively. The white arrow indicates the apoptotic sites. Bright-field (BF) images are shown in the third column and merge of all the pictures on the last one. Scale bars correspond to 10 µm. ... 50
Figure 4. 6. Histology of small intestine and lungs from mouse embryos at E16.5 non-treated with DT. 10 µm cryosections were stained with hematoxylin and eosin. Embryo DT receptor negative (iDTR
-) is shown on the left panel and the positive (iDTR+) on the right. Images A-D and G-J show the small
intestine; E-F and K-L show the lungs. At this stage, the small intestine presents a more complex structure: e – epithelium, iv – inter-villus region, l – lumen, m – mesenchyme, v - villi. Scale bars on A, C, E, G, I and K are 100 µm; on B, D, F, H, J and L are 50 µm. ... 51
Figure 4. 7. Histology of small intestine and lungs from HprtCreiDTR mouse embryos at E14.5
treated with DT. 10 µm cryosections were stained with hematoxylin and eosin. Embryo DT receptor
negative (iDTR-) is shown on the left panel and the positive (iDTR+) on the right. Images A-D and G-J
show the small intestine; E-F and K-L show the lungs. At this stage, the small intestine presents a more complex structure: e – epithelium, l – lumen, m – mesenchyme. Black arrows indicate the detachment between the epithelium and the mesenchyme. Scale bars on A, C, E, G, I and K are 100 µm; on B, D, F, H, J and L are 50 µm. ... 52
Figure 4. 8. Histology detail of small intestine from HprtCreiDTR mouse embryos at E14.5 treated
with DT. Black arrows indicate what could be white blood cells. B is the augmentation of the zone
inside the box in A. Scale bars are 200 µm and 100 µm in A and B, respectively. ... 53
Figure 4. 9. Immunostaining against HB-EGF in 10 µm sections from Id2CreiDTR mouse embryos
at E14.5, embedded in paraffin. Expression of the DT receptor in the different sections of the
embryonic small intestine – anterior and posterior – is shown. Female mouse was treated with TAM at E11.5 and DT at E13.5. Bright-field (BF) images are shown in second column and the merge of all the pictures in the last one. Scale bars correspond to 10 µm. ... 54
xiv
Figure 4. 10. Immunostaining against γH2AX in 10 µm sections from Id2CreiDTR mouse embryos
at E14.5 embedded in paraffin. Female mouse was treated with TAM at E11.5 and DT at 13.5.
Bright-field (BF) images are shown in second column and the merge of all the pictures in the last one. Scale bars correspond to 10 µm. ... 55
Figure 4. 11. Histology of small intestine and lungs in 10 µm sections from Id2CreiDTR mouse
embryos at E14.5, treated and not treated with DT, embedded in paraffin. Sections were stained
with hematoxylin and eosin. Female mouse was treated with TAM at E11.5 and DT at 13.5. Scale bars correspond to 50 µm. ... 56
Figure 4. 12. Immunostaining against HB-EGF in 10 µm sections from Id2CreiDTR mouse embryos
at E15.5 embedded in paraffin. Female mouse was treated with TAM at E8.5 and DT at E13.5. A and
B are an overview of the embryonic small intestine section. The remaining pictures present the anterior portion of the embryonic small intestine. Bright-field (BF) images are shown in second column and the merge of all the pictures in the last one. a – anterior. p – posterior. Scale bars correspond to 50 µm in A and E, and 20 µm in the remaining pictures. ... 57
Figure 4. 13. Immunostaining against γH2AX in 10 µm sections from Id2CreiDTR mouse embryos
at E15.5 embedded in paraffin. Female mouse was treated with TAM at E8.5 and DT at E13.5. The
white arrow indicates the apoptotic zone. Bright-field (BF) images are shown in second column and the merge of all the pictures in the last one. Scale bars correspond to 10 µm. ... 58
Figure 4. 14. Comparison between the histology of small intestine in 10 µm cryosections from (A-B) HprtCreiDTR mouse embryos at E14.5 and (C-D) Id2CreiDTR mouse embryos at E15.5
embedded in paraffin, treated with DT. (A-B) Female mouse was treated with TAM at E11.5 and DT
at E13.5. (C-D) Female mouse was treated with TAM at E8.5 and DT at E13.5. Posterior (A) and anterior portions (B and D) of embryonic the small intestine are portrayed. Both portions are presented in C. Prominent characteristics, such as areas of detachment and lumen enlargement, are indicated by the black arrows. Scale bars correspond to 50 µm in A and B, 200 µm in C and 100 µm in D. ... 58
Figure 4. 15. Immunostaining against HB-EGF and γH2AX in 10 µm cryosections from Id2CredsRed+/-Lgr5GFPiDTR mouse embryos, treated with DT, at E13.5. Female mouse was treated
with TAM at E8.5 and DT at E12.5. (A to H) Immunostaining against HB-EGF. (I to P) Immunostaining against γH2AX. Apoptotic sites are indicated by the white arrows. Bright-field (BF) images are shown in the third column and merge of all the pictures on the last one. Scale bars correspond to 10 µm. .... 60
Figure 4. 16. Red fluorescence detected in lungs from Id2CredsRed+/-Lgr5GFPiDTR mouse embryos,
treated with DT, at E14.5. Pictures show lungs from an embryo negative (A-C) and positive (D-F) for
dsRed. BF – bright field. Pictures taken in a Leica IL LED microscope. Scale bar corresponds to 10 µm. ... 61
Figure 4. 17. Genotyping results of Id2CredsRed+/-iDTR embryos treated with DT, for iDTR mut
(450 bp), Id2 mut (650 bp) and dsRed (190 bp), on a 2% agarose gel in 1x TAE stained with EtBr.
(-) and (+) are the negative and positive controls of the PCR reaction. mut – mutant. L corresponds to the ladder GeneRuler 1Kb Plus DNA Ladder. ... 62
xv
Figure 4. 18. Strategy used in the isolation of epithelial intestinal cells. Cells were co-stained with
DAPI in order to discriminate between living and dead cells (A). Duplets were discarded and only single cells were taken for further analysis (B). Through EpCam staining, single cells were divided into epithelial cells (EpCam+, right gate) and mesenchymal cells (EpCam-, left gate) (C). Finally, EpCam+
cells were sorted for red fluorescence. Non-red (P3), red (P6) and high-red EpCam+ cells (P5) (D). .. 63
Figure 4. 19. Red epithelial cells from embryonic small intestine sorted at E13.5. (A) Id2+iDTR
-dsRed+ embryo. (B) Id2+dsRed+iDTR+ embryo. P3 – Non-red epithelial cells. P4 – Red epithelial cells.
P5 – High-red epithelial cells. ... 63
Figure 4. 20. Genotyping results of Id2CredsRed+/-iDTR embryos treated with DT, for iDTR wt
(650 bp), iDTR mut (450 bp) and Id2 mut (650 bp), on a 2% agarose gel in 1x TAE stained with EtBr. Embryos 1 to 7 were dead inside the mother’s womb at the time of the collection. (-) and (+) are
the negative and positive controls of the PCR reaction. wt – wildtype. mut – mutant. L corresponds to the ladder GeneRuler 1Kb Plus DNA Ladder. ... 64
Figure 4. 21: Red epithelial cells from embryonic small intestine sorted at E14.5. (A) Id2-iDTR
-dsRed- embryo. (B) Id2+dsRed+iDTR- embryo. P3 – Non-red epithelial cells. P4 – Red epithelial cells.
P5 – High-red epithelial cells. ... 65
Figure 4. 22. Genotyping of Id2CredsRed+/-Lgr5GFPiDTR embryos treated with DT, for dsRed
(190bp), Id2 mut (650 bp) and iDTR mut (450 bp), on a 2% agarose gel in 1x TAE stained with EtBr. (-) and (+) are the negative and positive controls of the PCR reaction. mut – mutant. L corresponds
to the ladder GeneRuler 1Kb Plus DNA Ladder. ... 66
Figure 4. 23. Sorted red epithelial cells from small intestine of mouse embryos at E16.5. (A) Id2
-iDTR-dsRed- embryo (triple negative). (B) and (C) Id2+dsRed-iDTR+ embryo (double positive). P3 –
Non-red epithelial cells. Red – Red epithelial cells. P5 – High-red epithelial cells. ... 66
Figure 4. 24. Sorted green epithelial cells from small intestine of mouse embryos at E16.5. (A) Cells
from gate P9, non-red epithelial cells, were sorted and analysed for green fluorescence (GFP). (B) Lgr5
-embryo. (C) Id2+Lgr5+iDTR+. (D) Id2+Lgr5+iDTR- embryo. ... 67
Figure 4. 25. Green cell percentage in Lgr5 positive mouse embryos collected at E16.5 obtained by FACS analysis of different sections – anterior and posterior – of the small intestine. ... 68 Figure 4. 26. Genotyping of Id2CredsRed+/+Lgr5GFPiDTR embryos treated with DT, for Id2 wt (370
bp), Id2 mut (650 bp) and iDTR mut (450 bp), on a 2% agarose gel in 1x TAE stained with EtBr.
(-) and (+) are the negative and positive controls of the PCR reaction. wt – wildtype. mut – mutant. L corresponds to the ladder GeneRuler 1Kb Plus DNA Ladder. ... 69
Figure 4. 27. Red Id2+ cells percentage in mouse embryos collected at E15.5 obtained by FACS
analysis of different sections – anterior and posterior – of the small intestine. ... 70 Figure 4. 28. Green cell percentage in Lgr5 positive mouse embryos collected at E15.5 obtained by FACS analysis of different sections – anterior and posterior – of the small intestine. ... 71
xvi
Figure 4. 29. Genotyping of Id2CredsRed+/+Lgr5GFPiDTR embryos treated with DT, for Id2 wt (370
bp), Id2 mut (650 bp) and iDTR mut (450 bp), on a 2% agarose gel in 1x TAE stained with EtBr.
(-) and (+) are the negative and positive controls of the PCR reaction. wt – wildtype. mut – mutant. L corresponds to the ladder GeneRuler 1Kb Plus DNA Ladder. ... 72
Figure 4. 30. Red Id2+ cells percentage in mouse embryos collected at E16.5 obtained by FACS
analysis of different sections – anterior and posterior – of the small intestine. ... 72 Figure 4. 31. Green cell percentage in Lgr5 positive mouse embryos collected at E16.5 obtained by FACS analysis of different sections – anterior and posterior – of the small intestine. Embryo 3
is indicated with (*) because genotyping was inconclusive. ... 73
Figure 4. 32. Gene expression analysis of Id2 and PUMA in high-red intestinal epithelial cells collected at E13.5. Results are shown as mean ± SEM, with N=3. Statistical significance was evaluated
with Student's t test. *** corresponds to p<0.0001. ... 75
Figure 4. 33. Gene expression analysis of (A) Lgr5, Ascl2, Wnt11, Wtn6, Sfrp5, Rspo1, Snai2, Smoc2, (B) Id1, Id3, Kcnq1, TBP, Kcne3, St8sia3, Slc2a3, OneCut and Rspo3 in high-red intestinal epithelial cells collected at E13.5. Results are shown as mean ± SEM, with N=3. Statistical significance was
evaluated with Student's t test. ** corresponds to p<0.001 and *** to p<0.0001. ... 76
Figure 4. 34. Gene expression analysis of Id2 and PUMA in non-red intestinal epithelial cells collected at E13.5. Results are shown as mean ± SEM, with N=3. Statistical significance was evaluated
with Student's t test. *** corresponds to p<0.0001. ... 79
Figure 4. 35. Gene expression analysis of (A) Lgr5, Ascl2, Wnt11, Wtn6, Sfrp5, Rspo1, Snai2, Smoc2, (B) Id1, Id3, Kcnq1, TBP, Kcne3, St8sia3, Slc2a3, OneCut and Rspo3 in non-red intestinal epithelial cells collected at E13.5. Results are shown as mean ± SEM, with N=3. Statistical significance was
xvii
vi. LIST OF TABLES
Table 3. 1. Sequences of the specific primers for genotyping, forward (Fw) and reverse (Rv), used in the amplification of gene fragments, as well as the length of the PCR product. ... 32 Table 3. 2. PCR cycling conditions for amplification of Hprt-Cre wt and mut. ... 33 Table 3. 3. PCR cycling conditions for amplification of iDTR wt. ... 33 Table 3. 4. PCR cycling conditions for amplication of iDTR mut. ... 33 Table 3. 5. PCR cycling conditions for amplification of Id2. ... 33 Table 3. 6. PCR cycling conditions for amplification of dsRed. ... 34 Table 3. 7. Reaction mix used in amplification of interest fragments by PCR. Primers were the ones
described in table 2.1. (Sigma Aldrich), 10x Thermo Pol® Reaction Buffer was from New England BioLabs® Inc., GeneAmp dNTP Blend (100 mM) from Life Technologies™, Taq Polymerase was homemade (Institute of Molecular Biologx, Germany) and gDNA was obtained from the ears of adult mice and limbs/tail of mouse embryos. ... 34
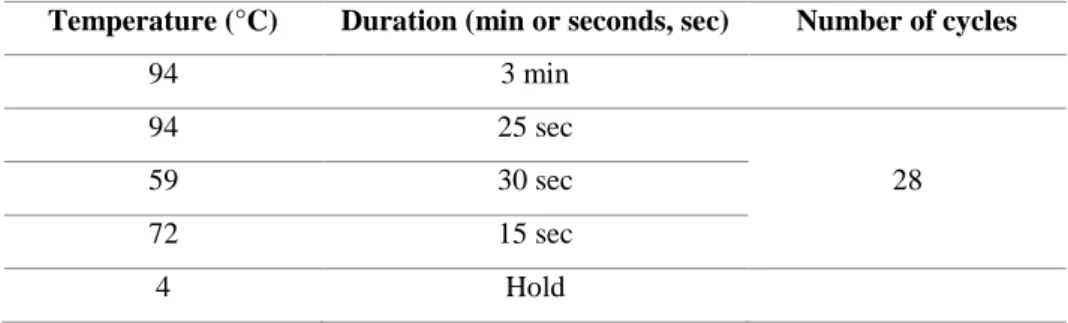
Table 3. 8. Composition of the blocking solutions for each one of the target proteins - EpCam, HB-EGF and H2AX. ... 36 Table 3. 9. Composition of the primary and second antibody solutions used in the detection of the target proteins EpCAM, HB-EGF and H2AX. ... 37 Table 3. 10. Composition of 10x Reaction Buffer. ... 39 Table 3. 11. Guidelines for sample preparation. ... 39 Table 3. 12. Master Mix solution composition used for first-strand cDNA synthesis. ... 39 Table 3. 13. Conditions used in first-strand cDNA synthesis. ... 40 Table 3. 14. Composition of the Master Mix solution used for cDNA amplification. ... 40 Table 3. 15. Conditions used in cDNA amplification. ... 41 Table 3. 16. Specific primer sequences of the genes analysed by qPCR and corresponding annealing temperatures. ... 41 Table 3. 17. Master Mix used in genetic analysis by qPCR. Primers are the ones described in table
3.13 (Sigma Aldrich) and 2x SYBR® Master Mix is from Life Technologies GmbH. ... 43
Table 3. 18. Amplification conditions used for qPCR reactions. ... 43 Table 4. 1. Time points between TAM administration, DT injection and mouse dissection in HprtCre x iDTR crossings done along this project. ... 45
1
1. INTRODUCTION
1.1. Small intestine
The small intestine is a highly organized organ that, among other functions, serves mainly for absorptive and immunological purposes1,2. In mammals, the small intestine is the most proliferative and self-renewing structure and its epithelium is renovated every 4 to 5 days3,4,5.
Starting in gastrulation and endoderm specification, this complex tissue undergoes a series of changes until it reaches its final form after the birth2.
1.1.1. Adult small intestine
The adult intestinal tract can be described as a tube composed of three different layers – mucosa, submucosa and muscularis mucosa (Figure 1.1). Together, the epithelium, the lamina propria and the muscular mucosa constitute the mucosa – structurally and functionally, the intestine’s most complex layer -, which is supported by the submucosa, a layer of connective tissue6,7. The submucosa is rich in inflammatory cells, nerve fibres, arteries and small venous channels, while the muscularis mucosa, in association with the enteric nervous system8, is responsible for the intestine’s peristaltic movements6.
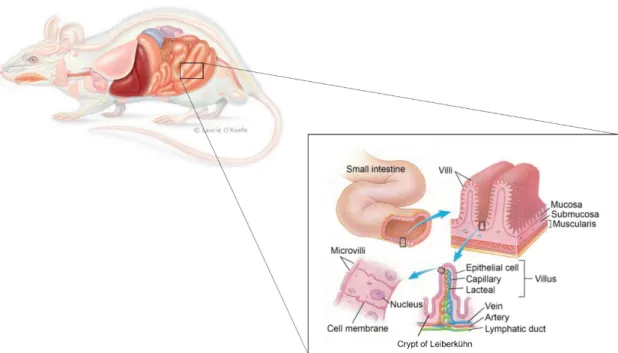
Figure 1. 1. Structure of the adult small intestine in mammals. The tubular small intestine is formed by 3 main layers of different tissues – the mucosa, the submucosa and the muscularis mucosa. These structures are oriented circumferentially around the lumen. In the mucosa, and facing the lumen, are the villi – responsible for making the small intestine the biggest surface in the body. Mouse image by ©Laurie O’Keefe (2007)9.
2
The lumen, the innermost layer of the small intestine, consists of a tubular structure, in which the digested nutrients pass through, and has a very distinct morphology. It possesses finger-like protrusions, the villi8 - due to which intestine’s surface area is dramatically enlarged1,10 -, surrounded by multiple invaginations called crypts of Lieberkühn8 (Figure 1.1). Together with its characteristic morphology, the cells that populate the lumen is what allows the intestinal epithelium to carry out its function.
As the intestinal epithelial cells surround all the lumen, there are three main types of cells covering the villi – enterocytes, Goblet cells and enteroendocrine cells1,11 (Figure 1.2). While the first carries out absorptive functions, the remaining are classified as secretory cells2,12.
Figure 1. 2. Differentiated cells in the small intestine's epithelium. Absorptive cells are polarized and have a basal nucleus while enteroendocrine cells have neurosecretory granules. A prominent feature of Goblet and Paneth cells is their secretory granules13 (shown in green). Image adapted from Crosnier et al. (2006)12.
Enterocytes constitute more than 80% of the epithelial cells, but are mainly present at the proximal end of the small intestine. Absorptive cells, although mainly responsible for the absorption and transport of nutrients across the epithelium, also release hydrolytic enzymes1,8. These cells have a columnar shape, a basal nucleus and possess apical microvilli (as shown in
Figure 1.2), increasing their absorptive surface13. Goblet cells secret mucus and are found mainly at the distal end of the small intestine and in colon, where they are more needed given their lubricating role8. These cells are characterized by mucigen granules in their cytoplasm that will secrete mucins and other proteins. The granule contents are important for the movement
3
and expulsion of gut contents, as well for providing protection against shear stress and chemical damage1. Lastly, enteroendocrine cells, as the name suggests, are responsible for hormonal release and constitute a minor cell population (around 1%)1,8,11. These cells are distributed along the intestinal mucosa as intestinal cells and the hormones they secrete, such as serotonin, play an important role in the control of the gut physiological conditions1,8,14.
Another secretory cell type found in the intestinal epithelium are Paneth cells. These cells are rich in cytoplasmic granules that, once secreted, release substances vital to the maintenance of the intestine’s physiology. Among these are lysozymes, antimicrobials and defensins, which emphasises the role of Paneth cells in innate immunity and host-microbe interactions1,8,15. Paneth cells differ from the other differentiated cells mentioned above due to having a higher life span – they last up to 6 weeks while the others survive for only 4 or 5 days16,15 –, and for being found at the base of the Lieberkühn crypts1,8.
Due to the harsh conditions the intestinal epithelium is continuously exposed to, there is a need for a rapid self-renewal of the epithelial cells. This process is coordinated by the proliferative compartment found in the Lieberkühn crypts. Here, besides Paneth cells, two cell populations can be found – intestinal stem cells (ISC) and transit amplifying (TA) cells7,16 –, the latter giving rise to 250 new epithelial cells per day17,18. These new epithelial cells migrate upwards – from the bottom of the crypt until the top of the villus – and undergo differentiation until they reach the crypt-villus junction17,18. At this point, the completely differentiated cells continue to travel upward the villi. In order to keep the balance in the number of epithelial cells, the older cells undergo apoptosis and are exfoliated at the tip of the villus, as the newly differentiated cells migrate from the crypt to substitute them. The exception are the Paneth cells, that migrate downwards and establish themselves at the bottom of the crypts1,8, 13,15,16.
4
Figure 1. 3. Localization of the different cell populations in the crypt-villus axis of mouse small intestine epithelium. The crypt-villus axis is divided into two compartments: a proliferative and monoclonal one, maintained by stem cells – the crypts –, and a differentiated and polyclonal one – the villus13. Image from Sancho et al. (2015)19.
Until it reaches the morphological structure presented in Figure 1.3, the small intestine undergoes a series of changes along its differentiation process from the embryonic endoderm2.
1.1.2. Small intestine in embryos
Once all the germ layers – endoderm, mesoderm and ectoderm – are established in the early vertebrate embryo, the primitive gut tube is formed as a consequence of the series of morphogenic changes occurring in the endoderm2,20,21.
The formation of primitive gut starts with the endoderm closure at the anterior and posterior intestinal portals, progressing towards the middle of the embryo where they will meet and form a closed tube around embryonic day (E) 8.0 and E9.02,20,22 (Figure 1.4). As the gut tube forms, the epithelium undergoes a patterning process along the anterior-posterior axis that gives rise to the foregut at the anterior region, and to the midgut and hindgut at the posterior region of the tube7,20. The foregut will give rise to esophagus, lungs, thyroid, liver, pancreas and stomach, while the midgut and hindgut will differentiate into the small and large intestine,
5
respectively2,20. At E9.5, the simple epithelium condenses into a pseudostratified epithelium and, from this stage until E13.5, as the tube lengthens to the size of the embryo, the mesenchyme and the lumen also increase their size20,21,23.
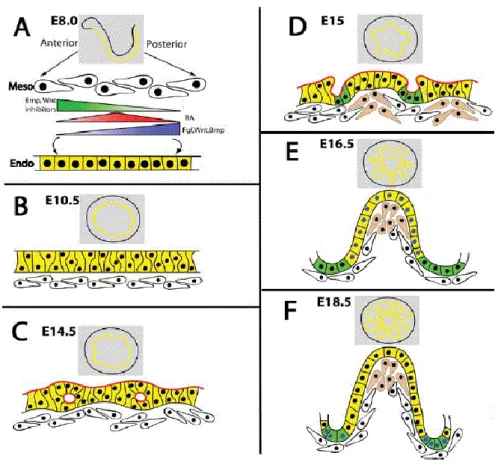
Figure 1. 4. Schematic representation of embryonic intestinal development in mouse. (A) From E8.0 to E9.5, the primitive gut tube is formed. At E10.5, the epithelial endoderm is pseudostratified (B) and after morphological changes occurred will give rise to a stratified epithelium (C). (D) Villi begin to emerge around E15.0 and are fully developed by E16.5. (E) By E18.5, the intestine has its adult morphology and the proliferative cells (green) only exist at the bottom of the crypts (F). Image adapted from Spence et al. (2011)2.
With the gut tube formed, the epithelium is reorganized at E14.5. The pseudostratified epithelium undergoes morphologic changes – it changes from a tightly packed simple epithelium with nuclei at several levels to a stratified one with nuclei at the basal level2,21. At the same developmental day (E14.5), villi start to form due to the invagination of mesenchyme into the epithelium7. Both processes – villus emergence and epithelial restructuring take place in a proximal-to-distal manner20,21.
6
As the villi emerges, proliferation increases at the base of the villi and becomes progressively less abundant on the villus epithelium2,7,21. By E17.0, proliferating cells become confined to the crypts of Lieberkühn2,21. Stem cells are also present in the intervillus region and, together with the proliferative cells, they will be responsible for the maintenance of the adult small intestine21.
1.2. Stem cells
In the small intestine, homeostasis is maintained through the activity of a minor population of long-lived resident stem cells 4,5,8,24, together with the balance between stem cell proliferation and renewal with differentiation25.
In general, stem cells (SC) are present in an organism through the embryonic stage and adult life and are characterized by two major properties – their self-renewal capacity and the ability to generate all the cell types of the organ where they reside26.
During the embryonic development, cells of the inner cell mass of the blastocyst will give rise to all the three germ layers – endoderm, ectoderm and mesoderm. Embryonic stem cells (ESC) can be derived from the inner cell mass and retain the capacity to differentiate into all cells of the adult organism, i.e. they are pluripotent. On the other hand, adult stem cells are multipotent, since they can only self-renew and differentiate into the different cells of the specific tissue from which they were isolated16.
1.2.1. Stem cells in adult small intestine
As mentioned in section 1.1.1, there are two cell populations in the intestine’s crypt – ISC and TA cells –, which, together with Paneth cells, are responsible for the renewal of the intestinal epithelium, thus keeping homeostasis. ISC are confined to the bottom of the crypts (Figure 1.5) – where approximately six individual cells are present –, and are responsible to fuel the cells for epithelial renewal and are the only source of cells for the renewal of the epithelium, so its population should be kept constant1,13.
Currently, there are two models that hypothesise how the ISC population is maintained – the Deterministic and the Stochastic model. The Deterministic model states that individual stem cells divide asymmetrically, i.e., they give rise to one stem cell, that will be kept at the bottom of the crypt, while the other cell will become a TA cell and migrate to the proliferative zone, where it will undergo proliferation cycles every 12-16 h7,13. While this model describes few stem cells at the niche, the Stochastic model, on the other hand, suggests that many stem
7
cells reside at the bottom of the crypt and that, as they divide symmetrically, stem cells produce either two stem cells (meaning no TA cells), one stem cell and one TA cell or two TA cells (meaning no daughter stem cell), which leads to an unbalance between the descendants of each stem cell lineage over time13,27. The Stochastic Model is also known as Niche model, as it suggests the existence of an environment at the bottom of the crypt – termed niche – that determines the “stemness” of the cells through the action of intracellular factors13.
Figure 1. 5. Stem cells of the small intestine. There are two stem cell populations reported in the literature - +4 cells and Crypt Base Columnar (CBC) cells. The genetic markers of each population are also portrayed. Image adapted from Sancho et al. (2015)19.
Two stem cell populations exist in the small intestine (Figure 1.5) – Crypt Base Columnar (CBC) cells and +4 label retaining cells (LRC) –, but their specific location within the crypt is not well known. It has been proposed that either they are located just above Paneth cells or within the fourth and fifth cells from the bottom of the crypt28. Currently, there are two models that describe these stem cell populations – the Classic model and the Stem Cell Zone model. The first one is based on the findings of Cairns et al. (1975) and Potten et al. (1974) and the second one in the work developed by Cheng and Leblond (1974)29.
In 1974, Cheng and Leblond proposed that a small population of undifferentiated elongated cells located amongst Paneth cells and near the base of crypt were the cells from which all the differentiated cell types in the intestine would derive from30. This conclusion came after they discovered that crypts were not populated only by Paneth cell but also by actively dividing columnar cells, while doing electronic microscopy studies31,32. These cells - slender, immature and cycling – were called CBC cells and it was also found that they are sensitive to
8
tritiated thymidine ([3H]dT) exposure30,31. The authors also reported that the surviving CBC cells would phagocyte surrounding damaged cells after [3H]dT exposure. These radioactive phagosomes were initially present only in occasional CBC cells, but were latter detected within differentiated cells belonging to the four cell lineages in the intestine18,30,31,33. These findings were interpreted as a proof of CBC cell’s stemness.
Moreover, the CBC stem cell model suggests that these stem cells have a division cycle of 24h and that their progeny moves to cell position 4-5, where they continue to divide with a daily cycle30.
On the other hand, the Classic Model, proposed by Potten in 1974, states that stem cells reside at position +4 relative to the crypt bottom, immediately above of the highest Paneth cell in the small intestine1,4,30,34,as shown in Figure 1.5. After cell tracking experiments, these authors reported that the cells at +4 position were sensitive to X and γ radiation and had labelling retaining properties - both desirable stem cell characteristics. Sensibility to radiation would prevent genetic abnormalities from being passed on to the progeny cells and the long-term DNA label retention is a result of the asymmetrical segregation of DNA, meaning that while the template DNA strands are retained in the +4 stem cells, the daughter cells inherit a newly synthetized strand8,30,18,35. Also called LRC, +4 cells also have an active proliferative cycle of 24 h, like CBC35.
To note that studies conducted by Potten at the time failed to show that +4 cells can give rise to all the differentiated lineages in the intestinal crypt36. Also, this model is still to validate since 1) some proposed stem cell markers for this population are poorly characterized and 2) some of the already validated ones seem to mark epithelial cell populations with cellular features distinct from the LRC population described by Potten37.
1.2.2. Stem cell markers
Although the localization of the stem cell populations in the intestine is relatively known, their identification and isolation is still a challenge. In order to overcome this, the identification of valid ISC markers is of key importance.
The list of potential ISC markers includes Lgr5, Bmi-1, Mushashi-1, m-Tert, Ascl2, Sox9 and OLFM4, among others8,19,30,31,38. However, with exception of Lgr5 and Bmi-1, none of the other markers have yet been related with cells capable of multi-lineage differentiation30. Therefore, only Lgr5 and Bmi-1 will be discussed.
9
Barker et al. (2007) reported Lgr5 (Leucine-rich-repeat-containing G-protein-coupled receptor 5), also known as Gpr49 (G-protein coupled receptor 49), as a marker for CBC cells. Lgr5 is a 7 transmembrane protein that acts as a receptor for antagonists of the Wnt pathway – the R-spondins – and also marks proliferative cells in several other adult tissues4,35,38. In their study, the authors showed that this marker is expressed at the bottom of the intestinal crypts of adult mice and that Lgr5+ cells gave rise to long-lived clones containing all intestinal cell types. With these findings, Lgr5 was then considered the most reliable ISC marker39,40.
On the other hand, Bmi-1 (B cell specific Moloney murine leukemia virus integration site 1) is a polycomb group protein and belongs to a group of transcriptional repressors that controls the development by the regulating of cell growth and differentiation genes28,30,41. The work of Sangiorgi and Capecci (2008) suggested Bmi-1 as a possible marker for +4 cells by showing that this gene consistently marks long-lived cell clones and that the ablation of the 1 cell population eliminates the epithelium of whole crypt units. Also, the location of Bmi-1 single cells was reported to be above Paneth cells, in positions +4 and +5 from the base of the crypt28,40.
With two possible ISC populations, two questions arise: 1) Could Lgr5+ and Bmi-1+ cells be the same population? and 2) Which one corresponds to the genuine stem cell population?
Tian et al. (2011) and Yan et al. (2012) have reported that these markers identify two distinct populations. The first author’s data suggest that Bmi-1+ cells are located upstream of Lgr5+ stem cells and contribute to the replenishment of the pool of active stem cells. Also, when the cells that express Lgr5 are eliminated, the number of Bmi-1+ cells increases - probably to compensate the loss – and, in this conditions, contributes to the generation of all cell types in the intestine until the Lgr5 population has recovered42. Moreover, Yan and colleagues showed that these two stem cell populations are functionally distinct: while Lgr5+ cells have a greater contribution on maintaining the small intestine’s homeostasis, Bmi-1+ cells are quiescent, radioresistant and, upon injury, they rapidly proliferate in order for the epithelium to regenerate4,43. Together, these findings support a model where different ISC populations have separate but cooperative roles within the small intestine.
Lineage tracing experiments conducted by Barker et al. (2007) in Lgr5-EGFP-IRES-creERT2-LacZ mice, in which LacZ expression was induced by tamoxifen (TAM), showed that
10
the number of cells expressing LacZ would increase as more days passed by since the induction. This supported the Lgr5+ cells capability to maintain the epithelium’s self-renewing state. It was also reported the existence of epithelial cells, such as Paneth and Goblet cells, amongst the LacZ-stained clones39. According to these authors and their findings, Lgr5+ CBC cells are the genuine intestinal stem cell population.
1.2.3. Stem cell niche
The stem cell niche hypothesis was proposed in 1978 by Schofield, who described the “niche” as a microenvironment of cells contributing to the stem cell behaviour and allows them to maintain tissue homeostasis. According to this author, the SC niche is characterized by the following properties: it provides an anatomic place to regulate stem cell number, instructs stem cells to self-renew or commit to differentiation and influences their motility13,18,44,45,46 (Figure
1.6).
Figure 1. 6. Composition of the SC niche. Several molecular stimuli and cellular components take part in the
maintenance of the SC niche – a complex and heterotypic dynamic
11
Surrounding the Lieberkühn crypts, where ISC reside together with +4 cells and Paneth cells, the niche is composed by different cell types, such as myofibroblast, endothelial and neural cells, immune cells and smooth muscle cells18,45, among other components (Figure
1.7).
Figure 1. 7. Representation of the ISC niche. In the small intestine, Paneth cells support ISC through the segregation of Wnt3, epidermal growth factors (EGF) and Notch. Other cells types surrounding the stem cells also play a role in the maintenance of the niche. Image adapted from Lane et al. (2014)47.
Paneth cells are thought to be a key component of the ISC niche, given the proximity with CBC stem cells18 (Figure 1.7). Several genetic ablation and knockout studies confirmed these findings, such as the work of Sato et al. (2011). After the ablation of the majority of Paneth cells, these authors reported a reduction in the CBC population and also a proportional reduction in the same stem cell pool when partial ablation of Paneth cells was achieved. The remaining stem cells were always found contiguously to the remaining Paneth cells48. However, studies also showed that Paneth cells are only essential for the small intestine’s homeostasis in vitro but not in vivo. This is supported by the studies of Kim et al. (2012), where CBC cells maintained their normal function when Paneth cells were completely ablated. Durand et al. (2012) confirmed these findings but also reported that Math1-deficient crypts required exogenous Wnt when grown in organoid culture. Together, this results point to a redundancy between Paneth cell and the stromal environment that surrounds the epithelium18.
Located beneath the intestinal crypts, stromal cells and myofibroblast support ISC during morphogenesis, differentiation and proliferation. Studies showed that these cells express
12
endogenous R-spondin 3 (Rspo3) – a Wnt agonist – supporting the formation of the intestinal epithelium through the Wnt signalling pathway45.
Another key regulator of the intestinal epithelial growth are neural cells, namely the enteric neurons. These neurons express the glucagon-like peptide (GLP)-2 receptor. GLP-2 production by a subset of enteroendocrine cells – the L cells – stimulates the proliferation of enterocytes45,49. The L cells can also function as a nutrient sensor49.
Moreover, mesenchymal cells expressing Foxl1 are also reported to play a role in the niche. Aoki et al. (2011) showed that these cells express high levels of Rspo3 and fibroblast growth factor 2, as well as antagonists of the Bone Morphogenetic Protein (BMP) pathway. Through the ablation of Foxl1-expressing mesenchymal cells, authors reported epithelium disruption, an effect in the stem cell population by the reduction of expression of the stem cell marker Olfm4 and a reduction in Wnt signalling50.
The maintenance of the proliferative character in the crypt, where ISC are located, and the different cell fates along the crypt-villi axis are regulated by several signalling pathways.
1.3. Cell differentiation and proliferation in the small intestine
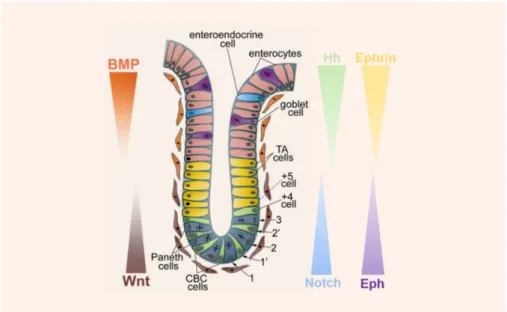
The intestinal homeostasis, maintained by the balance between cell proliferation and differentiation, is assured by a complex network of signalling pathways, such as Wnt, BMP, Notch, Hedgehog (Hh) and Eph/Ephrin (Figure 1.8).
13
Figure 1. 8. Signalling pathways involved in the maintenance of intestinal homeostasis and their gradients of expression along the crypt-villi axis. Image adapted from Krausova and Korinek (2014)5.
1.3.1. Wnt/β-catenin pathway
The Wnt signalling pathway is the main responsible for the proliferation of the small intestine’s epithelium, and also plays a role in processes such as cell differentiation and migration, among others1,5,51,52,53. This signalling is ensured by 19 secreted glycoproteins of the Wnt family and its receptors – the Frizzled (Fzd) protein family, which comprises 10 members in human and mouse. The Wnt family is highly conserved through the animal kingdom and all the proteins, generally with 45 kilodalton (kDa), share conserved features essential for their function1,30,51,52,54,55.
There are two major branches of the Wnt pathway – the canonical and the non-canonical -, being the first dependent of β-catenin, while the second is not52.
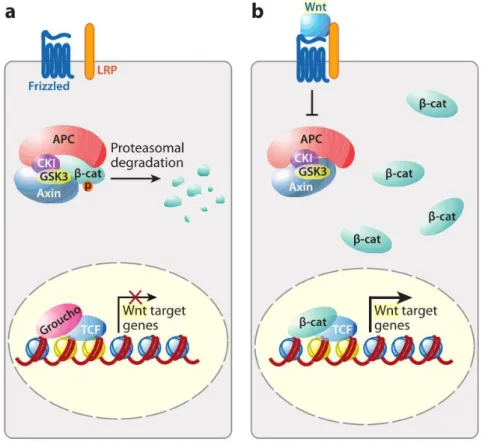
The canonical Wnt pathway (Figure 1.9) activation occurs when a Wnt ligand binds to the complex formed by the seven-transmembrane Fzd receptor and its co-receptor LDL-related receptor protein (LRP) 5/652,55,56,57,58. In the absence of pathway activation, β-catenin in the cytoplasm is captured by a destruction complex formed by Axin, Adenomatous Polyposis Coli (APC), Casein Kinase 1 (CK1) and Glycogen Synthase Kinase 3β (GSK3β). CK1 and GSK3β will target β-catenin for ubiquitination and proteasomal degradation through the phosphorylation of its N-terminus, thus preventing the transcription of Wnt target genes. When Wnt binds to its receptors, the intracellular part of LRP is phosphorylated by CK1γ as a consequence of the phosphorylation of Disheveled (Dsh) proteins. Axin is then recruited by
14
this complex and the degradation of β-catenin is avoided, leading to the accumulation of this protein in the cytoplasm. Upon translocation to the nucleus, β-catenin will displace Groucho proteins, transcriptional repressors, and interact with T-cell factor/Lymphoid Enhancer Factor (TCF/LEF), thus inducing the expression of Wnt target genes55,57,58,59.
Figure 1. 9. Schematic representation of the canonical Wnt/β-catenin pathway. In the absence of the Wnt ligands Fzd and LRP5/6, β-catenin is degraded and the Wnt target genes are not expressed (a). When the canonical pathway is activated, β-catenin acumulates in the cytoplasm and, once in the nucleus, it binds to TCF/LEF to promote the expression of Wnt target genes (b)56. Image from van der Flier and Clevers (2009)1.
The non-canonical pathways – Wnt/Planar Cell Polarity (PCP) and Wnt/Ca2+ - are less well known and its activation is independent of LRP5/656.
PCP controls coordinated and uniformly polarized cellular behaviours and is a critical process for many fundamental developmental processes in mammals, such as the neural tube closure and the determination of left-right asymmetry, taking part in the regulation of the actin cytoskeleton, namely the organization of polarized structures and directed migration60,61. Wnt signalling is required in PCP pathway, although its mechanism still remains unknown60.
15
The Wnt/Ca2+ pathway shares some components with the PCP pathway and it’s based on the finding that some Wnt molecules and Fz receptors can stimulate the intracellular release of Ca2+. The calcium’s release and intracellular accumulation will lead to the activation of Ca2+ sensitive proteins, such as protein kinase C (PKC) and calcium/calmodulin-dependent kinase (CamKII). During embryogenesis, this pathway is known to play a role in the negative regulation of dorsal axis formation, promotion of the ventral cell fate and also in heart formation61.
Regarding the adult small intestine, the Wnt/β-catenin pathway functions as the switch between epithelial cells’ differentiation and proliferation, being also essential for the maintenance of the crypt progenitor compartments1. Wnt is secreted by Paneth cells and the surrounding myofibroblasts and is expressed in a gradient along the crypt-villus axis, with a higher expression observed at the bottom of the crypts51,62,63.
There are several Wnt target genes reported in the literature, such as c-Myc, involved in cell proliferation64, Sox9, required for Paneth cells’ differentiation, and Lgr5, involved in the transmission of extracellular signals65. Lgr5 is a receptor for R-spondins – Wnt agonists –, and this two-protein complex can associate with the complex that activates the canonical pathway, amplifying the effect of Wnt/ β-catenin signalling51,52,58,66.
1.3.2. BMP pathway
BMPs are a group of conserved growth factors that form the largest subgroup of the Transforming Growth Factor β (TGFβ) superfamily. These factors are important morphogens that play a key role during embryogenesis and development, taking part in cell growth, apoptosis, differentiation, and also help in the maintenance of tissue homeostasis in adult organisms58,67,68,69. These proteins are synthetized as precursors with 400-500 amino acids (aa) and their structure is highly conserved. Once cleaved, the mature form of the protein (50-100 aa) contains seven cysteine residues. While 6 of these residues form 3 dissulfide bonds, the other cysteine is responsible for another dissulfide bond with a cysteine residue in another BMP, forming a dimer that’s biologically active67,68,69,70.
Similar to Wnt, BMP can also signal through a canonical (SMAD dependent) and non-canonical (SMAD independent) pathway68 (Figure 1.10).
In the canonical pathway, the BMP receptor is a type I/II heterodimer. BMP first binds to the type I receptor and then, by affinity, the type II receptor binds to the complex and GS
16
domain will be phosphorylated by the type II receptor’s constitutive kinase, thus converting the type I receptor into its active form58. Once the BMP complex is activated, it’s the phosphorylation of SMAD proteins that will allow the BMP signalling. Namely, Receptor associated SMAD (R-SMAD) 1, -5 and -8 will be recruited by BMP protein complex, and once phosphorylated forms a complex with Co-SMAD4, allowing the translocation of the complex to the nucleus and the transcription of genes specifically regulated by BMPs58,67,70,71,72.
Figure 1. 10. Representation of the BMP pathway. The signal transduction initiates when BMP binds to type I or II serine/threonine kinase receptors. This association will result in the phosphorylation of R-SMADS (SMADS1, 5 and 8), that will associate with SMAD4. This complex will then translocate to the nucleus, where it further associates with coactivators or corepressors to regulate gene expression. Regulation of gene expression can also be achieved through non-canonical pathways, such as MAPK cascade. BMP signalling is modulated intracellularly (e.g., microRNAs, phosphatases and I-SMADS), extracellularly (e.g., Noggin) and also by co-receptors in the plasma membrane (e.g., Endoglin). Image adapted from Wang et al. (2014)68.
17
SMAD-independent BMP signalling, such as MAPK (p38 Mitogen-Activated Protein Kinase) pathway, is less well known and, once it’s initiated, BMPs are able to play a role on cell survival, apoptosis, migration and differentiation67.
Depending on the pathway that interacts with BMP signalling pathway, the cellular response can change72. The most well studied interaction is with Wnt pathway, which contributes to the proliferation and maintenance of the epithelium in the small intestine, as stated in the previous section. In the small intestine, BMPs - produced by epithelial myofibroblasts - act as a differentiation signal and as an antagonist of Wnt signalling in the crypts, by restricting the nuclear localization of β-catenin58,72,73.
At embryonic stages of mouse development, between E7.5 and E10.5, BMPs and their receptors are widely expressed7. In adult small intestine, BMP expression is stronger in the mesenchyme at the villus tips, while the crypts express BMP antagonists, in order to provide ISC the optimal niche for proliferation (Figure 1.8). This signalling is also needed for the terminal differentiation and maturation of precursors of the secretory lineage36,58,72.
1.3.3. Notch pathway
Notch is a simple signalling pathway involved in several processes in embryonic and adult tissues, such as cell proliferation and differentiation, regulation of stem cell function and establishment of cell boundaries1,19,25,74,75. This pathway acts in a very unique way, given the fact that its receptors are transmembrane proteins. Thus, only the neighbour cells receive the signal – a process called lateral inhibition25,74,76. In mammals, there are 4 Notch receptors – Notch 1-4 –, and 5 Notch ligands, Delta-like (DLL) 1, 3 and 4, and Jagged (JAG) 1 and 225,74,77,78. Both the receptors and the ligands have extracellular domains, in which EGF-like repeats are the main elements.
Notch receptors have an ectodomain termed Notch Extra-Cellular Domain (NECD) and a membrane-tethered intracellular domain (NTM). This heterodimer, which accumulates at the plasma membrane, interacts in a Ca2+ dependent and non-covalent manner79.
In order to activate the Notch signalling, a series of three cleavages are needed. Once Notch is cleaved at the extracellular “S1” site, a process that occurs in the trans-Golgi network, the cell surface receptor becomes functional. Then, a second cleavage, ligand dependent, takes place, now at the “S2” site, giving origin to NEXT (Notch Extracellular Truncation), a