THE USE OF QUALITATIVE INDICATORS FOR PERFORMANCE MEASUREMENT IN MANUFACTURING CONTROL SYSTEMS
Paulo Leitão1 and Francisco Restivo2
1
Polytechnic Institute of Bragança, Quinta Sta Apolónia, Apartado 134, P-5301-857 Bragança, Portugal, [email protected]
2
Faculty of Engineering, University of Porto, Rua Dr. Roberto Frias, P-4200-465 Porto, Portugal, [email protected]
Abstract: New manufacturing control paradigms are being developed to improve the ability of enterprises to respond to change. However, there are no agreed definitions and methodologies for the evaluation and comparison of achievements of different manufacturing control systems approaches, making also difficult the communication and cooperation between manufacturing control systems developers. In this paper some qualitative performance indicators are identified and defined - re-configurability, robustness and agility - and methodologies for their evaluation are suggested.
Copyright © 2003 IFAC
Keywords: Intelligent Manufacturing Systems, Manufacturing Control Systems, Performance Measurement.
1. INTRODUCTION
Enterprises always look for profit, through more productivity, more quality, more flexibility, more agility and better adaptation to unexpected disturbances. In the emerging global economy, where the demand for mass customised products puts new requirements in terms of the ability of enterprises to respond to change, the steady state analysis is becoming less important, while dynamic response is becoming a key issue in the design of new manufacturing systems, with large impact at all levels, both technical and socio-economical.
Several manufacturing control architectures using emergent paradigms and technologies, such as holonic manufacturing systems, have been proposed (see (JASS, 2001) and (Deen, 2003) to know more details about some existing holonic work in the area). One of the holonic architectures proposed is the ADACOR (Adaptive Holonic Control Architecture for Distributed Manufacturing Systems) architecture (Leitão and Restivo, 2002), which addresses the need for the agile and fast reaction to disturbances at the distributed shop floor level, increasing the agility and flexibility of an enterprise, when it works in volatile environments, characterised by the frequent occurrence of unexpected disturbances (more details
about ADACOR architecture can be found in (Leitão and Restivo, 2003; Leitão et al., 2003).
The analysis and evaluation of the dynamic behaviour of manufacturing systems requires the definition of a benchmark methodology to allow the analysis of manufacturing control system properties, the evaluation of its performance, and the comparison between different control approaches. In spite of some research in the area, such as the described in (Cavalieri et. al, 1999) and other within the working group Benchmarking and Performance Measures (SIG4) belonging to the Intelligent Manufacturing Systems – Network of Excellence1, one draw back in the validation of manufacturing control systems is the missing of a standard benchmark framework that allows to compare the dynamic performance of the several control systems.
The traditional performance measurement systems evaluate quantitative indicators directly related to production parameters: throughput, number of delayed orders, WIP, manufacturing lead time, etc. The problem here is how to evaluate the performance of the systems in the presence of unexpected changes.
1
Here, performance indicators may be of a qualitative nature, since they usually reflect subjective views of the behaviour of the systems in those circumstances.
In this paper, the problem is analysed, and some qualitative performance indicators are identified and defined - re-configurability, robustness and agility - and methodologies for their evaluation are suggested.
2. PERFORMANCE MEASUREMENT IN
MANUFACTURING CONTROL SYSTEMS The assessment, evaluation and comparison of achievements of different manufacturing control systems, and the cooperation between manufacturing control systems developers to improve their solutions, require the definition of appropriate performance measurement frameworks.
Performance measurement is the process of using a tool or a procedure to evaluate a concrete efficiency parameter of the system. As an example, a common way of evaluating a car engine performance is to calculate the kilometers per liter ratio, i.e. the ratio of the number of kilometers driven to the number of liter of petrol consumed. The term measurement implies that the approach being used is rigorous, systematic and quantifiable.
A performance measurement procedure must be objective, based on scientific evidence and must not affect or distort results. In developing a performance indicator, it must be tested to ensure that it is reliable (i.e. the use of the procedure results in the same reading regardless of who does the measuring or when and where the measurement is taken), valid (i.e. the procedure measures what is intended) and standardised (i.e. definitions of standards, data elements, data collection, and data analysis are sufficiently precise and comprehensible that they can be understood and applied in the same way regardless of who refers to or applies them).
Performance measurement results describe an observed level of performance (such as throughput rate or number of industrial accidents per year) allowing to analyse the performance of a system and to compare the performance of different systems2, but they don’t tell why the performance is as it is. Results cannot reveal which factors account for differences in measured levels of performance.
Traditionally, the performance measurement approaches have a scope focused in the financial aspects. (Neely, 1999) identified that the reasons why these types of measures are criticised is because they:
2
As example, nowadays the measure of productivity is in the order of the day, being used this parameter to compare and rank the economic performance level of each country.
−encourage short-termism and local optimisation;
−lack strategic focus and fail to provide data on quality, responsiveness and flexibility;
−do not encourage continuous improvement.
In manufacturing context, the performance parameters can be classified as qualitative or quantitative. The quantitative measures are based on different production performance indicators, such as the manufacturing lead time, the tardiness, the waiting time, the throughput, number of delayed orders and the WIP. The qualitative measures are of a more subjective nature and reflect properties of the manufacturing control solution, such as the agility, flexibility and robustness, which can not be directly obtained from the production data.
The choice of the performance indicators to be used depends on the business domain. For some applications the throughput is the major performance indicator, but others can consider the robustness or service quality the focus in the performance measurement.
A broad number of performance measurement systems (PMSs) has been proposed and in some cases deployed in practice, using indicators more relevant to the manufacturing area and that can be used to drive the production process. Some of the most widely cited PMSs are: the Balanced Scorecard (Kaplan and Norton, 1996), the Performance Measurement Matrix (Keegan et al., 1989), and the Integrated Dynamic Performance Measurement System (Ghalayini and Noble, 1996). These approaches present some disadvantages, some of them identified by (Bititci et al, 2002):
−most of the performance systems are historical and static, which does not reflect the dynamic aspects associated to the manufacturing changes;
−only few performance measurement systems have an IT infrastructure, which leads to cumbersome and time-consuming data collection and reporting;
−these approaches focus in the performance measurement of the manufacturing system, and not in the associated control system.
Since the scope of this paper is the manufacturing control system, our intention is the definition of suitable set of performance indicators addressing the dynamic and qualitative aspects of a manufacturing control system. In these circumstances, the authors propose a methodology to evaluate the performance of manufacturing control applications, which comprises the following main steps:
−Proper definition of each identified performance indicator.
−Definition of a procedure to measure each performance indicator.
In the following sections, the proposed methodology will be exemplified by identifying some performance indicators to measure qualitative aspects of manufacturing control systems, and defining procedures to measure those indicators. A procedure to calculate the overall performance of a manufacturing control system, ranking different implemented systems, is suggested.
3. MEASURING THE DYNAMIC
PERFORMANCE INDICATORS The parameters associated to the dynamic behaviour of a manufacturing system, such as the capability to support the introduction of one new product in the factory plant and to react to the occurrence of machine breakdowns, have more importance in the performance of a manufacturing system. However, in performance measurement research, little attention has been devoted to the system dynamics, especially to the quantification of these parameters.
An important aspect when dealing with the occurrence of disturbances is the response effectiveness. The parameters more suitable to assess this effectiveness are: re-configurability, agility and robustness. In our opinion, these parameters, which are the major key parameters in the analysis of the dynamic response, are difficult to measure presenting a certain degree of subjectivity in their analysis. In the following, these parameters will be defined and methodologies for there measurement will be proposed.
3.1 Re-configurability
Flexibility is related to the capability of the manufacturing system and its control system to support the production change when the consumption or demand changes, and the capability of re-configuration in the case of malfunctions of some resources.
Several flexibility classifications, as discussed by (Gerwin, 1993; Browne et al., 1984), are presented in literature, identifying different types of flexibility, such as mix, changeover, volume, product and sequencing. The mix flexibility is concerned with the capability of a system to handle a range of products or variants, supported by the execution of fast set-ups in the process. The changeover flexibility is the capability to change quickly the production system in order to be able to offer new products. The volume flexibility is the capability to deal with production
volume variability, facing the demand. The product flexibility is the capability to modify rapidly the product at design level. The sequencing flexibility is the capability to support alternative sequences for the production plan execution by using resources that have capability to execute different operations, organised in a proper way.
In spite of the little attention that has been devoted to the measurement of flexibility of manufacturing systems and their associated control systems, some authors have approached the issue. As example, (Ibarrondo and Mercader, 2001) presents an approach to measure the volume and mix flexibility (designating by operational flexibility the aggregation of both types of flexibility) based in measuring the minimal and maximum capacity of the system, and (Tsourveloudis, 1998) presents a fuzzy logic framework to measure several types of flexibility: machine, routing, material handling system, product, operation, process, volume, expansion and labour flexibilities.
None of these types of flexibility is the focus of our work, since we are looking for the flexibility associated to the control system, which we defined as re-configurability.
The re-configurability of the control system is the ability to support different manufacturing system configurations, i.e. different production systems scenarios, with a small customisation effort.
We assume that there are two dimensions on the effort, the quality and the quantity of the effort, and that these two values can be measured/estimated for a certain of previsible scenarios. The measures to determine the re-configurability of the control system are of two different types: degree of complexity of the customisation and development time for the customisation.
The degree of complexity parameter is a subjective parameter that can be evaluated in a relative way and expressed in a scale from 0 to 100 percent, through questionnaires to the software developers and manufacturing system engineers. The development time can be measured counting the time spent when customising the application, or estimated by experts. These two parameters are highly subjective and not quantifiable for a given set of scenarios. The authors propose a fuzzy approach to this question, reflecting this qualitative nature.
in A, it is necessary to define the membership functions for each fuzzy variable.
Fig. 1 - Membership Functions for the Degree of Complexity Variable
In case of the degree of complexity fuzzy variable the membership functions are illustrated in Fig. 1. The membership function of {Low} and {High} fuzzy sets use a trapezoidal function type and the membership function of {Medium} fuzzy set uses a triangular function type. The use of triangular and trapezoidal functions type is the simplest way to define membership functions, but they not present a smoothness surface in the output parameter. The use of a Gaussian function type allows mainly achieving smoothness in the output parameter.
Applying a similar fuzzyfication procedure to the development time parameter, this may be represented in terms of the fuzzy sets {Low, Medium, High}.
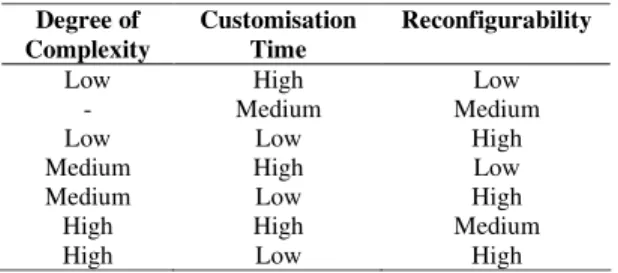
Table 1 – Fuzzy Rules to Determine the Reconfigurability Parameter
Degree of Complexity
Customisation Time
Reconfigurability
Low High Low
- Medium Medium
Low Low High
Medium High Low
Medium Low High
High High Medium
High Low High
The re-configurability parameter is also expressed in terms of the fuzzy sets {Low, Medium, High}, using similar membership functions to those defined for the degree of complexity variable. The fuzzy inference process is based in a fuzzy rule base. The reconfigurability fuzzy variable is determined according the fuzzy rules, such as those expressed in the Table 1.
3.2 Robustness
The robustness of a control system is the capability to remain working correctly and relatively stable, even in presence of disturbances.
A robustness performance measurement procedure should measure how a system reacts to possible erroneous inputs or environmental factors that could affect the system. Ideally, it is necessary to exercise
the system with all possible errors, conducting to an absolutely robust system. However, in reality, it is not possible to test all possible natural errors that can occur in the system (verifying the system operation and waiting for the occurrence of errors that occur infrequently is too time consuming).
Until now, there has been no effective approach to quantitatively measure the robustness of a manufacturing control system. Here, a simple and repeatable way to measure the manufacturing control system robustness is introduced.
The robustness performance measurement procedure will give a relative measure of robustness, having not a quantitative value. The procedure to measure the robustness comprises the introduction of possible errors (as many as possible) and the verification if the control system remains working correctly.
T1: During the normal operation the system remains stable?
T2: Introduce a new component in the system (e.g. a new machine). The system remains stable?
T3: Breakdown a centralised component of the system (such as a central scheduler or a supervisor). The system remains stable?
T4: Breakdown a local distributed component of the system (such as a resource, an order or a component that integrates a legacy system). The system remains stable?
T5: Introduce a failure in the network that links the holon responsible for the resource and the physical resource. The system remains stable?
T6: Remove the available resource(s) to execute a job (for example, a transporter device). The system remains stable?
T7: Test the graphical interface by clicking on the buttons and introducing inputs value with different data types (for example, inputing a string in a date field). The system remains stable?
T8: Introduce the occurrence of machine breakdowns. The system react to it?
T9: Introduce configuration files for a holon not respecting the XML format define for the configuration file. The system remains stable?
T10: Include a data type error in the configuration file (for example, introducing a string value in the field related to the estimated processing time). The system remains stable?
T11: Remove all possible resources to execute an operation. The system remains stable?
T12: In this case, the system is able to continue the resource allocation process (for example, waiting a certain time and announcing again the execution of the operation)?
T13: Send messages to the holons with no understandable contents. The system remains stable?
T14: Introduce one rush order. The system respond to it?
T15: Increase the number of production orders. The system (schedulers) remains stable?
T16: Plug in a new scheduling algorithm (or at least change the scheduling heuristic rule). The system remains stable?
T17: Add new rules to the decision component. The system remains stable?
T18: Change the layout configuration or resource skills. The system remains stable?
T19: For the normal number of holons in the system, verify if exists communication overhead (for example, during the resource allocation process, bid proposals are not received ).
T20: Duplicate the number of holons in the system. The response remains acceptable? !
Fig. 2 – Set of What-if Conditions to Verify the Robustness of the Control System
system solution it is possible to rank the several solutions in terms of robustness.
The best set of what-if questions is an open issue.
3.3 Agility
The agility of a control system is the capability to react in a short period of time to the occurrence of unexpected disturbances. Thus, the agility is a time-based property, being the time needed by the system to recover from the occurrence of the disturbance.
Agility is dependent of the manufacturing system flexibility, especially from the routing flexibility, since it is only possible to react with agility to the occurrence of disturbances if exists capacity and alternative resources in the manufacturing system. Thus, a system has low agility in case of low routing flexibility.
The proposed approach introduces the concepts of frequency and duration of the disturbances to quantify the control system agility. Fig. 3 illustrates the evolution of the throughput over the time. This evolution is affected with the occurrence of disturbances.
"
# $ % "
!
&
'
Fig. 3 - Measure of Agility of a Manufacturing Control System
The Dirac's impulse in the disturbance graph represents the occurrence of a disturbance, which degrades the performance criteria, illustrated by the decrease of the throughput value. The parameter ta is the required time spent by the system to adapt to the disturbance. This parameter is measured between the occurrence of the disturbance and the time when the system achieves a percentage of the initial throughput. A good indicator of this percentage is based in the time constant of RL and RC circuits, which is given by (1-1/e).
The parameter ta is a statistical value, calculated by determining the mean value of tai. The agility of a control system is translated by the ta parameter, being more agile as smaller the ta parameter is.
The agility can also be expressed in terms of the maximum number of disturbances, given by the inverse of ta, and it measures the maximum number of disturbances per time unit, which do not degrade the system performance below a certain level.
The measurement of agility using the previous approach requires the periodically measurement of a performance criteria, such as the throughput or the amount of processed material.
4. EVALUATION OF OVERALL SYSTEM PERFORMANCE
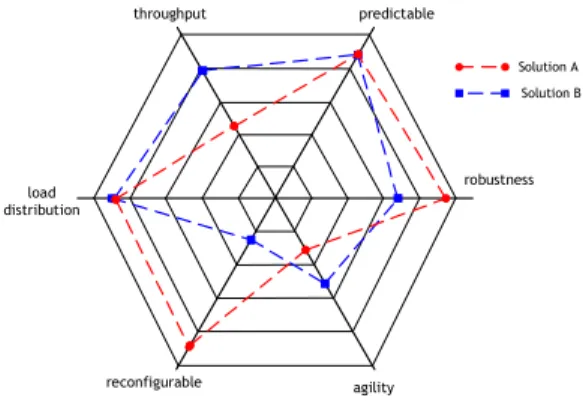
Manufacturing control systems can be compared according to the performance criteria that they intend to maximise (or minimise), for example comparing the different manufacturing control systems under the throughput or agility point of view. However, to rank them, it is necessary to use a procedure that takes in consideration several performance parameters. In our approach, a spidergram is used to summarise the main performance vectors defined for the evaluation of manufacturing control applications.
Spidergrams, also known by polar or radar charts, are a form of graph that allows a visual comparison between several quantitative or qualitative aspects of a situation, or when charts are drawn for several situations using the same axes (poles). Normally, between three and eight attributes can be plotted on each chart, and the chart becomes difficult to analyse for more than eight axes. Scales for each attribute are arranged radially and the points plotted on each radius are joined to generate a shape that can be visually compared with the same plot for another situation.
"
!
& !
" & !
!
( )
Fig. 4 - Spidergram to Evaluate a Manufacturing Control System under Multiple Criterias
In this example, the solution A presents better robustness and re-configurability features than solution B; on the other hand, the solution B presents better throughput and agility than solution A.
Additionally, one of the merits of using a spidergram is that computing the area occupied by a manufacturing control system´s spidergram, the diagram provides an overall system score (Fletcher et al., 2003). This score can then be used to rank various implemented systems, carrying out a competitor analysis. At last, using the spidergram to represent the performance of manufacturing control systems, the desirable state (or the best practices in the domain) and the present state data can be represented on the same chart, to demonstrate graphically the gap between them.
5. CONCLUSIONS
Nowadays, it is becoming more important to evaluate and to compare manufacturing control applications. This is especially true in the analysis of the system performance under qualitative measurement criteria, normally associated to the transient aspects of the manufacturing system. These are however more difficult to measure and quantify than the quantitative indicators.
This paper defines a procedure to analyse and evaluate manufacturing control systems, taking in consideration the qualitative indicators. Some qualitative indicators were identified and properly defined: the re-configurability, robustness and agility. Procedures to measure and quantify these performance indicators were proposed: the re-configurability in terms of effort, the agility in terms of time and the robustness in terms of a percentual number of what-if conditions fulfilled.
The proposed procedures can be generalised in the future, for example by introducing more general test verifications in the analysis of the robustness.
ACKNOWLEDGMENTS
The first author would like to acknowledge the PRODEP program for the financial support granted (PRODEP III-5.3/2000).
REFERENCES
Bititci U., Nuderupati, S. and Turner, T. (2002). Web Enabled Performance Measurement Systems; Management Implications. International Journal of Operations and Production Management, 22(1), pp. 1273-1287.
Browne, J., Dubois, D., Rathmill, K., Sethi, S.P. and Stecke, K.E. (1984). Classification of Flexible
Manufacturing Systems. The FMS Magazine, pp 114-117.
Brussel, H. Van, J. Wyns, P. Valckenaers, L. Bongaerts and P. Peeters (1998). Reference Architecture for Holonic Manufacturing Systems: PROSA. Computers In Industry, 37, pp. 255-274.
Cavalieri, S., Bongaerts, L., Taisch, M., Macchi, M. and Wyns, J. (1999). A Benchmark Framework for Manufacturing Control. In: Proceedings of the Second International Workshop on Intelligent Manufacturing Systems, Leuven, Belgium, 22-24 September.
Deen, S.M. (ed.) (2003). Agent-Based Manufacturing: Advances in the Holonic Approach. Springer Verlag Berlin Heidelberg.
Fletcher, M., McFarlane, D., Thorne, A., Jarvis, D. and Lucas, A. (2003). Evaluating a Holonic Packing Cell. In: Holonic and Multi-Agent Systems for Manufacturing, V. Marík, D. McFarlane and P. Valckenaers (eds.), Lecture Notes in Artificial Intelligence, vol. 2744, Springer-Verlag, pp. 246-257. Gerwin, D. (1993). Manufacturing Flexibility: A Strategic
Perspective. Management Science, 39, pp 395–410. Ghalayini, A. M. and Noble, J.S. (1996). The Changing
Basis of Performance Measurement. International Journal of Operations and Production Management,
16(8), pp. 63-80.
Ibarrondo, J. and Mercader, J. (2001). Measuring Operational Flexibility. In: Proceedings of the Fourth Stimulating Manufacturing Excellence in Small and Medium Enterprises International Conference, Alborg, Denmark, 14-16 May, pp. 292-302.
JASS (2001). Special Issue on Industrial Applications of Multi-Agent and Holonic Systems. Journal of Applied Systems Studies, 2(1).
Kaplan, R.and Norton, D. (1996). The Balanced Scorecard: Translating Strategy into Action. Harvard Business School Press.
Keegan, D.P., Eiler, R.G. and Jones, C.R. (1989). Are Your Performance Measures Obsolete?. Management Accounting (US), June, pp. 45-50.
Leitão, P., Colombo, A.W. and Restivo, F. (2003. An Approach for the Formal Specification of Holonic Control Systems. Holonic and Multi-Agent Systems for Manufacturing, V. Marík, D. McFarlane and P. Valckenaers (eds), Lecture Notes in Artificial Intelligence, vol. 2744, pp 59-70, Springer-Verlag. Leitão, P. and Restivo, F. (2003). Towards Autonomy,
Self-Organisation and Learning in Holonic Manufacturing. Multi-Agent Systems and Applications III, V. Marík, J. Müller and M. Pechoucek (eds), Lecture Notes in Artificial Intelligence, vol. 2691, pp 544-553, Springer-Verlag.
Leitão, P. and Restivo, F. (2002). Holonic Adaptive Production Control Systems. In: Proceedings of the 28th Annual Conference of the IEEE Industrial Electronics Society, Sevilla, Spain, 5-8 November, pp. 2968-2973.
Neely, A. (1999). The Performance Measurement Revolution: Why Now and What Next?. International Journal of Operations and Production Management,
19(2), pp. 205-228.
Tsourveloudis, N. and Phillis, Y. (1998). Manufacturing Flexibility Measurement: A Fuzzy Logic Framework.