Chemical and physicochemical changes in
Serrana
goat cheese
submitted to extra-long ripening periods
^
Angela Fernandes, Jo~
ao C.M. Barreira, Lillian Barros,
Alvaro Mendonça,
Isabel C.F.R. Ferreira
*, Fernando Ruivo de Sousa
Centro de Investigaçao de Montanha (CIMO), ESA, Instituto Polit~ ecnico de Bragança, Campus de Santa Apolonia, 5300-253 Bragança, Portugal
a r t i c l e
i n f o
Article history: Received 27 June 2017 Received in revised form 18 August 2017 Accepted 26 August 2017 Available online 28 August 2017
Keywords:
Proximate composition Color parameters Fatty acids Extra-long ripening Linear discriminant analysis
a b s t r a c t
Goat milk cheese is highly appreciated since ancient times. However, besides being consumed close to its production date, according to the common practice, there is an increasing trend towards consuming goat milk cheese submitted to long ripening periods. Throughout this process, several chemical changes are expected, justifying the different properties presented by ripe cheese in comparison to fresh one.
Accordingly, proximate composition, salt percentage, saponifiable matter, color parameters, pH and fatty
acids were compared in cheese submitted to medium, long and extra-long ripening. The parameters
showing significant changes among different ripening periods were effectively identified, highlighting
fatty acids as the ones with highest variation. Actually, fatty acids profiles were successfully assayed as a
chemicalfingerprint of goat milk cheese submitted to different ripening periods. This result raised up the
possibility of discriminating goat milk cheese ripening period using a single, fast and reliable chro-matographic methodology.
©2017 Elsevier Ltd. All rights reserved.
1. Introduction
Cheese represents one of the most consumed milk derivatives, being highly appreciated worldwide, available in different forms and types and produced from different types of milk. Cheese pre-pared with sheep or goat milk, owing to its high quality (as detailed below) and the low volume of milk produced by these animals, is often considered as a specialty product, representing important products in Mediterranean economy (Bontinis, Mallatou, Pappa, Massouras, & Alichanidis, 2012; Gonzalez-Martín, Palacios, Revilla, Vivar-Quintana,& Hernandez-Hierro, 2017; Soto-Barajas et al., 2013). In Portugal, as in most countries, the productivity of goat milk is not comparable to that of cow milk; nevertheless, the production volume is considerable, reaching annual volumes around 30 million litres (INE, 2015). Furthermore, cheese produced from goat milk is greatly valued for its organoleptic characteristics, being also acknowledged for its higher digestibility, alkalinity and beneficial effects in human health (Park, 2007).
Traditionally, goat milk cheese was mainly consumed without being submitted to a ripening process, contrarily to what was
practiced with cheese produced from sheep's milk. However, there is an increasing tendency to consume ripe cheese made from goat milk. As this ripening proceeds, different physical and chemical changes are expected to occur. In fact, cheese ripening is a complex procedure that is accompanied by pH variation, breakdown of proteins, slow accumulation of amino acids and lipid degradation (Farahani, Ezzatpanah, & Abbasi, 2014; Gonzalez-Martín et al., 2017). Besides proteolysis and lipolysis, glycolysis is an equally important chemical process occurring in the course of cheese ripening (Delgado, Gonzalez-Crespo, Cava, & Ramírez, 2012; Hayaloglu, Tolu,&Yasar, 2013).
Glycolysis involves several reactions, mainly associated to lactose degradation (Bezerra et al., 2017), while proteolysis is pri-marily conducted by enzymes naturally found in milk, coagulant agents and microbial enzymes produced by lactic acid bacteria (Bezerra et al., 2016). The overall process is influenced by several elements, namely pH, salt-in-moisture, salt content, humidity, storage temperature and time, enzymes present in milk, microor-ganisms and rennet (Hayaloglu et al., 2013; Park, 2001). Finally, lipolysis induces specific changes in fatty acids profile (Park, 2001; Poveda&Cabezas, 2006).
The occurrence of all these modifications is one of the main reasons leading to the exclusive characteristics in different cheese varieties (Farahani et al., 2014; Gonzalez-Martín et al., 2017; *Corresponding author.
E-mail address:[email protected](I.C.F.R. Ferreira).
Contents lists available atScienceDirect
LWT - Food Science and Technology
j o u r n a l h o m e p a g e : w w w . e l s e v i e r . c o m / l o c a t e / l w t
Hayaloglu et al., 2013).
Therefore, it would very interesting to understand how chemi-cal profile evolves throughout ripening, in order to identify the most significant changes characterizing each ripening period.
In this work, different extended ripening periods (up to a maximum of 24 months) were applied to highly appreciated Ser-ranagoat-milk cheeses. Besides assessing physicochemical
modi-fications in each assayed ripening period, the main objective was to evaluate if the profiled changes were significant enough to distin-guish each ripening period.
2. Materials and methods
2.1. Standards and reagents
The fatty acids methyl ester (FAME) reference standard mixture 37 (standard 47885-U) was purchased from Sigma (St. Louis, MO, USA), as also other individual fatty acid isomers. Methanol and all other chemicals were of analytical grade and obtained from com-mon sources; nitrate silver was purchased from Panreac S.A. (Bar-celona, Spain) and potassium chromate from Merck KgaA (Darmstadt, Germany). Water was treated in a Mili-Q water
puri-fication system (TGI Pure Water Systems, USA).
2.2. Samples and cheese-making procedure
Goat-milk cheese was made in an industrial unit (LEICRAS, Cooperativa de Produtores de Leite de Cabra Serrana, Mirandela, Northeast of Portugal), with raw milk fromSerranagoat breed, salt and rennet from animal origin. After ripening, cheese maintained the traditional cylindrical shape. Its classification as Protected Designation of Origin requires the fulfilment of all rules stipulated in the product specification (includingcabra Serrana's milk supply and milk production conditions, milk hygiene, manufacture of the product and labeling). The geographical area of production covers the municipalities of Alfandega da F^ e, Alijo, Bragança (only 15
parishes), Carrazeda de Ansi~aes, Freixo de Espadaa Cinta, Macedo de Cavaleiros, Mirandela, Mogadouro, Murça, Torre de Moncorvo, Valpaços, Vila Flor and Vimioso.
Cheese samples, produced from the same milk lot, were divided into three lots: 3.03.2, 9.10.1 and 6.05.3. After 12 months of ripening three cheeses were separated from each lot and further submitted to the analyses described in section2.3. After 6 additional months (18 months of ripening), three cheeses were separated and sub-mitted to the same analyses. Finally, after 6 additional months (24 months of ripening) the remaining cheeses in each lot were also analyzed as described in section 2.3. Each ripening period was respectively designated as medium, long and extra-long ripening.
During the first month, samples were stored in a ripening chamber at 10e11C and relative humidity (RH) of 75e85%; in the
second month, temperature varied among 9.5 and 11C and RH
from 76 to 81%. After the second month, samples were stored in a preservation chamber at 10.5e12C and RH among 75e85%. Prior
to analysis, all samples were lyophilized (FreeZone 4.5 model 7750031, Labconco, Kansas, USA), reduced to afine dried powder (20 mesh) and mixed to obtain homogenized samples.
2.3. Quality analysis
2.3.1. Proximate composition
Cheese samples were analyzed for moisture, protein, fat and carbohydrate using the AOAC procedures (AOAC., 2016). Samples were lyophilized and reduced to afine powder (20 mesh). Crude protein content (N6.38) was estimated by the macro-Kjeldahl
method, using an automatic distillation and titration unit (model
Pro-Nitro M Kjeldahl Steam Distillation System, Barcelona, Spain); crude fat was determined by extracting a known weight of powdered sample with petroleum ether, using a Soxhlet apparatus and total carbohydrates were calculated by difference according to the equation: 100 - (mmoistureþmproteinsþmfats).
Results were expressed as g per 100 g of fresh weight (fw). Total energy was calculated according to the equation: 4(mproteinsþmcarbohydrates)þ9(mfats) and expressed as kcal per
100 g of fresh weight (fw).
2.3.2. Salt determination
The NaCl concentration in cheese was determined according to Mohr's method. Initially, 1 g of the sample was homogenized in 20 mL of distillated water andfiltered through a Whatman No.4 paper. The powder was then homogenized with an additional portion of 20 mL and this procedure was repeated until a total of 5 time. Then the pH of the aqueous solution was adjusted toz8.5
with sodium hydroxide and 1 mL of potassium chromate solu-tion (5%) was added. The mixture was titrated against AgNO3
(0.05 mol/L) until the appearance of the first reddish color (Ag2CrO4precipitate) (Osaili et al., 2014). The salt concentration
was calculated using the following equation: Salt content %¼[(Vtitrated of AgNO30.00292)]/[(msample)]100 (where 1 mL
of AgNO3 corresponds to 0.00292 g of NaCl). The results were
expressed in g/100 g of fresh weight (fw).
2.3.3. Saponification
The saponification value was determined according the method described inWHO (2016). The methodology started by dissolving around 2 g of neutral fat in 25 mL of an alcoholic solution of po-tassium hydroxide (0.5 mol/L). The mixture was then heated in a boiling plate for 20 min. Afterwards, 1 mL of phenolphthalein/ ethanol (1%) was added and the excess of alkali was titrated with hydrochloric acid (0.5 mol/L). A blank test for titration volume was also performed with hydrochloric acid (0.5 mol/L). The normality 0.5 (N) and correction factor (F) 1.1098 was required. The
saponi-fication value was calculated from the following formula, and expressed in mg KOH: Saponification value¼[(Vrequired to titrate the blank- Vrequired to titrate the sample)NF]¼mmgKOH/equivalent
weight of KOH. The results were expressed in mg KOH per g of fresh weight (fw).
2.3.4. Color measurement
A Minolta spectrophotometer (model CR-400; Konica Minolta Sensing, Inc., Japan) was used to measure the color in three distinct zones of the cheese surface, daily, and these were considered as the average values. Using illuminant C and the diaphragm opening of 8 mm, the Hunter color L*,a*andb*values were reported through the computerized system using a color data software “Spectra Magic Nx” (version CM-S100W 2.03.0006, Konica Minolta com-pany, Japan). The instrument was calibrated to standard white tiles before analysis (Spectra Magic NX Instruction Manual, Konica Minolta Sensing, Inc. (ver 2.0), 2009, Japan).
2.3.5. pH
5 g of cheese were macerated in 5 mL of distilled water, and the pH was measured using a calibrated digital pH meter (portable food and dairy pH meter HI 99161, Hanna Instruments, Woonsocket, RI, USA).
2.3.6. Fatty acids
2:1:1 (v:v:v) during at least 12 h in a thermostat bath (50 C,
160 rpm). Afterwards, deionized water was added to separate phases and fatty acid methyl esters (FAME) were extracted with diethyl ether by vortex shaking. The upper phase was dehydrated with anhydrous sodium sulfate andfiltered (0.2
m
m nylonfilters) for chromatographic injections. The analysis was carried out in a DANI (model GC 1000) instrument equipped with a split/splitless injector, a FID detector at 260C and a Macherey-Nagel column(30 m0.32 mmID0.25
m
m df). The oven temperature program was set as previously described (Pereira, Barros, Carvalho, & Ferreira, 2011). Fatty acids identification was made by comparing the retention times of FAME peaks from cheese samples with commercial standards. The results were recorded and processed using CSW 1.7 software (DataApex 1.7) and expressed in relative percentage.2.4. Statistical analysis
Wherever possible, data were expressed as mean± standard
deviation. All statistical tests were performed at a 5% significance level using IBM SPSS Statistics for Windows, version 22.0. (IBM Corp., USA). A linear discriminant analysis (LDA) was used to evaluate the parameters with the most significant changes for each ripening period. The independent variables (physicochemical pa-rameters) were included together and the assumptions of LDA were fully verified. To validate the significance of the canonical discriminating functions, Wilk'sʎtest was used. A leaving-one-out cross validation procedure was carried out to assess the model performance.
3. Results and discussion
The main objective of this work was quantifying potential changes in the proximate composition and physicochemical prop-erties of goat cheese submitted to largely extended ripening pe-riods. Accordingly, the proximate composition, salt percentage, saponifiable matter, color parameters and pH values were evalu-ated, together with fatty acids profiles. In this first approach, changes induced by ripening stage were individually assessed in each cheese lot to prevent any biased effect induced by variability among lots. If statistically significant (p<0.05), those changes were
classified by Tukey's HSD or Tamhane's T2 tests for homoscedastic or heteroscedastic distributions, respectively.
3.1. Quality analysis
The mean values presented inTable 1are given in g/100 g of fresh weight (fw). Moisture, fat and saponifiable matter were measured both in cheese rind (approximate thickness of 1 mm) and interior. Moisture percentage did not show (p>0.05) high changes throughout maturation, especially in cheese interior, which main-tained nearly the same values (11e14 g/100 g fw) along time.
Regarding cheese rind, differences were a bit higher (15e20 g/100 g
fw), with a general tendency to increase during ripening.
It could be expected that moisture tended to significantly decrease throughout cheese ripening. However, it should be reminded that most part of water content is lost on thefirst months of ripening, thereby being reasonable to expect low variations after thefirst 12 months. In fact, a similar increase in moisture content was previously verified in ripe cheese (Acerbi, Guillard, Guillaume, &Gontard, 2016; Kondyli, Pappa,&Svarnas, 2016). Furthermore,
cheeses were maintained in chambers provided with constant RH (75e85%), which also contributed to maintain moisture values in
cheese throughout long and extra-long ripening periods. Further-more, during ripening process, cheeses are individually wiped with
a moistened cloth. The same reasoning might be used to explain the higher moisture contents in cheese rind.
Conversely, fat contents tended to decrease, especially in cheese interior, as highlighted by the statistical differences measured in cheese samples from all lots (z45 g/100 g fw after 12 months to
40 g/100 g fw after 24 months). The reduction in fat content could, atfirst glance, seem surprising. However, this is a common process during cheese ripening, mostly due to lipolysis occurrence (Kondyli et al., 2016).
Proteins, which, together with lipids, represent the main com-ponents in cheese, were quantified in higher levels in cheese stored for longer periods, varying from 28 to 37 g/100 g fw. This increase might be considered as slightly surprising, since proteolysis pro-cesses are common during cheese ripening. Nevertheless, it must be bear in mind that this proteolysis occurrence tend to occur in the initial ripening months, and the values presented for medium ripe corresponded to cheese samples already stored for at least 6 months, thereby beyond the period of expected significant prote-olysis (Kondyli et al., 2016).
Contents in carbohydrates tended to decrease along ripening (14 g/100 g fw in medium ripe cheese to 11 g/100 g fw in extra-long ripe cheese). All together, these changes in macronutrients led to slightly lower energy values in extra-long ripe cheese (z550 kcal/
100 g fw, in comparison toz580 kcal/100 g fw in samples from
medium ripe cheeses).
Salt contents were lower in extra-long ripe cheese, showing values around 1.7 g/100 g fw, which represent a significant decrease when compared to values quantified in cheese samples stored during 12 months (z2.5 g/100 g fw). The decrease in salt content is
also unexpected, but it might be explained in part by the fact of having been quantified in fw basis, recalling that moisture level increased along ripening.
Finally, saponifiable matter levels showed a marked rise throughout ripening, increasing nearly 40%, from 39 to 42 mg KOH/ g fw in medium-ripe cheese to 55e60 mg KOH/g fw in extra-long
ripe cheese. The considerable increase in saponifiable matter is probably explained by the reduction in fat content, which might have been degraded to release saponifiable compounds.
The results for Hunter's colorL* (lightness),a* (redness) andb* (yellowness) parameters are presented in Table 2. The ripening period did not cause an unequivocal effect over the luminosity of cheese rind and interior, since different effects were obtained for each cheese lot. Even so, the interior of cheeses submitted to extra-long ripening showed a tendency to decreasedL* values, while rind presented the opposite effect. In general, cheese samples exhibited high luminosity, as indicated byL* close to the positive limit (100) of the scale. The high values obtained forL* parameter are obvi-ously explained by the glowing effect caused by the superficial fatty layer of cheese.
Regardinga* andb* values, the ripening process induced a clear increase in both parameters, independently of cheese lot. Values for
a* parameter close to zero indicate that the studied samples pre-sented negligible greenness (negative part of scale) or redness (positive part of scale). As it could be anticipated,b* values were positive (the negative part of this scale is associated with blue color, while the positive represents the yellow color), but not as high as it could be expected; this parameter might vary among 127 and þ128, but the values obtained for cheese interior and rind
were much lower (usually below 30). Even so,b* values tended to increase throughout ripening, most likely due to a slight browning effect, which is typical in cheese maturation.
Regarding pH (Table 2), the general tendency pointed towards a high stability around slightly acidic values. Changes observed among samples ripe for medium, long and extra-long periods represent only smallfluctuations. The tendency to slight variations
in pH values throughout cheese ripening is in agreement with previous results (Acerbi, Guillard, Aliani, Guillaume, & Gontard, 2015; Kondyli et al., 2016).
As commonly observed among products of animal origin, satu-rated fatty acids (SFA) predominated (z70%) over
mono-unsaturated (MUFA) and polymono-unsaturated fatty acids (PUFA) (Table 3). The most abundant SFA were palmitic acid (21e27%),
stearic acid (12e18%) and capric acid (8e12%), which were detected
in higher percentages in cheese submitted to long and extra-long ripening. MUFA, on the other handed, and mostly due to oleic
acid (17e24%), decreased along ripening, in line with the observed
(except in lot 6.05.3) for linoleic and linolenic acids, the prevalent PUFA.
As it could be expected, considering the extended ripening, fatty acids presented several statistically significant differences among the three assayed periods. Owing to the higher stability of SFA during storage, higher percentages after 18 and 24 months are reasonable. This does not necessarily mean that the absolute values of SFA increase; actually, the decrease in MUFA (especially C18:1) certainly contributed to the general increase in SFA, since the
Table 1
Proximate composition (g/100 g fresh weight), energy (kcal/100 g fresh weight), salt (g NaCl/100 g fresh weight) and saponifiable matter (mg KOH/g fw). The results are presented as mean±SD. Statistical classification was performed in each lot individually.a
Lot Maturation Moisture Fat Protein Carbohydrates Energy Salt Saponifiable matter
interior rind interior rind interior interior interior interior interior rind
3.03.2. Medium 13±1 a 18±1 c 45±1 a 36±1 b 28±1 b 14±2 a 575±4 a 2.7±0.2 a 39±1 c 46±4 c Long 12±1 c 20±1 b 42±1 b 37±1 a 35±1 a 11±2 b 565±6 b 2.6±0.1 a 44±3 b 48±3 b Extra-long 14±1 a 22±1 a 38±1 c 34±1 c 35±1 a 13±2 a 534±5 c 1.7±0.1 b 55±1 a 55±1 a
Homoscedasticityb p-value (n¼27) 0.009 0.188 0.215 <0.001 0.219 0.799 0.227 <0.001 <0.001 <0.001 One-way ANOVAc p-value (n¼27) <0.001 <0.001 <0.001 <0.001 <0.001 <0.001 <0.001 <0.001 <0.001 <0.001
9.10.1. Medium 11±1 18±1 b 45±1 a 36±1 b 28±1 c 15±2 a 581±3 a 2.3±0.2 a 42±3 c 43±3 c
Long 12±1 19±1 a 42±1 b 38±1 a 36±1 b 11±1 c 562±5 b 2.3±0.2 a 50±2 b 46±2 b Extra-long 12±1 17±1 b 40±1 c 38±1 a 37±1 a 12±1 b 550±3 c 1.7±0.1 b 57±1 a 57±1 a
Homoscedasticityb p-value (n¼27) 0.829 0.032 0.006 0.196 0.663 0.852 0.003 0.001 <0.001 <0.001 One-way ANOVAc p-value (n¼27) 0.110 <0.001 <0.001 <0.001 <0.001 <0.001 <0.001 <0.001 <0.001 <0.001
6.05.3. Medium 11±1 16±2 45±1 a 36±2 b 29±2 c 14±2 a 583±10 a 2.7±0.2 a 42±2 c 47±3 c
Long 11±1 15±1 42±1 b 38±1 a 35±1 b 11±1 b 568±5 b 2.3±0.2 b 47±3 b 51±2 b Extra-long 11±1 15±1 40±1 c 36±1 b 38±1 a 11±2 b 555±7 c 1.8±0.1 c 60±1 a 59±1 a
Homoscedasticityb p-value (n
¼27) 0.302 <0.001 <0.001 <0.001 <0.001 0.051 <0.001 <0.001 0.002 <0.001
One-way ANOVAc p-value (n¼27) 0.388 0.052 <0.001 <0.001 <0.001 <0.001 <0.001 <0.001 <0.001 <0.001
aDifferences among means were evaluated using the Tukey's HSD (homoscedastic distribution) or the Tamhane's T2 (heteroscedastic distribution) multiple comparison
tests.
bHomoscedasticity among formulations was tested by means of the Levene test: homoscedasticity,p-value>0.05; heteroscedasticity,p-value<0.05.
c Whenp<0.05 the mean value of the evaluated parameter of at least one maturation period is statistically different allowing performing multiple comparison tests. In each
column, different letters indicate significantly different values among ripening periods within each lot.
Table 2
Color parameters and pH values throughout cheese maturation. The results are presented as mean±SD. Statistical classification was performed in each lot individually.a
Lot Maturation L* a* b* pH
interior rind interior rind interior rind interior rind
3.03.2. Medium 85±4 a 69±3 b 5±1 4±1 c 18±1 c 22±2 b 4.8±0.1 b 4.7±0.1 c
Long 82±4 b 72±3 a 5±1 3.2±0.5 b 19±1 a 21±1 c 4.9±0.1 a 4.8±0.1 b
Extra-long 67±1 c 72±1 a 5±1 1.7±0.2 a 17±1 b 27±1 a 4.7±0.2 b 4.9±0.1 a
Homoscedasticityb p-value (n¼27) <0.001 <0.001 0.005 <0.001 <0.001 <0.001 0.004 0.004 One-way ANOVAc p-value (n¼27) <0.001 <0.001 0.064 <0.001 <0.001 <0.001 <0.001 <0.001
9.10.1. Medium 69±3 a 70±1 7±1 c 3±1 c 19±1 b 26±2 b 4.9±0.1 b 4.8±0.1 b
Long 65±2 b 69±2 6±1 b 2.1±0.5 b 18±2 b 25±2 b 5.3±0.1 a 5.1±0.1 a
Extra-long 68±2 a 70±1 4±0.2 a 0.8±0.2 a 22±1 a 28±2 a 5.2±0.3 a 5.1±0.1 a
Homoscedasticityb p-value (n
¼27) 0.295 <0.001 <0.001 <0.001 0.013 0.368 <0.001 0.561
One-way ANOVAc p-value (n¼27) <0.001 0.080 <0.001 <0.001 <0.001 <0.001 <0.001 <0.001
6.05.3. Medium 67±2 c 68±1 b 4.9±0.4 b 1±1 c 17±1 c 29±2 c 5.2±0.1 a 4.9±0.1 b
Long 69±2 b 68±2 b 5±1 b 0±1 b 20±1 b 31±2 b 5.2±0.1 a 5.0±0.1 a
Extra-long 72±2 a 70±2 a 4±1 a 1±1 a 21±1 a 32±2 a 4.8±0.1 b 4.9±0.1 b
Homoscedasticityb p-value (n
¼27) 0.181 0.611 <0.001 <0.001 0.378 0.738 0.643 0.085
One-way ANOVAc p-value (n¼27) <0.001 <0.001 <0.001 <0.001 <0.001 <0.001 <0.001 0.001
aDifferences among means were evaluated using the Tukey's HSD (homoscedastic distribution) or the Tamhane's T2 (heteroscedastic distribution) multiple comparison
tests.
bHomoscedasticity among formulations was tested by means of the Levene test: homoscedasticity,p-value>0.05; heteroscedasticity,p-value<0.05.
c Whenp<0.05 the mean value of the evaluated parameter of at least one maturation period is statistically different allowing performing multiple comparison tests. In each
quantification was made in relative percentage. Besides palmitic and stearic acids, the presence of capric acid (C10:0) should be highlighted, as this fatty acid is the main responsible for the odor of goat milk and cheese.
3.2. Linear discriminant analysis
Results indicated in Tables 1e3 showed statistical significant differences among cheese submitted to different ripening periods for several parameters. Nevertheless, it would be useful to verify which differences characterized mostly each ripening period, as well as verifying if differences remained significant when evaluated simultaneously. With that purpose in mind, all results were compared together by LDA. The significant independent (p<0.05) variables were selected by the stepwise procedure, considering Wilks’
l
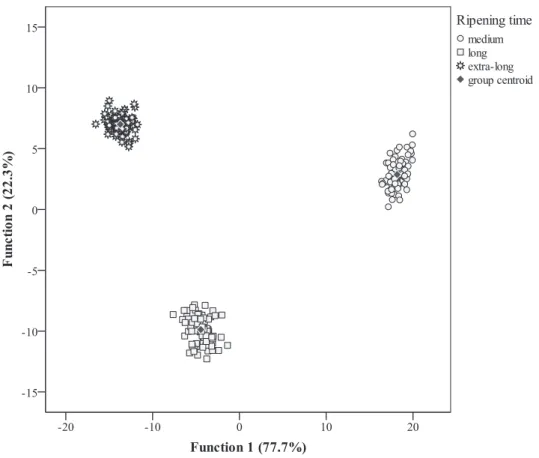
test values.The defined discriminant functions (Fig. 1) included 100.0% of the observed variance (first: 77.7%, second: 22.3%). These functions were defined according to the variables selected as mostly contributing to discriminate ripening periods. Among the 48 included variables, 19 were selected: saltiness, saponifiable matter,
a* (all three in cheese interior and rind), moisture, protein, energy, C4:0, C10:0, C14:0, C18:0, C18:3, C20:3þC20:1, C22:0, C22:6, C23:0
and C24:0 (all measured in cheese interior), as those having sig-nificant discriminant ability. Concerning correlations between selected variables and canonical discriminant functions, function 1 was mostly correlated with C20:3 þ C21:0 (present only in
medium-ripe samples), protein, saponifiable matter (cheese inte-rior), C22:0 (all three lower in medium-ripe samples) and energy (higher in medium-ripe samples), separating samples corre-sponding to medium-ripe cheeses from those stored during longer periods (Fig. 1, horizontal axis). Function 2, on the other hand, was especially correlated with C23:0 (absent in extra-long ripe cheese), salt content (higher in long ripe cheese), saponifiable matter in rind and C22:6 (both higher in extra-long ripe cheese), separating markers corresponding to cheese samples submitted to long or extra-long ripening periods (Fig. 1, vertical axis). According to the leave-one-out classification, all samples were correctly classified, either for the originally grouped cases, as well as for cross-validated ones.
The high number of fatty acids among variables selected as having discriminant ability raised up the possibility that fatty acid profile alone could represent a chemicalfingerprint to discriminate goat cheese according to ripening period. Therefore, a second linear discriminant analysis was tested including only the results ob-tained for fatty acids profiles. The two defined discriminant func-tions (Fig. 2) included also 100.0% of the observed variance (first: 81.8%, second: 18.2%). From the 26 individual fatty acids (plus SFA, MUFA and PUFA), only 13 were selected as having discriminant ability (C4:0, C10:0, C14:0, C16:0, C17:0, C18:3, C20:1, C20:3þC21:0, C20:5, C22:0, C23:0, C22:6 and C24:0). It is obvious
that function separated primarily long and extra-long ripe cheese from medium ripe one, being mainly correlated to C4:0, C10:0 (lower in medium ripe cheese), C20:3 þC21:0 (only present in
medium ripe cheese), C20:5 and C24:0 (both higher in medium ripe cheese). Regarding long and extra-long ripe cheese, which showed similar values for the fatty acids correlated with function 1, the corresponding markers were clearly separated by function 2, which was mostly correlated with C23:0 (absent in extra-long ripe cheese), C22:0 (higher in extra-long ripe cheese) and C22:6 (lower in extra-long ripe cheese). The classification performance was completely accurate (all samples were correctly classified, either for the originally grouped cases, as well as for cross-validated ones).
T able 3 Fatty acids (r elati v e %) pro fi le thro ughout cheese matur ation. The results ar e pres ent ed as mean ± SD. Statistical classi fi cation w as performed in each lo t indi viduall y. a Lot Maturation C4:0 C6:0 C8:0 C10:0 C12:0 C14:0 C16:0 C18:0 C18:1 C18:2 C18:3 SFA MUFA PUFA 3.03.2. Medium 2.4 ± 0.3 c 2.6 ± 0.3 c 2.8 ± 0.2 c 8 ± 1 c 3.4 ± 0.2 c 7.9 ± 0.3 b 22 ± 1a 1 8 ± 1a 2 4 ± 1 a 1.8 ± 0.2 b 2 .1 ± 0.2 a 70 ± 1c 2 5 ± 1 a 4.6 ± 0.4 a Long 4.3 ± 0.2 a 4.5 ± 0.1 a 4.2 ± 0.2 a 11 ± 1 a 4.1 ± 0.2 a 8.1 ± 0.3 a 21 ± 1b 1 5 ± 1c 2 0 ± 1 c 2.0 ± 0.1 b 1 .8 ± 0.1 b 75 ± 1a 2 1 ± 1 c 4.0 ± 0.2 c Extra-long 2.7 ± 0.2 b 3.8 ± 0.5 b 3.8 ± 0.5 b 10 ± 1 b 3.9 ± 0.2 b 8.1 ± 0.3 a 22 ± 1a 1 6 ± 1b 2 1 ± 1 b 2.4 ± 0.2 a 1 .7 ± 0.2 b 74 ± 1b 2 2 ± 1 b 4.3 ± 0.4 b Homoscedasticity b p -value (n ¼ 27) 0.053 < 0.001 < 0.001 < 0.001 0.508 0.485 < 0.001 0.001 0.826 0.010 0 .003 0.245 0.910 < 0.001 One-way AN OVA c p -value (n ¼ 27) < 0.001 < 0.001 < 0.001 < 0.001 < 0.001 0.005 < 0.001 < 0.001 < 0.001 < 0.001 < 0.001 < 0.001 < 0.001 < 0.001 9.10.1. Medium 2.4 ± 0.1 b 2.6 ± 0.2 b 2.6 ± 0.2 b 7.9 ± 0.3 c 3.5 ± 0.2 c 8.6 ± 0.3 a 26 ± 1a 1 6 ± 1a 2 4 ± 1 a 1.5 ± 0.1 c 1 .9 ± 0.1 a 71 ± 1b 2 5 ± 1 a 3.9 ± 0.1 a Long 3.9 ± 0.4 a 4.3 ± 0.2 a 4.0 ± 0.2 a 11.2 ± 0.5 a 4.3 ± 0.4 a 8.7 ± 0.3 a 24 ± 1b 1 3 ± 1b 2 1 ± 1 b 1.6 ± 0.1 b 1 .1 ± 0.2 b 75 ± 1a 2 2 ± 1 b 2.9 ± 0.3 b Extra-long 3.9 ± 0.5 a 4.3 ± 0.4 a 4.1 ± 0.2 a 10.6 ± 0.3 b 4.0 ± 0.1 b 8.4 ± 0.2 b 24 ± 1b 1 3 ± 1b 2 1 ± 1 b 1.8 ± 0.1 a 1 .0 ± 0.1 b 75 ± 1a 2 2 ± 1 b 3.1 ± 0.2 b Homoscedasticity b p -value (n ¼ 27) < 0.001 < 0.001 0.249 < 0.001 < 0.001 0.001 < 0.001 0.620 0.190 0.007 0 .002 0.035 0.119 < 0.001 One-way AN OVA c p -value (n ¼ 27) < 0.001 < 0.001 < 0.001 < 0.001 < 0.001 0.001 < 0.001 < 0.001 < 0.001 < 0.001 < 0.001 < 0.001 < 0.001 < 0.001 6.05.3. Medium 2.2 ± 0.1 c 2.6 ± 0.1 b 2.5 ± 0.2 b 8 ± 1 c 3.5 ± 0.2 c 8.7 ± 0.3 b 27 ± 1 a 15.2 ± 0.3 a 23 ± 1 a 1.4 ± 0.1 c 1 .8 ± 0.1 a 73 ± 1c 2 3 ± 1 a 3.8 ± 0.1 b Long 3.4 ± 0.5 b 4.3 ± 0.5 a 4.2 ± 0.4 a 12 ± 1 a 4.6 ± 0.2 a 9.1 ± 0.5 a 25 ± 1 b 12.3 ± 0.2 b 19 ± 1 b 2.1 ± 0.5 b 1 .3 ± 0.3 c 77 ± 1b 1 9 ± 1 b 3.7 ± 0.5 b Extra-long 4.2 ± 0.2 a 4.5 ± 0.3 a 4.1 ± 0.3 a 11 ± 1 b 4.4 ± 0.4 b 9.2 ± 0.3 a 25 ± 1 b 12.4 ± 0.5 b 17 ± 1 c 2.7 ± 0.2 a 1 .6 ± 0.2 b 78 ± 1a 1 7 ± 1 c 4.6 ± 0.2 a Homoscedasticity b p -value (n ¼ 27) < 0.001 < 0.001 < 0.001 0.095 0.001 < 0.001 < 0.001 < 0.001 0.191 < 0.001 < 0.001 0.149 0.242 < 0.001 One-way AN OVA c p -value (n ¼ 27) < 0.001 < 0.001 < 0.001 < 0.001 < 0.001 < 0.001 < 0.001 < 0.001 < 0.001 < 0.001 < 0.001 < 0.001 < 0.001 < 0.001 a Differences among means were evaluated using the Tukey's HSD (homo scedastic distribution) or the Tamhane's T2 (heteroscedastic distribution) mul tiple comparison tests. b Homoscedasticity among formulations was tested by means of the Levene test: homoscedasticity, p -value > 0.05; heteroscedasticity, p -value < 0.05. c When p < 0.05 the mean value of the evaluated parameter of at least one maturation period is statistically different allowing performing multiple comparison tests. In each column, different letters indicate signi fi cantly different values among ripening periods within each lot.
Fig. 1.Canonical discriminant functions coefficients defined from the evaluated parameters and plotted to highlight differences among ripening periods.
4. Conclusion
Considering the evaluated parameters, several significant dif-ferences were found among cheese submitted to different ripening periods. In general, the assayed extended periods did not compromise the nutritional value of this highly appreciated prod-uct. Even so, the chemical changes that characterized mostly each ripening period (e.g., lower protein content, lower saponifiable matter and higher energy value in medium ripe cheese; higher salt percentage in long ripe cheese or higher saponifiable matter in extra-long ripe cheese) were effectively identified. Furthermore, fatty acids profile were attained as a potential chemical marker of cheese ripening duration, offering the possibility of discriminating different ripening periods in goat milk cheese by performing a single and simple chromatographic analysis.
Acknowledgments
The authors are grateful to the Foundation for Science and Technology (FCT, Portugal) and FEDER under Program PT2020 for
financial support to CIMO (UID/AGR/00690/2013) and A. Fernandes (SFRH/BPD/114753/2016) grant. The authors are also grateful to the project funded by the Proder program - Measure 4.1 - Cooperation for Innovation - PA 49 481 - in partnership with LEICRAS.
References
Acerbi, F., Guillard, V., Aliani, M., Guillaume, C., & Gontard, N. (2015). Novel meth-odology for the in situ assessment of CO2 production rate and its application to anaerobic ripened cheese.Food Research International, 78, 295e301.http://doi.
org/10.1016/j.foodres.2015.09.030.
Acerbi, F., Guillard, V., Guillaume, C., & Gontard, N. (2016). Impact of selected composition and ripening conditions on CO2solubility in semi-hard cheese.
Food Chemistry, 192, 805e812.http://doi.org/10.1016/j.foodchem.2015.07.049.
AOAC. (2016).Official methods of analysis of AOAC international(20th ed.).
Associa-tion of Official Analysis Chemists InternaAssocia-tional.
Bezerra, T. K. A., Arcanjo, N. M. O., Garcia, E. F., Gomes, A. M. P., Qeiroga, R. C. R. E., de Souza, E. L., et al. (2017). Effect of supplementation with probiotic lactic acid
bacteria, separately or combined, on acid and sugar production in goat“coalho”
cheese.LWT - Food Science and Technology, 75, 710e718.
Bezerra, T. K. A., De Araujo, A. R. R., Do Nascimento, E. S., De Matos Paz, J. E.,
Gadelha, C. A., Gadelha, T. S.,…Madruga, M. S. (2016). Proteolysis in goat
“coalho” cheese supplemented with probiotic lactic acid bacteria. Food
Chemistry, 196, 359e366.
Bontinis, T. G., Mallatou, H., Pappa, E. C., Massouras, T., & Alichanidis, E. (2012). Study of proteolysis, lipolysis and volatile profile of a traditional Greek goat
cheese (Xinotyri) during ripening.Small Ruminant Research, 105, 193e201.
Delgado, F. J., Gonzalez-Crespo, J., Cava, R., & Ramírez, R. (2012). Changes in
microbiology, proteolysis, texture and sensory characteristics of raw goat milk
cheeses treated by high-pressure at different stages of maturation.LWT - Food
Science and Technology, 48, 268e275.
Farahani, G., Ezzatpanah, H., & Abbasi, S. (2014). Characterization of Siahmazgi cheese, an Iranian ewe's milk variety: Assessment of physico-chemical, textural
and rheological specifications during ripening.LWT - Food Science and
Tech-nology, 58, 335e342.
Gonzalez-Martín, M. I., Palacios, V. V., Revilla, I., Vivar-Quintana, A. M., & Hern
an-dez-Hierro, J. M. (2017). Discrimination between cheeses made from cow's, ewe's and goat's milk from unsaturated fatty acids and use of the canonical
biplot method.Journal of Food Composition and Analysis, 56, 34e40.
Hayaloglu, A. A., Tolu, C., & Yasar, K. (2013). Influence of goat breeds and starter culture systems on gross composition and proteolysis in Gokceada goat cheese
during ripening.Small Ruminant Research, 113, 231e238.
INE. (2015).Estatísticas agrícolas 2005 a 2014. Ine.http://doi.org/0079-4139. Kondyli, E., Pappa, E. C., & Svarnas, C. (2016). Ripening changes of the chemical
composition, proteolysis, volatile fraction and organoleptic characteristics of a white-brined goat milk cheese.Small Ruminant Research, 145, 1e6.http://doi.
org/10.1016/j.smallrumres.2016.10.022.
Osaili, T. M., Al-Nabulsi, A. A., Olaimat, A. N., Shaker, R. R., Taha, M., & Holley, R. A. (2014). Survival of Escherichia coli O157:H7 during manufacture and storage of
white brined cheese.Journal of Food Science, 79, M1750eM1755.
Park, Y. W. (2001). Proteolysis and lipolysis of goat milk cheese.Journal of Dairy
Science, 84, E84eE92.
Park, Y. W. (2007). Rheological characteristics of goat and sheep milk. Small
Ruminant Research, 68, 73e87.
Pereira, C., Barros, L., Carvalho, A. M., & Ferreira, I. C. F. R. (2011). Nutritional composition and bioactive properties of commonly consumed wild greens:
Potential sources for new trends in modern diets.Food Research International,
44, 2634e2640.
Pinela, J., Barreira, J. C. M., Barros, L., Verde, S. C., Antonio, A. L., Carvalho, A. M.,…Ferreira, I. C. F. R. (2016). Suitability of gamma irradiation for preserving fresh-cut watercress quality during cold storage.Food Chemistry,
206, 50e58.http://doi.org/10.1016/j.foodchem.2016.03.050.
Poveda, J. M., & Cabezas, L. (2006). Free fatty acid composition of regionally-produced Spanish goat cheese and relationship with sensory characteristics. Food Chemistry, 95, 307e311.
Soto-Barajas, M. C., Gonzalez-Martín, M. I., Salvador-Esteban, J., Hern andez-Hierro, J. M., Moreno-Rodilla, V., Vivar-Quintana, A. M.,…Curto-Diego, B. (2013). Prediction of the type of milk and degree of ripening in cheeses by means of artificial neural networks with data concerning fatty acids and near infrared spectroscopy.Talanta, 116, 50e55.http://doi.org/10.1016/j.talanta.2013.
04.043.
WHO. (2016). Determination of saponification value. In WHO Department of
Essential Medicines and Health Products (Ed.),The international pharmacopoeia
(6th ed.). New Zealand: World Health Organization.