A Comparison of Experimental and Analytical
Procedures to Measure Passive Drag in
Human Swimming
Tiago M. Barbosa1,5*, Jorge E. Morais2,5, Pedro Forte3,5, Henrique Neiva3,5, Nuno D. Garrido4,5, Daniel A. Marinho3,5
1National Institute of Education, Nanyang Technological University, Singapore, Singapore,2Department of Sport Sciences, Polytechnic Institute of Bragança, Bragança, Portugal,3Department of Sport Sciences, University of Beira Interior, Covilhã, Portugal,4Department of Sport Sciences, University of Trás-os-Montes and Alto Douro, Vila Real, Portugal,5Research Centre in Sports, Health and Human Development, Vila Real, Portugal
Abstract
The aim of this study was to compare the swimming hydrodynamics assessed with experi-mental and analytical procedures, as well as, to learn about the relative contributions of the friction drag and pressure drag to total passive drag. Sixty young talented swimmers (30 boys and 30 girls with 13.59±0.77 and 12.61±0.07 years-old, respectively) were assessed. Passive drag was assessed with inverse dynamics of the gliding decay speed. The theoreti-cal modeling included a set of analytitheoreti-cal procedures based on naval architecture adapted to human swimming. Linear regression models between experimental and analytical proce-dures showed a high correlation for both passive drag (Dp= 0.777*Df+pr; R2= 0.90; R2a=
0.90; SEE = 8.528; P<0.001) and passive drag coefficient (CDp= 1.918*CDf+pr; R2= 0.96;
R2
a= 0.96; SEE = 0.029; P<0.001). On average the difference between methods was
-7.002N (95%CI: -40.480; 26.475) for the passive drag and 0.127 (95%CI: 0.007; 0.247) for the passive drag coefficient. The partial contribution of friction drag and pressure drag to total passive drag was 14.12±9.33% and 85.88±9.33%, respectively. As a conclusion, there
is a strong relationship between the passive drag and passive drag coefficient assessed with experimental and analytical procedures. The analytical method is a novel, feasible and valid way to gather insight about one’s passive drag during training and competition. Analyt-ical methods can be selected not only to perform race analysis during official competitions but also to monitor the swimmer’s status on regular basis during training sessions without disrupting or time-consuming procedures.
Introduction
Human swimming is a major topic of research for biomechanists and sport scientists. Water, being such a challenging and“unnatural" environment for humans, makes this a very exciting OPEN ACCESS
Citation:Barbosa TM, Morais JE, Forte P, Neiva H, Garrido ND, Marinho DA (2015) A Comparison of Experimental and Analytical Procedures to Measure Passive Drag in Human Swimming. PLoS ONE 10(7): e0130868. doi:10.1371/journal.pone.0130868
Academic Editor:Juan Carlos del Alamo, University of California San Diego, UNITED STATES
Received:September 24, 2014
Accepted:May 26, 2015
Published:July 24, 2015
Copyright:© 2015 Barbosa et al. This is an open access article distributed under the terms of the
Creative Commons Attribution License, which permits unrestricted use, distribution, and reproduction in any medium, provided the original author and source are credited.
Data Availability Statement:All relevant data necessary to replicate the findings presented in the paper are within the Supporting Information files. Data have been de-identified to protect participant privacy.
Funding:Jorge E. Morais (SFRH/BD/76287/2011) and Henrique Neiva (SFRH/BD/74950/2010) gratefully acknowledge the scholarships granted by the Portuguese Science and Technology Foundation (FCT).
research topic. In addition, competitive swimming is one of the most popular sports around the world and the second Olympic sport after track and field. Therefore, swimmers, coaches, and sports analysts are also keen to have deeper insights about the determinant factors that may affect their performances.
Swimming is a multifactorial phenomenon where several fields play a role, albeit biome-chanics and physiology are on the top of the list [1]. The swimmer’s hydrodynamic profile is one of the main biomechanical factors that determine performance. The core of a hydrody-namic analysis is the measurement of the drag force [2]. For a long time, researchers put much effort to develop and validate procedures to measure or estimate the drag force acting upon a swimmer [3,4]. The drag force is an external force applied to the swimmer and has a direction opposite to his displacement:
D¼1
2rv 2
SCD ð1Þ
whereDis the drag force,ρis thefluid’s density,vis the velocity, andSis the projected frontal
surface area. The forward displacement (derived by the velocity or the acceleration) is the resul-tant of the external forces acting on the swimmer’s body:
a¼ X
Fi
m ð2Þ
whereais the acceleration,SFiis the resultant force, andmis the body mass.Eq 2can be
changed to the following:
a¼FPþ ð DÞ
m ð3Þ
whereais the acceleration,FPis the total propulsive force,Dis the drag force, andmis the
body mass. Hence, based onEq 3, it is easy to follow that the swimmer’s performance depends on inertial characteristics (i.e., body mass), thrust (i.e., propulsion), and resistance (i.e., drag force). The drag force is termed“passive drag”when acting upon a swimmer that is towed or gliding, without any limb actions [5]. Active drag is the name for the force when applied to a swimmer performing limb action to propel himself in water [5]. There is anecdotal and empiri-cal evidence that swimmers stay for a longer period gliding during a race compared with previ-ous recommendations in the literature (e.g., after the start, turns, and in some events, such as breaststroke between stroke cycles) [6,7]. During these phases the swimmer is passive, thus passive drag becomes an important parameter to be monitored during training and competition.
are expensive, time consuming, needing trained and dedicated researchers or technicians. On top of that, they are disruptive of the training sessions and unfeasible during official events. However, researchers and practitioners are keen to have a deeper insight about a swimmer hydrodynamics in realistic settings, during official competitions and on a daily basis during training sessions.
In naval architecture, engineers can analyze the vessel’s hydrodynamics based on experi-mental testing, numerical simulations, and analytical procedures [12]. There are a set of mathe-matical models that can be used to have some insight about a vessel hydrodynamics (e.g., sailing, canoeing, kayaking, surfing, rowing). Recently, that set of mathematical models was adapted to human swimming [13]. However, it remains to be shown how valid and reliable these procedures are. If such procedures can be adapted to human swimming and validated with one of the mainstream procedures reported in the literature, this would be a true break-through and has a positive impact on the evidence-based practice of coaches and sport analysts.
An added value of the analytical procedures is that they also enable us to learn about the partial contribution of each drag component to total drag:
D¼Df þDprþDw ð4Þ
whereDis the total drag force,Dfis the friction drag,Dpris the pressure drag, andDwis the
wave drag.Dfis due to the interaction between thefluid’s viscosity and the body’s surface.Dpr
is related to the differences between pressure at the leading and trailing edges of the body (i.e., separation of the boundary layer with its attendant vortices).Dwreflects the energy needed to
push the water out of the way of the body (i.e., the body is used to lift the water against gravity leading to the formation of waves). TheDwis significant if one is displacing on or close to the
water surface. TheDwis negligible at depths greater than 1.8 chest depths below the surface
[14]. Numerical simulations suggest thatDpr-Dfcontributions are 85% to 15% [15] or 75% to
25% [16] of the total drag force of a gliding swimmer fully immersed in the prone position. However, quantifying theDpr-Dfcontributions to the total drag with other procedures besides
numerical simulations has been extremely difficult [10]; and reported as being 65% to 35% wearing a waist-knee swimsuit and 71% to 29% in a conventional suit [8].
The aim of this paper was to compare the swimming hydrodynamic of humans collected with experimental and analytical procedures. Furthermore, to learn about the partial contribu-tion of the friccontribu-tion and pressure drag to total drag. It was hypothesized that, although there is a strong relation between both procedures, a difference should exist and hence needs a correction factor.Dprwould play a major role in the total drag force in comparison to theDf.
Materials and Methods
Subjects
Sixty young swimmers (30 boys and 30 girls with 13.59 ± 0.77 and 12.61 ± 0.07 years old, 67.33 ± 6.24, and 72.50 ± 6.10 s of personal best at the 100-m freestyle event, respectively; all in Tanner stages 2–3 by self-report) were assessed. The sample included several age group national record holders; age-group national champions; and other swimmers that are part of a national talent identification, development, and follow-up scheme.
Procedures
Anthropometrics and inertial parameters. Body mass (BM) was measured with a digital weight scale (SECA, 884, Hamburg, Germany) (ICC = 0.99). The swimmers’added water mass (ma) was estimated as being approximately 27% (26.8 ± 2.3%, mean ± SE) for subjects with
similar age to this study [17]. Height was measured with a digital stadiometer (SECA, 242, Hamburg, Germany) in the upright position, barefoot, and in swimwear (ICC = 0.99). All anthropometric measurements were collected according to standardized procedures. The wet-ted surface area of the body was determined by the Du Bois formula as follows [13]:
Awetted¼0:20247H 0:725
BM0:425
ð5Þ
whereHis the subject´s body height (in m) andBMis the body mass (in kg).
The trunk transverse surface area (S) was measured with a photogrammetric technique [18]. Swimmers were photographed with a digital camera (DSC-T7; Sony, Tokyo, Japan) in the transverse plane from above. Subjects stood on land, in the upright and streamlined position (i.e. length of the swimmer, L). This position is characterized by having the arms fully extended above the head, one hand over the other, fingers also extended close together, and head in neu-tral position. Subjects wore a regular textile swimsuit, cap, and goggles. On the camera-shoot-ing field, a calibration frame with 0.945 m length was aside the swimmer at the shoulder level. TheSwas measured with an area-measuring software (UD Ruler, AVPSoft, USA) after import-ing the digital picture (ICC = 0.97).
Experimental procedure. The passive drag was assessed with inverse dynamics of the glid-ing decay speed [19]. This inverse dynamic technique aims to determine the forces that must act to resist a given motion (in this case, the drag force during streamlined gliding). Drag force is estimated from kinematic and inertial properties. Just like in mainstream inverse dynamics, differentiation of the speed-time set or double differentiation of the displacement-time sets is done and thereafter inserted in the basic equations of motion. This procedure has been reported on a regular basis in the literature [2,20,21]. Swimmers were invited to perform a maximal push-off on the wall fully immersed, at a self-selected depth, ranging approximately between 0.5 and 1.0 m to avoidDw[22]. They were instructed to perform the glides in a
stream-lined position (head in neutral position, looking at the bottom of the swimming pool, legs fully extended and close together, arms fully extended at the front, and with one hand over the other) with no limb actions. Testing ended when swimmers broke the surface and/or were not able to make any further horizontal displacement gliding and/or started any limbs’actions.
A speedometer cable (Swim speedometer; Swimsportec, Hildesheim, Germany) was attached to the swimmer’s hip, and the gliding velocity decay was acquired online (f= 50Hz) [21]. Data were exported to a signal-processing software (AcqKnowledge v. 3.9.0; Biopac Sys-tems, Santa Barbara, USA) and filtered with a 4-Hz cutoff low-pass 4th order Butterworth fil-ter. The selection of the cut-off value was done according to residual analysis (residual error versus cut-off frequency).
The gliding mean velocity and the corresponding mean acceleration based on the accelera-tion to time were calculated with moving time frame windows. The acceleraaccelera-tion to time curve was obtained by numerical differentiation of the filtered speed-time curve, using the 5th order-centered equation [20]:
ai ¼ 2v
i 2 16vi 1þ16viþ1 2viþ2
24Dt ð6Þ
the time. Passive drag (Dp) was calculated as follows:
Dp¼ ðBMþmaÞ a ð7Þ
whereDpis the passive drag,BMis the body mass,mais the added water mass, andais the
acceleration. The passive drag coefficient (CDp) was calculated as follows:
CDp¼ 2D
p
rSv2 ð8Þ
whereρis the density of the water (being 1000 kg/m3),Dpis the passive drag,vis the gliding
velocity, andSis the projected frontal surface area.
Analytical procedure. Theoretical modeling included a set of analytical procedures based on naval architecture but adapted to human swimming [13]. As the subjects were fully immersed, it was assumed that total drag is the sum of the friction and pressure components. The friction drag coefficient was determined from the ITTC-57 correlation line for turbulent flow [23]:
CDf ¼
0:075
ðlogðReÞ 2Þ2 ð9Þ
whereReis the Reynolds number of the body and calculated as follows:
Re¼vL
u ð10Þ
wherevis the gliding velocity collected with the speedometer,Lis the body length, andνis the
water kinematic viscosity (being 8.97 × 10⁻⁷m2/s at 26°C). The friction drag (Df) was
com-puted as follows:
Df ¼0:5rv 2
AwettedCDf ð11Þ
whereρis the density of the water (being 1000 kg/m3),vis the gliding velocity collected with
the speedometer,Awettedis the wetted surface area, andCDfis the friction drag coefficient.
Pres-sure drag (Dpr) was assumed to be due to bluff body separation, with viscous pressure
resis-tance due to negligible boundary layer growth [13]:
Dpr¼0:5rv 2
SCDpr ð12Þ
whereρis the density of the water (being 1000 kg/m3),vis the gliding velocity collected with
the speedometer,Sis the trunk transverse surface area, andCDpris the pressure drag coefficient.
TheCDpr(0.23) was retrieved from numerical simulations in human swimming reported in the
literature, hence adjusted to the human body geometry, glide depth and, for what it’s worth, the range of speeds performed over the glides [15,24]. Total passive drag was estimated as being the sum ofDfand Dpr:
Dfþpr¼Df þDpr ð13Þ
Total drag coefficient (CDf+pr) was computed thereafter inputting theAwetted.
Statistical Analyses
challenging to recruit such number of adult/elite swimmers, it was decided to recruit young tal-ented counterparts. The pool of young taltal-ented swimmers is greater, and they are highly skilled and proficient.
Minimum, maximum, mean, one standard deviation, and coefficient of variation are reported for all variables. Partial contribution (i.e., percentage) of pressure drag and friction drag to total drag is also reported but only for the analytical procedure. To date, experimental approaches have not broken down the total drag into friction and pressure components.
Simple linear regression models between assessed (experimental procedure) and estimated (analytical procedure) were computed for absolute values and after logarithmic transformation. Trendline equation, determination coefficient (R2), adjusted determination coefficient (Ra2), and
standard error of estimation (SEE) were calculated. As a rule of thumb, for qualitative and effect size analysis, it was defined that the relation was as follows: (i) very weak if R2<0.04, weak if 0.04R2<0.16, moderate if 0.16R2<0.49, high if 0.49R2<0.81, and very high if 0.81R2<1.0. Scattergrams include the main trendline plus the 95% confidence interval limits.
Bland-Altman analysis included the plot of the mean value versus the difference between experimental and analytical procedures. The limits of agreement were set at a ±1.96 standard deviation of the difference (i.e., 95% confidence interval). For qualitative interpretation, it was assumed that estimated data were valid if at least 80% of the plots were within the 95% confi-dence interval limits [18].
Results
We failed to find significant differences by gender (Dp: P = 0.25, d = 0.30; Df+pr: P = 0.45,
d = 0.17; CDp: P = 0.14, d = 0.39: Cf+pr: P = 0.37, d = 0.23). Both genders seem to be completely
blended on each other’s. Each gender shows a trendline similar to the one reported for the pooled sample. Therefore, data is reported only for the overall sample.
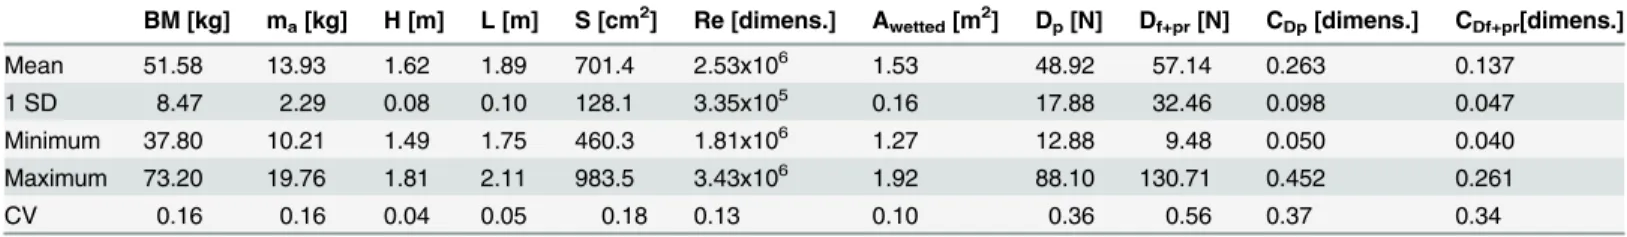
Coefficients of variation ranged between 0.04 and 0.18 for anthropometrical and inertial parameters and between 0.34 and 0.56 for the hydrodynamic variables (Table 1). Hence, vari-ability is higher for the hydrodynamic profile than the anthropometric traits. TheDpwas
48.92 ± 17.88N, and theDf+prwas 57.14 ± 32.46N. TheCDpwas 0.263 ± 0.098, whereas the
CDf+prwas 0.137 ± 0.047.
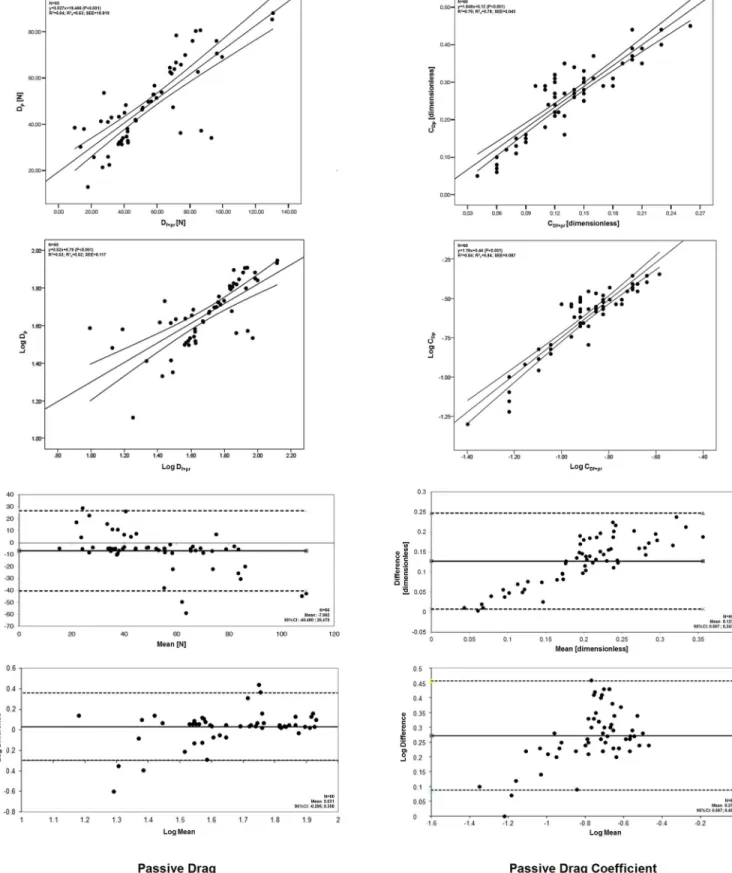
Linear regression models between experimental and analytical procedures showed a high adjustment for both passive drag (absolute values: R2= 0.64, R2a= 0.63, SEE = 16.436,
P<0.001; log-log: R2= 0.53, R2a= 0.53, SEE = 0.117, P<0.001) and passive drag coefficient (absolute values: R2= 0.79, R2a= 0.78, SEE = 0.021, P<0.001; log-log: R2= 0.84, R2a= 0.84,
SEE = 0.087, P<0.001) (Fig 1). Visual inspection of the two scattergrams helps to understand
Table 1. Descriptive statistics for the selected anthropometric, inertial and hydrodynamic variables.
BM [kg] ma[kg] H [m] L [m] S [cm2] Re [dimens.] Awetted[m2] Dp[N] Df+pr[N] CDp[dimens.] CDf+pr[dimens.]
Mean 51.58 13.93 1.62 1.89 701.4 2.53x10⁶ 1.53 48.92 57.14 0.263 0.137
1 SD 8.47 2.29 0.08 0.10 128.1 3.35x10⁵ 0.16 17.88 32.46 0.098 0.047
Minimum 37.80 10.21 1.49 1.75 460.3 1.81x10⁶ 1.27 12.88 9.48 0.050 0.040
Maximum 73.20 19.76 1.81 2.11 983.5 3.43x10⁶ 1.92 88.10 130.71 0.452 0.261
CV 0.16 0.16 0.04 0.05 0.18 0.13 0.10 0.36 0.56 0.37 0.34
BM—body mass; ma—added water mass, H—height; L—body length in the upright and streamlined position; S—trunk transverse surface area; Re—
Reynold number; Awetted—wetted surface area; Dp—passive drag assessed with the experimental procedure; Df+pr—passive drag assessed with the
analytical procedure; CDp—passive drag coefficient assessed with the experimental procedure; CDf+pr—passive drag coefficient assessed with the
Fig 1. Comparison between experimental and analytical procedures to assess the passive drag (Dpand Df+pr, respectively) and the passive drag
coefficient (CDpand CDf+pr, respectively) in absolute unit and after logarithmic transformation.
that the 95% confidence intervals are quite narrow. If the subject does not glide forward in water (i.e., v = 0 m/s), there will be no drag force acting upon his body (D = 0N,Eq 1). Thus, when the models were forced to have the trendline crossing the origin (i.e., c = 0, so y = m.x), its adjustment increases furthermore for both passive drag (R2= 0.90, R2a= 0.90, SEE = 8.528,
P<0.001) and passive drag coefficient (R2= 0.96, R2a= 0.96, SEE = 0.029, P<0.001):
Dp ¼0:777Dfþpr ð14Þ
CDp¼1:918CDfþpr ð15Þ
According to the Bland-Altman analysis, on average, the difference for the passive drag was -7.002N (95% CI: -40.480 to 26.475) having 48 of the 60 subjects showed an underestimation. Ten subject showed clear underestimations (difference higher than -20N). Remaining ones are within the (-10;0N) band (n = 38) or have an overestimation (n = 12). In this context a 10N dif-ference can be considered a marginal bias. Hence 50 subjects are overestimations or neutrals (i.e. with a residual difference between procedures). The passive drag coefficient had a differ-ence between techniques of 0.127 (95% CI: 0.007 to 0.247) and 59 of the 60 subjects showed an overestimation. Regarding logarithmic transformation, the difference for the passive drag was 0.031 (95% CI: -0.295 to 0.358) and 0.271 for the passive drag coefficient (95% CI: 0.087 to 0.456). The model shows a better adjustment in absolute values for the passive drag and in log-log transformation for the drag coefficient. Visual inspection of the plots revealed that the vast majority are within the 95% limits of agreement. Hence, based on data reported inFig 1plus Eqs14and15, the bias between experimental and analytical procedures can be corrected when-ever suitable.
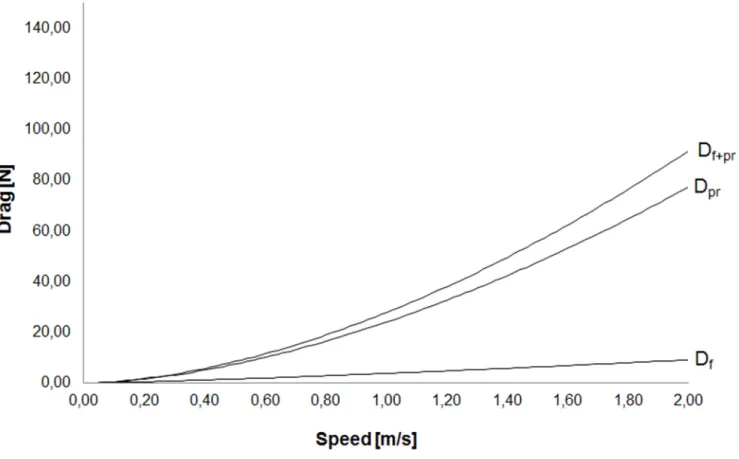
Regarding the analytical procedures, the partial contribution ofDfandDprto total passive
drag was 14.12 ± 9.33% and 85.88 ± 9.33%, respectively. Therefore,Dpris the major
determi-nant of both components to total drag (Fig 2).
Discussion
Our aim was to compare the swimming hydrodynamics assessed with experimental and analyt-ical procedures and to learn about theDpr-Dfcontribution to total passive drag. There is a very
strong relation between both procedures for the passive drag and passive drag coefficient. The partial contribution ofDpr-Dfcontribution to total drag is roughly 85% to 15%.
Linear regression models between experimental and analytical procedures showed a high adjustment for both passive drag and passive drag coefficient (Fig 1). The drag force in absolute units and drag coefficient after logarithmic transformation were the ones showing the best goodness-of-fit and lower error of the estimations. The proportional bias in the Bland-Altman plot for the drag force (absolute values) and drag coefficients (log transformation) is consistent with such models (Fig 1) and in accordance to what is reported in other settings.
If there is no displacement, the drag force acting upon the swimmer is null (Eq 1). If the model is adjusted to such condition, its goodness-of-fit increases furthermore (Eqs14and15). As much as we understand, this procedure was reported at least a couple of times [8,26]. According to the cut-off values set for the qualitative and effect size analysis (please refer to the statistics subsection), both relations are very high (0.81R2<1.0). Nevertheless,Eq 14 sug-gests that there is an overestimation (if y = m.x + c, c = 0 and m<1) of the passive drag, and
Eq 15is an underestimation of the passive drag coefficient (if y = m.x + c, c = 0 and m>1) cal-culating the hydrodynamics with the analytical procedures. On average, the difference between methods was -7.002N (95% CI: -40.480 to 26.475) for the passive drag and 0.127 (95% CI: 0.007 to 0.247) for the passive drag coefficient (Fig 1). An individual analysis shows that 10 of 60 subjects had clear underestimations of the passive drag force and the remaining ones a good-fit or obvious overestimations. The vast majority of the underestimations fall between the 0 and -10N difference and were clustered in a mean value of 40 to 90N. This is consistent to what depicts the log-log plot. Regarding the drag coefficient, all but a couple of subjects pre-sented overestimations. Nevertheless, 22 are mostly clustered between 0 and 0.1 (dimension-less, in absolute units). Again, it is assumed that estimated data is valid if at least 80% of the
Fig 2. Breakdown of total passive drag (Df+pr,Eq 13) into friction drag (Df,Eq 11) and pressure drag (Dpr,Eq 12) gliding fully immersed.
plots are within the 95% confidence interval limits [18], which did happen. Thus, although there is a very strong relation between both procedures, a bias exists, and a correction factor must be applied to report accurate data. To the best understanding of the authors, no paper is found in the literature aiming to compare the passive drag measured with different procedures. However, a similar research design was retrieved comparing two techniques (velocity perturba-tion method vs. measuring-active drag system) to assess the active drag force [27]. Interest-ingly, the authors reached a conclusion similar to ours that both methods measure essentially the same phenomenon and that the bias can be explained by the different assumptions that the tests are based on.
The partial contribution ofDfandDprto total passive drag was 14.12 ± 9.33% and
85.88 ± 9.33%, respectively. If other friction correlation models are selected, notably equations suggested for the range 105<Re<107, the partial contribution ofDfdecreases in 1% to 2%. Only a couple of papers are found in the literature about this relationship as it is very challeng-ing to gather such insight. Numerical simulations solvchalleng-ing the Reynolds Average Navier-Stokes equations (including the Standard k-epsilon turbulence model) that govern the equation of motion of a fluid are one way to learn about it [28]. TheDpr-Dfrelation was reported as being
85% to 15% [15] and 75% to 25% [16]. In both papers, the model was assumed as having a null roughness, which may lead to an underestimation of theDf. Displacing at 2.2 m/s and
neglect-ing theDweffect, theDpr-Dfrelation was experimentally measured as being 65% to 35%
wear-ing a waist-knee swimsuit and 71% to 29% in a conventional suit [8]. Interestingly, our data match the 85% to 15% reported by Marinho et al. [15].
That said, total drag force on the surface is the sum of theDf,DprandDw(Eq 4). Hence, in
such case, the partial contribution ofDfandDprmay change becauseDwbecomes the major
determinant [14]. TheDf,,Dpr, andDwwill show a linear (Df= k.v), quadratic (Dpr= k.v2), and
proportional to the fourth power (Dw= k.v4) of speed, respectively [8] (Fig 2). Having the same
subject performing several trials only the speed would change and remaining terms are kept constant. In such event, the relationship would be clearly v2. However, in this research we have different subjects performing the trials at different speeds. This happens because the gliding decay technique must be performed after a maximal push-off start. Hence, not only the speed changes but also other terms in the model. This might be one of the explanations whyFig 2
depicts a mainly linear relationship for the friction drag rather than the expected theoretical v2 according to Eqs9,10and11.
The following can be addressed as main limitations: (i) for this kind of research, larger sam-ple sizes are needed. Young talented swimmers rather than elite counterparts were assessed because it is very challenging to recruit so many adult/elite swimmers to be part of the study; (ii) it would be very interesting in a near future to compare the analytical procedure with numerical simulations; and (iii) gliding below the surface is not the same as gliding on the sur-face, because in the later one wave drag is a determinant factor. So a deeper insight about the partial contribution of the three components (Df,DprandDw) to both passive and active drags
on the surface is also needed.
Supporting Information
S1 Dataset. Partial dataset used in this research. (XLSX)
Author Contributions
Conceived and designed the experiments: TMB DAM. Performed the experiments: JEM PF HN. Analyzed the data: TMB JEM NDG. Contributed reagents/materials/analysis tools: TMB JEM HN NDG DAM. Wrote the paper: TMB JEM HN NDG DAM.
References
1. Barbosa TM, Bragada JA, Reis VM, Marinho DA, Carvalho C, Silva AJ (2010) Energetics and biome-chanics as determining factors of swimming performance: Updating the state of the art. J Sci Med Sport 13: 262–269 doi:10.1016/j.jsams.2009.01.003PMID:19409842
2. Barbosa TM, Morais JE, Marques MC, Silva AJ, Marinho DA, Kee YH (2014) Hydrodynamic profile of young swimmers: changes over a competitive season. Scan J Med Sci Sports. doi:10.1111/sms. 12281
3. Zamparo P, Capelli C, Pendergast D (2010) Energetics of swimming: a historical perspective. Eur J Appl Physiol 111: 367–378 doi:10.1007/s00421-010-1433-7PMID:20428884
4. Sacilotto GB, Ball N, Mason BR (2014) A biomechanical review of the techniques used to estimate or measure resistive forces in swimming. J Appl Biomech 30:119–127 doi:10.1123/jab.2013-0046PMID: 24676518
5. Kjendlie PL, Stallman RK (2008) Drag characteristics of competitive swimming children and adults. J Appl Biomech 24: 35–42 PMID:18309181
6. Kennedy P.; Brown P.; Chengalur S. Nelson R (1990) Analysis of male and female olympic swimmers in the 100-meter events. J Sports Biomech 6: 187–197
7. Veiga S, Cala A, Mallo J, Navarro E (2013) A new procedure for race analysis in swimming based on individual distance measurements. J Sports Sci 31:159–165 doi:10.1080/02640414.2012.723130 PMID:22989356
8. Mollendorf JC, Termin AC, Oppenheim ERIC, Pendergast DR (2004) Effect of swim suit design on pas-sive drag. Med Sci Sports Exerc 36: 1029–1035 PMID:15179173
9. Coutts KD (1991) Dynamic characteristics of a sport wheelchair. J Rehab Res Develop 28: 45–50
10. Naemi R, Easson WJ, Sanders RH (2010) Hydrodynamic glide efficiency in swimming. J Sci Med Sports 13: 444–451 doi:10.1016/j.jsams.2009.04.009PMID:19540161
11. Marinho DA, Barbosa TM, Kjendlie PL, Vilas-Boas JP, Alves FB, Rouboa AI, et al. (2009) Swimming simulation: a new tool for swimming research and practical applications. In: Peters M, editor. Lecture Notes in Computational Science and Engineering–Computational Fluid Dynamics for Sport Simulation. Berlin: Springer. 33–62
12. Milgram JH (1998) Fluid mechanics for sailing vessel design. Annual Rev Fluid Mech 30: 613–653
13. Webb A, Banks J Phillips C, Hudson D, Tauton D, Turnock S (2011) Prediction of passive and active drag in swimming. Procedia Eng 13: 133–140
14. Vennell R, Pease D, Wilson B (2006) Wave drag on human swimmers. J Biomech 39: 664–671 PMID: 16439236
15. Marinho DA, Barbosa TM, Rouboa AI, Silva AJ (2011) The Hydrodynamic Study of the Swimming Glid-ing: a Two-Dimensional Computational Fluid Dynamics (CFD) Analysis. J Hum Kinetics 29: 80–88
16. Bixler B, Pease D, Fairhurst F (2007) The accuracy of computational fluid dynamics analysis of the pas-sive drag of a male swimmer. Sports Biomech 6:81–98 PMID:17542180
17. Caspersen C, Berthelsen PA, Eik M, Pâkozdi C, Kjendlie PL (2010) Added mass in human swimmers: age and gender differences. J Biomech 43: 2369–2373 doi:10.1016/j.jbiomech.2010.04.022PMID: 20546755
19. Klauck J, Daniel K (1976) Determination of man’s drag coefficients and effective propelling forces in swimming by means of chronocyclography. In: Komi PV, Ed. Biomechanics VB. Baltimore: University Park Press. 250–257
20. Vilas-Boas JP, Costa L, Fernandes RJ, Ribeiro J, Figueiredo P, Marinho DA, et al. (2010) Determina-tion of the drag coefficient during the first and second gliding posiDetermina-tions of the breaststroke underwater stroke. J Appl Biomech 26: 324–331 PMID:20841624
21. Barbosa TM, Costa MJ, Morais JE, Morouço P, Moreira M, Garrido ND, et al. (2013) Characterization of speed fluctuation and drag force in young swimmers: a gender comparison. Hum Mov Sci 32: 1214– 1225 doi:10.1016/j.humov.2012.07.009PMID:24071552
22. Vorontsov AR, Rumyantsev VA (2000) Resistive forces in swimming. In: Zatsiorsky VM, Editor. Biome-chanics in Sport: Performance Enhancement and Injury Prevention. Oxford: Blackwell Science. 184– 204
23. Molland AF, Turnock SR, Hudson DA (2011) Ship Resistance and Propulsion: Practical Estimation of Ship Propulsive Power. Cambridge: Cambridge University Press.
24. Marinho DA, Novais ML, Mantha VR, Ramos RJ, Barbosa TM, Rouboa AI, et al. (2013) CFD analysis of the body position during the gliding in swimming. Br J Sports Med 47: e3
25. Schlichting H (1979) Boundary Layer Theory. New York: McGraw-Hill
26. Pendergast DR, Zamparo P (2011) Balance of biomechanical and physiological contribution to swim-ming performance. In: Veloso AP, Alves F, Fernandes RJ, Conceição F, Vilas-Boas JP, editors. Applied Biomechanics in Sports. Portuguese Journal of Sports Science 11 (suppl 3): 51–59
27. Toussaint HM, Roos PE, Kolmogorov S (2004) The determination of drag in front crawl swimming. J Biomech 37: 1655–1663 PMID:15388307