RBRH, Porto Alegre, v. 23, e15, 2018 Scientific/Technical Article
http://dx.doi.org/10.1590/2318-0331.231820170109
Proposal of rainwater harvesting coefficient (RWHC) for determination of effectively
usable rainfall depth, relevant to rainwater harvesting systems design
Proposta de coeficiente de aproveitamento de água da chuva (CAAC) para determinação da lâmina efetivamente aproveitável aplicável a projeto de captação e aproveitamento de água pluvial
Jairo dos Passos Corrêa1, Lindemberg Lima Fernandes1, Cláudio José Cavalcante Blanco1 and Raisa Rodrigues Neves1
1Universidade Federal do Pará, Belém, PA, Brasil
E-mails: eng.jairopassos@gmail.com (JPC), linlimfer@gmail.com (LLF), blanco@ufpa.br (CJCB), raisanevesufpa@gmail.com (RRN)
Received: July 06, 2017 - Revised: January 28, 2018 - Accepted: February 25, 2018
ABSTRACT
The study measures rainfall data to determine a rainwater harvesting coefficient revelant to rainwater harvesting and catchment projects assisted by non-parametric statistics tests, based on assumption that part of the total rainfall depth is discarded. The analyses of historical rainfall series shows that the city of Belem presents large potential to promote rainwater harvesting, with a rainy season and a less rainy season during the year. The results present an average of one rainfall event per day, from January 2001 to December 2011, and of which around 38% is used only for washing the rainwater harvesting system. The Anderson-Darling test revealed a non-adherence of the rainfall series to a normal distribution and according to the Mann-Kendall test, there was no significant trend in the evaluated series. After the calculation of the effective rainfall, determination of coefficients, application of the Anderson-Darling normality test and the Kruskal-Wallis variance test, it was proposed a rainwater harvesting coefficient of 0.78 for the city of Belém, Brasil.
Keywords: Pluviometer series; Non-parametric tests; Belém.
RESUMO
O estudo avalia dados de precipitação para determinação de coeficiente de aproveitamento de água da chuva aplicável a projetos de captação e aproveitamento pluvial, com auxílio de testes estatísticos não paramétricos, partindo do pressuposto de que uma parte das lâminas de chuva precipitada é descartada. A análise da série histórica pluviográfica de lâminas de chuva mostrou que Belém apresenta grande potencial para aproveitamento de água de chuva, sendo identificados dois períodos, mais e menos chuvoso, no ano e os resultados apresentaram em média um evento de chuva por dia. Os dados são de janeiro de 2001 a dezembro de 2011, nos quais aproximadamente 38% são utilizados apenas para lavagem do sistema de captação. O teste de Anderson-Darling revelou a não aderência das séries de chuva a uma distribuição normal e segundo o teste Mann-Kendall não houve tendência significativa nas séries avaliadas. Após o cálculo das chuvas efetivamente aproveitáveis, da determinação dos coeficientes, e da aplicação do teste de normalidade Anderson-Darling e do teste de variância de Kruskal-Wallis, foi proposto um coeficiente de aproveitamento de água de chuva com módulo 0,78.
INTRODUCTION
In the current scenario of water demand growth for several applications and considering the context of the discussion related to scarcity and water stress, the use of rainwater for human consumption is an important tool in water resources management practices (CAMPOS; AZEVEDO, 2013; CHAIB et al., 2015).
The use of rainwater appears to be a smart water management strategy in places that are not served by public drinking water supply or where it is desired to replace part of the drinking water with non-drinking water, aiming to produce financial savings, or even improve environmental sustainability. The implementation of rainwater harvesting projects is supported by factors such as: geographical layout, presence of rainfall, the inhabitants’ concern to find viable solutions for water supplies, existence of places with insufficient groundwater reserves, use of simple installation systems, operation and maintenance devices, the need of only simplified water treatment and the existence of extensive international and national technological knowledge on this type of technology (SOUZA et al., 2011; ANDRADE NETO, 2013; ALVES et al., 2014; VELOSO; MENDES, 2014).
The literature on the issue about use of rainwater is still limited in Brazil. Despite the evidence that the rainwater harvesting in buildings used for non-drinking water purposes can generate a saving of drinking water greater than two months of consumption per year, and 56 to 86% of drinking water in commercial establishments can be replaced by water from rainwater catchment(CHAIB et al., 2015; GOMES et al., 2014; PROENÇA; GHISI, 2010).
In several countries, studies on the topic of rainwater harvesting have been developed considering different approaches. Akter and Ahmed (2015) conducted a study of the potential of rainwater harvesting in the urban area of Chittagong city in Bangladesh through hydrological modeling, concluding that the use could reduce 26% of the volume of rainwater that would be destined to the drainage system, making a use of 20 liters per inhabitant/day. Sanches Fernandes et al. (2015), carried out a study of a rainwater harvesting system for use in non-drinking water purposes in the city of Mirandela, in the north of Portugal, where it was calculated the efficiency of the system at a value of 90%. García-Montoya et al. (2015) proposed a model for decision-making in designing a project in a residential complex that comprised a water reuse system and a rainwater harvesting system in the city of Morelia, Mexico, where results showed that the use of rainwater reduces significantly the total drinking water consumption. Nawaz et al. (2012) carried out a study on the presence of Pseudomonas aeruginosa and E. coli in rainwater, the efficiency of the application of silver-based chemical products to improve the quality of rainwater in samples of rainwater collected on roofs of the National University of Seoul, in Seoul, South Korea. The results confirmed the existence of the microorganisms’ targeted in the research, while showing the efficiency of the chemical product for the neutralization of the evaluated pathogens. Mahmoud et al. (2014) conducted a study of the potential for rainwater harvesting in the center of Khartoum in Sudan, and the results showed the possibility to use 39,558 m2 for rainwater harvested, with the potential to intercept 0.033 m3 / m2 of rainwater. According to the study, the use of water is an alternative to minimize water
shortages during the dry season. Lim and Jiang (2013) carried out a study in the United States on public health risks related to the use of rainwater for drinking water and non-drinking water purposes, applying a mathematical model of risk assessment. The authors assessed the risk of food contamination irrigated with rainwater and consumed in raw form, and the estimated risk in most samples did not exceed the reference value (≤ 1 case per 10,000 people per year) of Environmental Protection Agency (EPA). Hashim et al. (2013) elaborated an innovative technique to design rainwater harvesting systems, a case study carried out in Malaysia in a community of 200 households with an average of 4 inhabitants per household and a daily demand of 160 m3. The application of project model revealed a saving of 58% in drinking water, with the total cost of the system estimated at $ 443,861 over a 25-year life cycle. Assayed et al. (2013) carried out a study on rainwater harvesting in rural and peripheral communities in Jordan as an alternative for the sustainable water resources management based on data from a social project titled “Community Initiatives for Water Demand Management”. This project aimed at developing the capacity of community organization and raising the level of awareness about water management, providing the involvement of community members in water management measures. The study showed that rainwater harvesting systems deployed on the site, financed through this project, managed to collect 88,335 m3 of water per year. The paper inferred that the rainwater harvesting at the household level could save on average 24% of drinking water per year. It should be noted that in the evaluated studies, it was not identified an approach that considers the determination of a rainwater harvesting coefficient (RWHC). This necessity originates from rainfall events that result in just enough precipitation for the first flush mechanism of the catchment system, and therefore do not arrive at the rainwater storage tank, and should not influence its dimensioning. This problematic issue is addressed in this study.
Considering the project of the rainwater harvesting and catchment system, Murça et al. (2014) point out that the dimensioning of the storage tank is the most economically important stage, since it presents the highest unit cost.
Basic data for dimensioning of the rainwater accumulation reservoir is the daily, monthly and annual rainfall, obtained through historical series of rain gauges, from daily time scale measurements (OLIVEIRA et al., 2012).
Otherwise, Cavalcante and Silans (2012) point out that the evaluation of rainfall in a less than daily time scale is a relevant demensioning parameter in the design of hydraulic systems, and pluviograph measurements allow discretized visualizations of rainfall events throughout the day.
daily volume rainfall and considered in the system design, leading to an over-dimensioning of the reservoir volume.
In this context, RWHC’s conception aims to improve this over-dimensioning, which may occur in rainwater harvesting and catchment projects, by adjusting rainfall data before inserting them into reservoir design equations. Then, the calculated coefficient will be a reduction factor applied to the rainfall used in the storage tank design, which will take into account the demanded rainfall for the first flush discarding device.
Moreover, this study also aims to provide information for decision-making in the conceptions of engineering designs, with emphasis on projects for the rainwater harvesting, cooperating for an adequate use of water resources.
METHODOLOGY
The study was carried out in the city of Belém, State of Pará, Brasil, which is located at -1.4558300° at South Latitude and -48.5044400° at West Longitude (Figure 1). In order to achieve the desired results, 2944 pluviograms were analyzed, traced on a specific paper (covering the first of January 2001 to December 31, 2011) of the station operated by the National Institute of Meteorology (INMET) located in the Municipality of Belém (Urban Zone), at Latitude -1.411228º and Longitude -48.439512º, 10 meters of altitude and OMM code 00082191.
The study followed the following procedures.
Digitalization of pluviograms
The digitization of the pluviograms was performed by Melo et al. (2014), using a digitizing tablet coupled to a personal computer and the System for Digitalization of Pluviograms HidroGraph 1.02.
Elaboration of rainfall events data set
The extraction of information from the digital pluviograms was carried out using Excel spreadsheets and the elaboration of a data set including all the rainfall events that occured during the evaluated period (2001 to 2011), with the date, initial and final times of the rainfall event and the rainfall depth.
Data set analysis
It was defined as a rainfall event all precipitation recorded in the pluviograph that generated a disturbance on pluviogram, with well-established initial and final times. Then the duration of the events was established in function of the graph behavior (Figure 2).
Figure 1. Location of study area in Brazil.
In order to extract the information from the pluviograms, a reference timetable was used to account for the first event of the day. Thus, it was established as a 24h period for any given day the time from 9:00 a.m of the study date to 8:00 a.m. 59 minutes and 59 seconds of the next day. This period corresponds to the time used on the horizontal axis of the paper in which pluviograms were recorded.
The presentation and preliminary analysis of the series was carried out with comparative graphs and spreadsheets, considering the occurred rainfall events – ORE (any rainfall event that occurred during the analyzed period, measured in event count), usable rainfall events − URE (rainfall events, whose rainfall depth exceeds the value set for discard in the first flush, measured in event count), non-usable rainfall events – NURE (rainfall events with rainfall depth less or equal than the value set for the discard of the first rain, measured in event count), occurred rainfall depth – ORD (any rainfall in terms of depth that occurred during the analyzed period, measured in mm), usable rainfall depth – URD (rainfall terms of depth whose value exceeds the value set for the first rain discard, measured in mm) and non-usable rainfall depth– NURD (rainfall in terms of depth whose value is equal or less than the value set for the first rain discard, measured in mm). By definition, each rainfall event will generate a rainfall depth.
The classification of the rainfall events was carried out after choosing rainfall depth for first flush used in the definition of NURE and NURD, which was set to2 mm, as recommended by NBR 15.527 (ABNT, 2007) for rainwater harvesting projects. It is important to note that other discard values can be used in this methodology, for example, 1 mm, 3 mm, 4 mm etc. These values depend on the need of washing the surface catchment, which it is related to on-site pollution where the system will be installed. It is emphasized that the discard must be carried out at the beginning of the first rainfall due to factors that are directly related to the rainwater quality that will be used, such as presence of inert materials, animal organic wastes, etc.
The exemplification of URD e NURD is shown in Figure 2. According to Figure 2A, on February 2, 2011, two rainfall events were recorded, both smaller than 2 mm. In the context of the proposed analysis, this measured rainfall would be classified as NURE and NURD, since the value was smaller than the discard volume adopted in this study (2 mm).
On March 9, 2011, two rainfall events were identified. The first one generated a measured rainfall lower than 2 mm and the second one generated a measured rainfall higher than 2 mm (Figure 2B). Thus, the first event and its respective measured rainfall were considered NURE and NURD and the second event, URE and URD.
On March 11, 2011, two rain events were verified, where the first one generated a measured rainfall higher than 2 mm and the second one, lower than 2 mm (Figure 2C). On this day, the first event and its respective measured rainfall (39.02 mm) were considered URE and URD, while the second, with measured rainfall of 0.69 mm, was considered NURE and NURD.
Aplication of normality test to data.
Aiming to test the adherence of the series of occurred rainfall depth, the series of usable rainfall depth and the series of non-usable rainfall depth to a normal distribution and to
define the use of the trend test (parametric or non-parametric), the Anderson-Darling Normality Test (A-D) was carried out, considering a level of significance of 5% and a confidence level of 95%. The Anderson-Darling test is described by Snedecor and Cochran (1989).
The software XLSTAT version 19.01 (free) was used to carry out the Anderson-Darling test. This software, offered by the company Addinsoft, is a complement that improves the analytical capabilities of Microsoft Excel, adding more than 100 statistics with procedures integrated to this program, such as regression, component analysis, normality test, test of trend etc. (YALTA; JENAL, 2009; KAHSAY et al., 2018).
If the p-value (probability that the test statistic is extreme value regarding the observed value when the null hypothesis is true) for the Anderson-Darling test is lower than the level of significance, it is concluded that the data does not follow a normal distribution (ALBIERO et al., 2012).
Aplication of trend test to the data set
The non-parametric test of two-tailed Mann-Kendall (MANN, 1945; KENDALL, 1975 apud KOUDAHE et al., 2017) was applied to the analysis of the increase or decrease in the trend of precipitation in the three series (total, usable and non-usable) with level of significance of 5% and confidence level of 95%. The XLSTAT software version 19.01 was used for the Mann-Kendall test.
Determination of rainwater harvesting coefficient (RWHC)
Considering the difficulty to obtain and systematize data from pluviographs, the need for optimization in the design of rainwater harvesting projects and aiming to reduce costs, the RWHC was proposed in this study. It is defined as a non-dimensional factor resulting from the relation between the effectively usable rainfall depth (EURD) and the sum of occurred rainfall depth (∑ORD).
The EURD is the amount of rainwater that will reach the rain storage tank, directly influencing its dimensioning after removal of non-usable rainfall depth(less than discard volume) and the first flush discarded from usable layer of water (higher than discard volume).
For the determination of the EURD, Equation 1 was proposed, and the calculations were performed monthly.
( )
( ) [
EULW= ΣOLW – ΣNULW+ NUE.d ] (1)
where: OLW: occurred layer of water (mm); NULW: non-usable layer of water (mm); NUE: Number of usable events; and d: discard volume (mm).
removal of the first two millimeters of the ULW, it was considered the use of an automatic first flush device, as recommended by NBR 15.527 (ABNT, 2007) and proposed by Vianna et al. (2013).
It is observed that certain rainwater harvesting systems use filters or screens for retention of coarse-particle solids, and these devices present variable losses according to the manufacturing technology. It should be noted that the study considers only the losses related to first flush discarded (2 mm), not taking into account the losses of preliminary devices for retention of coarse-particle solids that may be installed. The decision to not account for these losses was based on the fact that these are determined by the manufacturer, so if a device is used that generates additional loss of layer of water, it is sufficient to count it in the calculation of the effectively usable rainfall, inserting the efficiency factor of the device.
It was proposed the Equation 2 for calculation of RWHC:
EURD RWHC
ORD =
∑ (2)
where: RWHC: rainwater harvesting coefficient (non-dimensional). The RWHC has the function to adjust the daily rainfall data obtained from rain gauges. Before introducing precipitation into the methods for storage dimensioning, the value should be multiplied by a RWHC, which will reduce the rainfall available for use, and it will result in the effectively usable rainfall depth.
RWHCs were calculated for every month in the series and the normality test (Anderson-Darling test) of the distribution of RWHC was carried out, grouped annually and seasonally.
The Kruskal-Wallis variance test was applied, in order to evaluate the equality of the medians of the RWHC groups and to choose a representative RWHC.
The Kruskal-Wallis test is used to evaluate the equality of medians of two or more populations, offering a non-parametric alternative for analysis of variance (ANOVA), and using two alternative hypotheses: the medians of the populations are all equal (null hypothesis: H0: M1 = M2 = ... = Mk), or the medians are not all equal (alternative hypothesis: H1: Mi = Mj, i ≠ j) (KRUSKAL; WALLIS, 1952).
The test result compares the calculated p-value with the level of significance (0.05), and a p-value greater than the significance of the test will confirm the null hypothesis. Otherwise, if the calculated p-value belongs to the critical region, then this means that there are significant differences among the samples, accepting the alternative hypothesis. Thus, based on the test findings, it will be defined an annual RWHC for the rainy season and another one for the less rainy season.
A seasonal study of the coefficients was carried out, since in the study region there are two well defined rain periods, from December to May (high rain season) and from June to November (less rainy season). In this way, it is identified which period there is a greater occurrence of non-usable rainfall depth and if there is a large variation in the RWHCs between each period, since the increase in the number of non-usable rainfall depth may reduce the RWHC value.
The software R (version 2.14.1) of the R Foundation for Computational Statistics was used to perform the Kruskal-Wallis test. The software R presents a programming language and environment
to make statistical procedures, allowing the insertion of logical commands, performing calculations and generating graphs. It is an open source software, with proven robust techniques for data analysis (SABINO et al., 2014; FIGUEIREDO; BLANCO, 2016).
RESULTS AND DISCUSSIONS
After digitalizing 2944 pluviographs with rainfall records from January 2001 to December 2011, averaging 268 pluviographs per year, a dataset was subsequently generated in Microsoft Excel as the example shown in Figure 3, containing 4,105 rainfall events, of which 2,545 (62%) classified as URE and URD, and 1,560 (38%) are classified as NURE and NURD.
After generating a box plot graph with annual grouping of rainfall depth (Figure 4), the values of out the upper and lower limit established in the graph were considered outliers. These values indicate the high variability of the rain throughout the year. We highlight the existence of studies related to climate change where it is inferred that precipitation has been more oscillating with the occurrence of extreme events.
Figure 3. Table of data distribution.
The results of the Anderson-Darling adherence test (Figure 5) showed that the distribution of ORD (Figure 5A), URD (Figure 5B) and NRD (Figure 5C) did not follow a normal distribution, finding all a p-value lower than the level of significance of (5%), accepting the alternative hypothesis for the entire series. It means that, with confidence of 95%, the analyzed series does not adhere to a Gaussian distribution, and thus indicating the application of non-parametric tests for trend verification and evaluation of historical series should be considered.
The results of the A-D test, agree with those found in the study by Alves et al. (2013), where it was concluded that the distribution of the rainfall depth in the city of Cuiabá in State of Mato Grosso, Brazil, does not approach a Gaussian distribution.
The graphical representation of the series of occurred rainfall depth from 2001 to 2011 (Figure 6A) showed that the mean value remained higher than the median during the analysis period,
showing that the mean is more sensitive to the occurrence of extreme events, and the median is less sensitive to large variations. The graph of the moving average for three events did not show increasing or decreasing trend behavior.
The dispersion of occurred rainfall depth (Figure 6A) revealed the occurrence of great variability in the data during the 11 years of analysis (0.08 mm to 177.74 mm). However, based on the upper limits of the graph box plot (Figure 4), it was observed that 90.5% of the events presented rainfall depth lower than 20 mm, and only 9.5% had rainfall depth higher than 20 mm.
Although the characteristics of the URD series graph (Figure 6B) resemble those of the ORD series (Figure 6A), only 68% of the total occurred events exceeded the first flush depth (2 mm) throughout the study period.
Figure 5. Graphs of adherence probability of distribution layer of rainwater analyzed to a normal distribution. (A) Occurred rainfall depth; (B) usable rainfall depth; and (C) non-usable rainfall depth.
Considering the observed dispersion of the NURD series (Figure 6C), 57% of the 1560 occurred events are lower than 1 mm, which suggests that even considering a first flush value lower than the one used at study (2 mm), there is relevance in the analysis of non-usable events. It is important to note that of the total of occurred events from 2001 to 2011, approximately 38% are less than or equal to the discard (2 mm), and they should not be used in rainwater storage dimensioning.
After applying the Mann-Kendall test (two-tailed) it was verified that there is no significant increase or decrease trend of the ORD, URD and NURD series, with calculated p-value being 0.707, 0.619 and 0.166, respectively and considering the level of significance of 5%. This confirms the null hypothesis, within the range of critical values of ± 1.96 with extremities equal to ± 0.025. The results of the Mann-Kendall test were favorable to the determination of the RWHC, since the series showed no increase or decrease trend over the period evaluated.
Despite the application of the trend test in an 11-year series of rainfall data due to the availability of pluviometers stations, the World Meteorological Organization (OMM, 1989) recommends a series of 30 years of data to infer the existence of trend. It should be noted that this is a discretized analysis of rainfall events over time using 4,105 events for trend analysis in the total series, in which 2,545 events for a series of usable rainfall events and 1,560 events for the series of non-usable rainfall events. Ishihara et al. (2014), conducting an analysis of rainfall behavior in the area studied through the Mann-Kendall test, from 1978 to 2007, concluded that there was no increase or decrease trend of precipitation.
In addition, after comparing the monthly averages for the 11-year analysis and the monthly climatological average from 1961 to 1990 (Figure 7), there was a certain similarity in the behavior of the precipitation series.
The median of the monthly rainfall depth (grouped by month) confirmed the existence of a more rainy season (December to May) and one of less rainy season (June to November), as shown in Figure 8. The results showed that there is a similar behavior in the increase and/or decrease of rainfall depth and number of events considering the more rainy season. On the other hand, in the less rainy season, in September and November, the increase and/or decrease of the rainfall depth was not followed by increase and/or decrease in the number of events. During these months there were many occurrences of events with short rainfall depth.
Considering the data from the 11 years of analysis, the major rainfall events were identified, in which the largest amount occurred in March with 2 events per day (on average 54 events and average monthly rainfall of 434 mm). The smallest amount of events occurred in August (on average 15 events and average monthly rainfall of 110 mm), an average of 1 event every 2 days. Therefore, for rainwater harvesting, the results demonstrate that city of Belém does not have a marked dry season, allowing a use of rainwater throughout the year.
Although the number of discarded events represents 38% of the total from 2001 to 2011 (Figure 9), which corresponds to only 5% of the total precipitation, However, considering the 2 mm discard of each usable rainfall events, there is an increase of 17% in the discarded rainfall, corresponding to 22% of the total precipitation.
Figure 7. Comparison between the monthly climatological average (1961-1990) and a monthly average precipitation (2001 a 2011).
Figure 8. Medians of monthly usable and non-usable rainfall depth (by season seasonal from 2001 to 2011.
Determination of rainwater harvesting coefficient (RWHC)
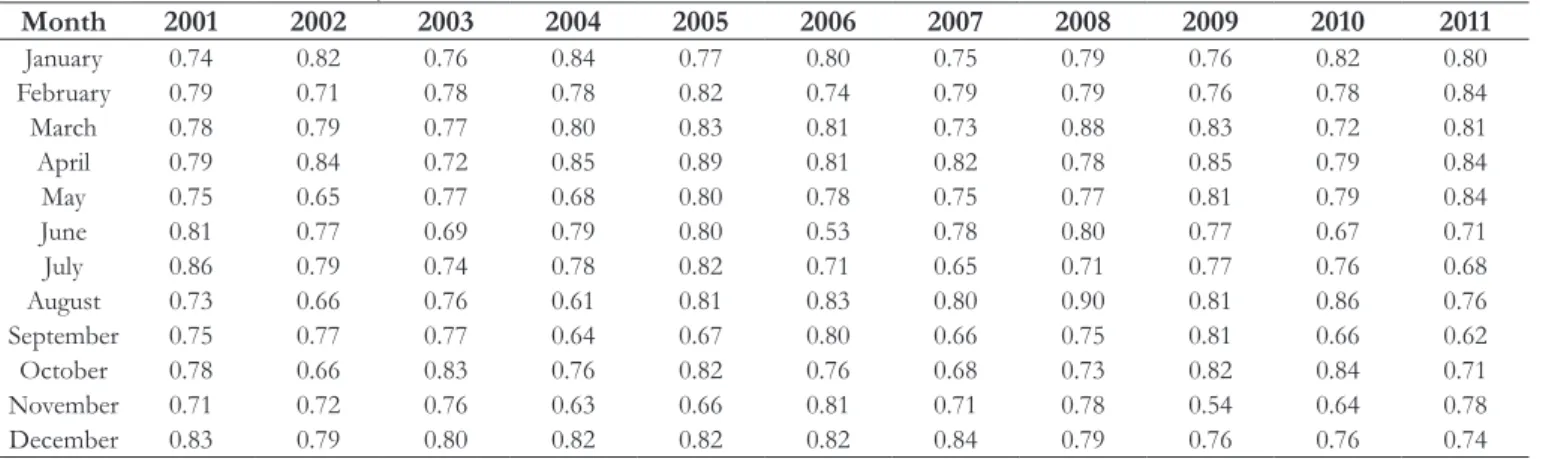
After applying the Equations 1 and 2, and considering the monthly data calculation, 132 RWHCs were generated (Table 1), which ranged from 0.53 (June 2006) to 0.90 (August 2008). Furthermore, from the total rainfall in June 2006, 47% of the volume generated would be used in the first flush system, and of the total rainfall in August 2008, 10% of the volume generated would be discarded as first flush.
The results of the Anderson-Darling normality test (Table 2) showed that three annual RWHC groups do not adhere to a Gaussian distribution, justifying the use of non-parametric tests for analysis of variance.
The analysis of measures of central tendency (Figure 10) showed that the RWHC distribution has a close mean and median, 0.77 and 0.78 respectively. However, since three of the RWHC distributions did not adhere to a Gaussian distribution, the Kruskal-Wallis non-parametric variance test was applied, where it was verified the homogeneity of the medians (null hypothesis), with a calculated p-value 0.580, higher than the level of significance of the test (0.05).
Based on the results of the Kruskal-Wallis test, it is proposed the use of the median RWHC (0.78) to represent the distribution. Thus, it is inferred that of the total rainfall in the study area, 78% will effectively reach the rainwater storage, considering a 2 mm first flush.
Considering the average annual precipitation of the city of Belém (2,834 mm), there was a reduction of 623.48 mm after applying the coefficient, corresponding to 22% of the total layer of water.
Considering the distribution of the RWHCs gathered seasonally, the Anderson-Darling test findings (Table 3) showed that two of the RWHC groups in the rainy season and two in the low rainy season did not adhere to a Gaussian distribution, indicating the application of non- parametric tests for the analysis of variance.
Because of there was not adherence of all RWHC groups of the rainy season and the less rainy season to a normal distribution,
Figure 10. Dispersion of monthly RWHCs from 2001 a 2011.
Table 1. Distribution of monthly RWHCs from 2001 to 2011.
Month 2001 2002 2003 2004 2005 2006 2007 2008 2009 2010 2011
January 0.74 0.82 0.76 0.84 0.77 0.80 0.75 0.79 0.76 0.82 0.80
February 0.79 0.71 0.78 0.78 0.82 0.74 0.79 0.79 0.76 0.78 0.84
March 0.78 0.79 0.77 0.80 0.83 0.81 0.73 0.88 0.83 0.72 0.81
April 0.79 0.84 0.72 0.85 0.89 0.81 0.82 0.78 0.85 0.79 0.84
May 0.75 0.65 0.77 0.68 0.80 0.78 0.75 0.77 0.81 0.79 0.84
June 0.81 0.77 0.69 0.79 0.80 0.53 0.78 0.80 0.77 0.67 0.71
July 0.86 0.79 0.74 0.78 0.82 0.71 0.65 0.71 0.77 0.76 0.68
August 0.73 0.66 0.76 0.61 0.81 0.83 0.80 0.90 0.81 0.86 0.76
September 0.75 0.77 0.77 0.64 0.67 0.80 0.66 0.75 0.81 0.66 0.62
October 0.78 0.66 0.83 0.76 0.82 0.76 0.68 0.73 0.82 0.84 0.71
November 0.71 0.72 0.76 0.63 0.66 0.81 0.71 0.78 0.54 0.64 0.78
December 0.83 0.79 0.80 0.82 0.82 0.82 0.84 0.79 0.76 0.76 0.74
Table 2. Results of adherence test of Anderson-Darling for the RWHCs gathered annually.
Year Calculatedp-value Accepted Hypothesis
2001 0.921 Null
2002 0.147 Null
2003 0.478 Null
2004 0.061 Null
2005 0.007 Alternative
2006 <0.005 Alternative
2007 0.824 Null
2008 0.106 Null
2009 <0.005 Alternative
2010 0.415 Null
the Kruskal-Wallis variance test was applied to verify the equality of the medians.
For the rainy season, the results of the variance test (p-value 0.376) indicated the equality of the medians of the groups, accepting the null hypothesis, and the equality of the medians was confirmed in the test applied to the RWHC groups of the less rainy season (p-value 0.571).
Using the Kruskal-Wallis test, it was obtained an average RWHC of 0.79 for the rainy season (December to May) and an average RWHC for the low rainy season of 0.76. Then, it would be discarded 21% of the rainfall in the rainy season, and in the low rainy season, the discard would increase to 24%.
In the end, it is recommended the use of 0.78 as a rain correction factor, considering the proximity of the seasonal RWHCs.
CONCLUSIONS
In order to perform the study, a rainfall event was defined according to the characteristics of the pluviograph generated at the weather station. Then, rainfall rain event was defined as any precipitation captured in the rain gauge that generated displacement on record lever (pen), and consequently caused a change of the plotted chart, with well-defined initial and final times.
The systematization of rainfall data provided means to identify the rain events that would have been discarded entirely by a first flush device. These events did not reach 2 mm of rainfall depth, which is the first flush value recommended by NBR 15.527 (ABNT, 2007) for washing out rainwater harvesting systems. The number of non-usable events represented 38% in relation to the total of events during the 11 years of analysis.
The results from the Anderson-Darling test applied to this study’s series of occurred rainfall depth, usable rainfall depth and non-usable rainfall depth supported the use the non-parametric Mann-Kendall test, as the series did not follow a Normal distribution.
It was observed that the series of occurred rainfall depth usable rainfall depth and non-usable rainfall depth did not show a tendency to increase or decrease over time, supporting the use of a single rainwater harvesting coefficient for the whole series.
The analysis of the historical rainfall series showed that the city of Belém presents a great potential for rainwater harvesting,
Table 3. Results of Anderson-Darling adherence test for the RWHCs gathered seasonally.
Year Calculated p-value (rainy season) Accepted Hypothesis Calculated p-value (low rainy season) Accepted Hypothesis
2001 0.594 Null 0.867 Null
2002 0.366 Null 0.150 Null
2003 0.508 Null 0.521 Null
2004 0.126 Null 0.096 Null
2005 0.491 Null 0.024 Alternative
2006 0.050 Alternative 0.071 Null
2007 0.296 Null 0.332 Null
2008 0.006 Alternative 0.381 Null
2009 0.101 Null 0.006 Alternative
2010 0.394 Null 0.217 Null
2011 0.124 Null 0.798 Null
identifying a rainy season and a less rainy season, and absence of a marked dry season throughout the year.
The results of the Anderson-Darling test in the annual and seasonal series of rain correction coefficients indicated which test of variance (parametric or non-parametric) best fits the data analysis, serving as support to choose a RWHC that represents the data set. For this case, the Kruskal-Wallis test was used, evaluating the equality of the medians for the coefficients.
Considering the removal of the non-usable events and the 2 mm first flush from each usable event (above 2 mm), three rain correction coefficients were calculated: one that determines a effectively usable rainfall depth that can be used throughout the year (0.78); one that determined the effectively rainfall depth in the rainy season (0.79); and another that determined the effectively rainfall depth in the less rainy season (0.76). However, due to the small variation of the determined RWHCs, a sole coefficient of 0.78 was proposed in the study.
The use of the rainwater harvesting coefficient will optimize the storage tank design in rainwater harvesting systems that use automatic devices to discard the first rain from the catchment area, resulting in a reduction of the precipitation value used as input for rainwater storage volume calculation. As a result only the effectively usable rainwater depth is considered for the system’s design.
The methodology presented may be used for the determination of the rainwater harvesting coefficient for any first flush value, with these to variables having an inverse correlation.
REFERENCES
ABNT – ASSOCIAÇÃO BRASILEIRA DE NORMAS TÉCNICAS. NBR 15527: água de chuva: aproveitamento de coberturas em áreas urbanas para fins não potáveis: requisitos. Rio de Janeiro, 2007.
AKTER, A.; AHMED, S. Potentiality of rainwater harvesting for an urban community in Bangladesh. Journal of Hydrology, v. 528, p. 84-93, 2015. http://dx.doi.org/10.1016/j.jhydrol.2015.06.017.
exponencial. Revista Ciência Agronômica., v. 43, n. 1, p. 86-95, 2012. http://dx.doi.org/10.1590/S1806-66902012000100011.
ALVES, A. V. P.; SANTOS, G. B. S.; MENEZES FILHO, F. C. M.; SANCHES, L. Análise dos métodos de estimativa para os parâmetros das distribuições de Gumbel e GEV em eventos de precipitações máximas na cidade de Cuiabá− MT. Revista Eletrônica de Engenharia Civil, v. 6, n. 1, p. 32-43, 2013.
ALVES, F.; KÖCHLING, T.; LUZ, J.; SANTOS, S. M.; GAVAZZA, S. Water quality and microbial diversity in cisterns from semiarid areas in Brazil. Journal of Water and Health, v. 12, n. 3, p. 513-525, 2014. http://dx.doi.org/10.2166/wh.2014.139. PMid:25252355.
ANDRADE NETO, C. O. Aproveitamento imediato da água de chuva. Revista Eletrônica de Gestão e Tecnologias Ambientais, v. 1, n. 1, p. 73-86, 2013. http://dx.doi.org/10.17565/gesta.v1i1.7106.
ASSAYED, A.; HATOKAY, Z.; AL-ZOUBI, R.; AZZAM, S.; QBAILAT, M.; AL-ULAYYAN, A.; SALEEM, M. A.; BUSHNAQ, S.; MARONI, R. On-site rainwater harvesting to achieve household water security among rural and peri-urban communities in Jordan. Resources, Conservation and Recycling, v. 73, p. 72-77, 2013. http:// dx.doi.org/10.1016/j.resconrec.2013.01.010.
CAMPOS, M. M.; AZEVEDO, F. R. Aproveitamento de águas pluviais para consumo humano direto. Jornal Eletrônico, v. 5, n. 1, p. 23-42, 2013.
CAVALCANTE, A. L.; SILANS, A. M. B. P. Modelo estocástico de desagregação da chuva diária em eventos sub-diários para a região litorânea do Nordeste. Revista Brasileira de Recursos Hídricos, v. 17, n. 3, p. 38-48, 2012.
CHAIB, E. B.; RODRIGUES, F. C.; MAIA, B. H.; NASCIMENTO, N. O. Avaliação do potencial de redução do consumo de água potável por meio da implantação de sistema de aproveitamento de água de chuva em edificações unifamiliares. Revista Brasileira de Recursos Hídricos, v. 20, n. 3, p. 605-614, 2015. http://dx.doi. org/10.21168/rbrh.v20n3.p605-614.
FIGUEIREDO, N. M.; BLANCO, C. J. C. Water level forecasting and navigability conditions of the Tapajós River - Amazon - Brazil. Houille Blanche, n. 3, p. 53-64, 2016. http://dx.doi.org/10.1051/ lhb/2016031.
GARCÍA-MONTOYA, M.; BOCANEGRA-MARTÍNEZ, A.; NÁPOLES-RIVERA, F.; SERNA-GONZÁLEZ, M.; PONCE-ORTEGA, J. M.; EL-HALWAGI, M. M. Simultaneous design of water reusing and rainwater harvesting systems in a residential complex. Computers & Chemical Engineering, v. 76, p. 104-116, 2015. http://dx.doi.org/10.1016/j.compchemeng.2015.02.011.
GOMES, U. A. F.; DOMENECH, L.; PENA, J. L.; HELLER, L.; PALMIER, L. R. A captação de água de chuva no Brasil: novos aportes a partir de um olhar internacional. Revista Brasileira de Recursos Hídricos, v. 19, n. 1, p. 7-16, 2014. http://dx.doi.org/10.21168/ rbrh.v19n1.p7-16.
HASHIM, H.; HUDZORI, A.; YUSOP, Z.; HO, W. S. Simulation based programming for optimization of large-scale rainwater harvesting system: Malaysia case study. Resources, Conservation and Recycling, v. 80, p. 1-9, 2013. http://dx.doi.org/10.1016/j. resconrec.2013.05.001.
ISHIHARA, J. H.; FERNANDES, L. L.; DUARTE, A. A. A M.; DUARTE, A. R. C. L. M.; PONTE, J. X.; LOUREIRO, G. E. Quantitative and spatial assessment of precipitation in the Brazilian Amazon (Legal Amazon) (1978 to 2007). Revista Brasileira de Recursos Hídricos, v. 19, n. 1, p. 29-39, 2014. http://dx.doi.org/10.21168/ rbrh.v19n1.p29-39.
KAHSAY, K. D.; PINGALE, S. M.; HATIYE, S. D. Impact of climate change on groundwater recharge and base flow in the subcatchment of Tekeze basin, Ethiopia. Groundwater for Sustainable Development, v. 6, p. 121-133, 2018. http://dx.doi.org/10.1016/j. gsd.2017.12.002.
KENDALL, M. G. Rank correlation measures. London: Charles Griffin, 1975. 220 p.
KOUDAHE, K.; KAYODE, A. J.; SAMSON, A. O.; ADEBOLA, A. A.; DJAMAN, K.; ADEBOLA, A. A.; DJAMAN, K. Trend analysis in standardized precipitation index and standardized anomaly index in the context of climate change in Southern Togo. Atmospheric and Climate Science, v. 7, n. 4, p. 401-423, 2017. http:// dx.doi.org/10.4236/acs.2017.74030.
KRUSKAL, H. W.; WALLIS, W. A. Use of ranks in one-criterion variance analysis. Journal of the American Statistical Association, v. 47, n. 260, p. 583-621, 1952. http://dx.doi.org/10.1080/01621459 .1952.10483441.
LIM, K. Y.; JIANG, S. C. Reevaluation of health risk benchmark for sustainable water practice through risk analysis of rooftop-harvested rainwater. Water Research, v. 47, n. 20, p. 7273-7286, 2013. http://dx.doi.org/10.1016/j.watres.2013.09.059. PMid:24238739.
MAHMOUD, W. H.; ELAGIB, N. A.; GAESE, H.; HEINRICH, J. Rainfall conditions and rainwater harvesting potential in the urban area of Khartoum. Resources, Conservation and Recycling, v. 91, p. 89-99, 2014. http://dx.doi.org/10.1016/j.resconrec.2014.07.014.
MANN, H. B. Econometrica. The Econometric Society, v. 13, n. 3, p. 245-259, 1945.
MURÇA, M.; JULIO, M.; MORUZZI, R. Metodologia de otimização para o dimensionamento de reservatórios de águas pluviais. Revista Brasileira de Recursos Hídricos, v. 19, n. 2, p. 29-40, 2014. http:// dx.doi.org/10.21168/rbrh.v19n2.p29-40.
NAWAZ, M.; HAN, M. Y.; KIM, T. I.; MANZOOR, U.; AMIN, M. T. Silver disinfection of Pseudomonas aeruginosa and E. coli in rooftop harvested rainwater for potable purposes. The Science of the Total Environment, v. 431, p. 20-25, 2012. http://dx.doi.org/10.1016/j. scitotenv.2012.05.022. PMid:22664534.
OLIVEIRA, P. A. C.; MATTHIENSEN, A.; ALBINO, J. J.; BASSI, L. J.; GRINGS, V. H.; BALDI, P. C. Aproveitamento da água da chuva na produção de suínos e aves. Concórdia: Embrapa, 2012. 38 p.
OMM – ORGANIZAÇÃO METEOROLÓGICA MUNDIAL. Calculation of monthly and anual 30-year standard normals. Geneva, 1989. (WMO Technical Document, 341; WCDP, 10). Available from: <http://www.posmet.ufv.br/wp-content/uploads/2016/09/ MET-481-WMO-341.pdf>. Access on: 21 jan. 2018.
PROENÇA, L. C.; GHISI, E. Water end-uses in Brazilian Office buildings. Resources, Conservation and Recycling, v. 54, n. 8, p. 487-500, 2010. http://dx.doi.org/10.1016/j.resconrec.2009.10.005.
SABINO, C. V. S.; LAGE, L. V.; ALMEIDA, K. C. B. Uso de métodos estatísticos robustos na análise ambiental. Engenharia Sanitaria e Ambiental, v. 19, n. spe, p. 87-94, 2014. http://dx.doi. org/10.1590/S1413-41522014019010000588.
SANCHES FERNANDES, L. F.; TERÊNCIO, D. P.; PACHECO, F. A. Rainwater harvesting systems for low demanding applications. The Science of the Total Environment, v. 529, p. 91-100, 2015. http:// dx.doi.org/10.1016/j.scitotenv.2015.05.061. PMid:26005753.
SNEDECOR, G. W.; COCHRAN, W. G. Statistical methods. Ames: Iowa State University Press, 1989. 589 p.
SOUZA, S. H. B.; MONTENEGRO, S. M. G. L.; SANTOS, S. M.; PESSOAS, S.; NÓBREGA, R. Avaliação da qualidade da água e da eficácia de barreiras sanitárias em sistemas para aproveitamento de águas de chuva. Revista Brasileira de Recursos Hídricos, v. 16, n. 3, p. 81-93, 2011. http://dx.doi.org/10.21168/rbrh.v16n3.p81-93.
VELOSO, N. S. L.; MENDES, R. L. R. Aproveitamento da água da chuva na Amazônia: experiências nas ilhas de Belém/PA. Revista Brasileira de Recursos Hídricos, v. 19, n. 1, p. 229-242, 2014. http:// dx.doi.org/10.21168/rbrh.v19n1.p229-242.
VIANNA, M. R.; KAHEY, L. B.; DA SILVA, F. J. Protótipo de dispositivo para descarte da parcela de escoamento inicial da água pluvial captada em coberturas visando ao seu aproveitamento para fins não potáveis: concepção e estudo experimental. In: CONGRESSO BRASILEIRO DE ENGENHARIA SANITÁRIA E AMBIENTAL, 27., 2013, Goiânia. Anais... Rio de Janeiro: ABES, 2013. Available from: <https://www.researchgate.net/ publication/265851636_IV-020>. Access on: 23 jan. 2018.
YALTA, A. T.; JENAL, O. On the importance of verifying forecasting results. International Journal of Forecasting, v. 25, n. 1, p. 62-73, 2009. http://dx.doi.org/10.1016/j.ijforecast.2008.07.002.
Authors contributions
Jairo dos Passos Corrêa: Systematization of data in the Microsoft Excel software; references research; writing process.
Lindemberg Lima Fernandes: Study advisor; statistics, writing process.
Cláudio José Cavalcante Blanco: Rain gauge recorder charts colection and scanning; writing process.