FILIPE RIBEIRO FERREIRA DA SILVA
ELECTRON DRIVEN REACTIONS IN COMPLEXES
EMBEDDED IN SUPERFLUID HELIUM DROPLETS
A thesis submitted to the University of Innsbruck for the doctor degree in Natural Sciences, Physics
and New University of Lisbon for the doctor degree in Physics, Atomic and Molecular Physics
to my dear friend
“But the real way to get happiness is by giving out happiness to other people. Try and leave
this world a little better than you found it and when your turn comes to die, you can die happy
in feeling that at any rate you have not wasted your time but have done your best.
"Be Prepared" in this way, to live happy and to die happy-- stick to your Scout promise
always-- even after you have ceased to be a boy-- and God help you to do it.”
ii
Acknowledgments
To Professor Paul Scheier and to Professor Paulo Limão-Vieira, for their constant support, encouragement, exceptional and strong supervision. For the confidence in all the work I have been involved in, as well as for the opportunities to contact others groups throughout the scientific community. I am also thankful to Professor Tilmann Märk, for his encouragement and the way that he supports students, giving everyday valuable scientific advice. The strong cooperation between the Institute of Ionic Physics at Innsbruck University by Professor Scheier and Professor Märk and at the CEFITEC - Centre of Physics and Technological Research at the New University of Lisbon by Professor Limão-Vieira, made possible to develop my doctoral studies in Innsbruck.
To Doctor Stephan Denifl, post-doc in the Nano-Bio Physics group at the University of Innsbruck, a colleague that always had an answer to my doubts, everyday some minutes to help, discuss and advice me. With him I had strong scientific discussions that increased my physical-chemical knowledge.
To Professor Andrew Ellis from Leicester University and to Professor Olof Echt from New Hampshire University, for the strong support in the preparation of publications concerning the results discussed in this thesis. Also to Doctor Sylwia Ptasinska from Open University, Milton Keynes, UK for the opportunities to discuss results during her stays in Innsbruck. With these three acclaimed scientists I had the chance to learn and discuss science, together with Professor Eugen Illenberg from the Freie Universität Berlin, Professor Diethard Bohme from York University, Toronto and Professor Leon Sanche from Sherbrooke University.
To Doctor Alexander Giuliani at Synchrotron Soleil, Paris, for the chance that he gave me to visit his lab, work with him and learn the technique Atmospheric Pressure Photoionisation.
iii Members of the staff at the New University of Lisbon, Mrs Maria Helena Rodrigues, Department of Physics; Mrs Paula Correia and Mrs Ana Cruz, Cefitec; and at University of Innsbruck, Mrs Arntraud Bacher, Mr Markus Peimpolt, Mrs Sandra Naschberger, Mrs Leonie Werner, Institut of Ionic Physics.
A special thank you to my best friend in Austria and former colleague, Doctor Philipp Sulzer, for the pleasuring conversations around a glass of red wine or a beer, and for his steady and friendly advice. Philipp was a strong and crucial support during my stay in Innsbruck. To Achim Edtbauer, for his friendship both in the university and sharing the same flat. These two friends have contributed for happy days in Innsbruck.
A warm thank you to all my great friends in Portugal, I will not list them because of the number and to avoid forgetting anyone! All of them were very important during these two years. Without their support this time would have been difficult and long. For all of them a tight hug!
To my friends that I met in Innsbruck, for the great and happy time, people from different countries that gave me the opportunities to learn different cultures and increase my friendships in the world.
To my special family 1100, my Scout group, my blues that lost one leader during this time but at the same time were always with me, always present in my heart.
To everybody that followed my blog: flipnotirol.blogspot.com, my board diary that testifies in a funny way this life trip throughout Austria. In particular, to my uncle Francisco and my aunt Salete, daily readers and often the bridge between those that don’t use internet!
iv
Abstract
The research work performed under the course of this thesis at the Nano-Bio Physics Group of the Institute of Ion Physics and Applied Physics, University of Innsbruck, deals exclusively with electron driven reactions in complexes embedded in helium nanodroplets. Helium nanodroplets provide a special and exotical environment that is not reachable with other techniques. The cold environment of the helium nanodroplets (0.38K), is a perfect tool to study complex systems in their ro-vibrational ground state. Dopants are added to the helium nanodroplets in a pick up cell allowing to control accurately the growing of clusters‘ size in helium droplets. The research activities described in this thesis cover the interaction of low and intermediate energies (0 – 100 eV) electrons with a wide range of simple and complex molecules in a very cold environment. Electron impact ionisation and free electron attachment to different systems were studied. Different halogenated molecules were used to study the size of solvated cations and anions. Clusters of the rare gas argon were also investigated and compared with argon cluster ions formed upon electron impact of pure neutral argon clusters. Several biomolecules and molecules with biological interest have been studied, these including: some amino acids as Glycine, L-alanine and L-serine embedded in helium nanodroplets. Several features were assigned as helium solvation and fragmentation. In the case of L-serine, a magic octamer S8H+ cluster was observed and identified. Free electron
v
Symbols and acronyms
Symbol Description
CH5; CH5/DF; CH5-DF Double Focusing Mass Spectrometer
eV electron Volt
AX; AB diatomic molecule
es electron scattered
ee electron ejected
e electron
ψ vibrational wave function
QET quasi equilibrium theory
RRKM Rice–Ramsperger–Kassel–Marcus theory
Ec Coulomb energy
Eb binding energy
DE dissociation energy
IP ionisation potential
ΔH°f heat of formation
M molecule mass / neutral molecule
M- negative ion
EA electron affinity
VDE vertical detachment energy
VEA vertical electron attachment
LUMO lowest unoccupied molecular orbital HOMO highest occupied molecular orbital
MO molecular orbital
μ reduced mass of electron
ℓ angular momentum
υ vibrational level
D bond dissociation energy
bar bar (105 Pascal)
Symbols and acronyms
vi
m meter
mm millimeter (10-3 meter)
Pt Platinum
He Helium
K Kelvin
m3 cubic meter
SF6 Sulfur hexafluoride
A Ampère
FWHM Full-Width at Half Maximum
mT milli-Tesla (10-3 Tesla)
kV kilo-Volt (103 Volt)
V Volt
BE reverse Nier-Johson geometry B field / E field
B magnetic field
E electrical field
N2 molecular nitrogen
° degrees centigree
MIKE Mass Analyzed Ion Kinetic Energy
l/s liter per second
μm micrometer (10-6 meter) s second(s)
q particle charge
F Coulomb interaction
r distance between two charges / distance between electron
molecule
ε0 vacuum permeability
m* apparent mass
UA accelerating voltage
A* excited atom
M* excited molecule
1p single particle one resonance
vii
α polarisation of molecule
DEA dissociative electron attachment
E* excess energy
DNA Deoxyribonucleic acid
RNA Ribonucleic acid
n cluster size
S2H+ protonated L-serine dimer
S8H+ protonated L-serine octamer
CH3COOD deuterated Acetic acid
CH3COOH Acetic acid
MeV mega electron Volt (106 eV) i. e. in other words (id est) et. al. and others (et alii)
e. g. for example (exempli gratia) mK milli Kelvin (10-3K)
σg bonding molecular orbital
σu* antibonding molecular orbital
Ø diameter
EAad adiabatic electron affinity
h Plank’s constant (6.6×10⁻³⁴ J/s)
ħ reduced Planck’s constant (1.05×10⁻³⁴ J/s)
Å Angstrom (10-10m)
EII electron impact ionisation
viii
Table of contents
Acknowledgments ...ii
Abstract...iv
Table of contents ...viii
List of figures ...xii
List of tables ...xvii
Chapter 1 ... 1
Introduction ... 1
References ... 6
Chapter 2 ... 7
Ionisation ... 7
2.1. Electron impact ionisation ... 7
2.1.1. Ionisation processes... 8
2.1.2. Frank-Condon Principle ... 8
2.1.3. Coulomb explosion... 11
2.1.4. Ion formation ... 12
2.1.4.1. Parent ions ... 12
2.1.4.2. Fragment ions ... 13
2.1.4.3. Metastable ions ... 13
2.1.4.4. Doubly charged ions... 14
2.1.4.5. Rearrangement ions ... 15
2.1.5. Ionisation in clusters... 15
2.2. Electron attachment ...16
2.2.1. Electron scattering ... 16
2.2.1.1. Elastic scattering... 16
2.2.1.2. Inelastic scattering ... 16
2.2.2. Electron affinity... 17
2.2.3. Temporary Negative Ion formation... 18
2.2.3.1. One particle resonances ... 20
2.2.3.1.1. Shape or single-particle resonances... 20
2.2.3.1.2. Nuclear-excited Feshbach resonances ... 21
2.2.3.2. Two particle one hole resonances... 22
2.2.3.2.1. Core excited shape resonances or open channel resonances ... 22
2.2.3.2.2. Core excited Feshbach or core excited close channel resonances... 22
2.2.4. Decomposition processes of TNI ... 23
2.2.4. Decomposition processes of TNI under aggregation ... 24
2.2.4. Energy balance for dissociative electron attachment ... 26
2.3. References ... 28
Chapter 3 ... 29
ix
3.1. Introduction ... 29
3.2. Types of clusters... 29
3.3. Clusters sources ... 30
3.4. Supersonic expansion ... 31
3.5. Clusters formation ... 33
3.5.1. Cluster nucleation ... 34
3.5.2. Cluster growth ... 34
3.6. Helium clusters ... 35
3.7. Molecular clusters in helium droplets ... 40
3.8. Conclusions ... 40
3.9. References ... 41
Chapter 4 ... 42
Experimental Set Up... 42
4.1. “Pre-ionisation region” set-up ... 42
4.2. “Ionisation and Post-ionisation region” set-up... 45
4.3. References ... 54
Chapter 5 ... 55
On the size of ions solvated in helium clusters ... 55
5.1. Introduction ... 55
5.2. Results ... 57
5.2.1. Positive ion mass spectra... 57
5.2.2. Negative ion mass spectra ... 59
5.2.3. Ion yield versus number of solvent atoms ... 61
5.3. Discussion... 63
5.4. Conclusions ... 69
5.5. Appendix ... 70
A classical model for the relation between ns and the ionic radius... 70
5.5. References ... 72
Chapter 6 ... 75
Argon clusters embedded in helium nanodroplets ... 75
6.1. Introduction ... 75
6.2. Results and Discussion ... 78
6.3. Conclusions ... 85
6.4. References ... 86
Chapter 7 ... 88
Electron impact ionisation and free electron attachment to acetic acid embedded in helium nanodroplets ... 88
7.1. Introduction ... 88
7.2. Results and discussion ... 90
7.2.1. Positive ion mass spectra... 90
7.2.2. Negative ion mass spectra for (CH3COOH)n... 93
7.2.3. Anions with attached helium atoms ... 97
7.2.4. Anion efficiency curves... 98
Table of contents
x
7.4. References ... 102
Chapter 8 ... 104
Electron impact ionisation and free electron attachment to amino acids embedded in helium nanodroplets ... 104
8.1. Formation of the ‘magic’ L-serine octamer in helium nanodroplets... 104
8.1.2. Introduction ... 104
8.1.3. Electron impact ionisation to L-serine... 105
8.1.4. Conclusions ... 107
8.1.5. References ... 109
8.2. Free electron attachment to amino acids clusters in helium nanodroplets: Glycine, L-alanine and L-serine... 110
8.2.1. Introduction ... 110
8.2.2. Results and discussion ... 111
8.2.2.1. Reaction products ... 111
8.2.2.2. Amino acid cluster anions with attached helium atoms ... 114
8.2.2.3. Anion efficiency curves... 117
8.2.3. Conclusions ... 119
8.2.4. References ... 121
Chapter 9: Conclusions and future work ... 122
9.1. Conclusions ... 122
9.1.1. Solvated ions ... 122
9.1.2. Argon clusters... 122
9.1.3. EII and FEA to acetic acid... 123
9.1.4. EII and FEA to amino acids... 123
9.1.4.1. EII to L-serine... 123
9.1.4.2. FEA to glycine, L-alanine and L-serine... 124
9.2. Future work ... 125
9.2.1. Different amino acids in helium nanodroplets ... 125
9.2.2. Molecular synthesis ... 127
9.2.3. Peptide bond formation ... 128
9.3. References ... 132
Appendix I: List of publications... 133
Papers (18)... 133
Papers in preparation(5)... 135
Oral communications (6) ... 135
International Conference Abstracts (37) ... 136
Appendix II: Curriculum vitae ... 140
Personal Data... 140
Education / qualifications ... 140
Short Term Scientific Missions ... 141
Teaching / Supervising Work ... 142
Member of projects...142
Joint collaboration research projects member ... 142
Research networks... 142
xii
List of figures
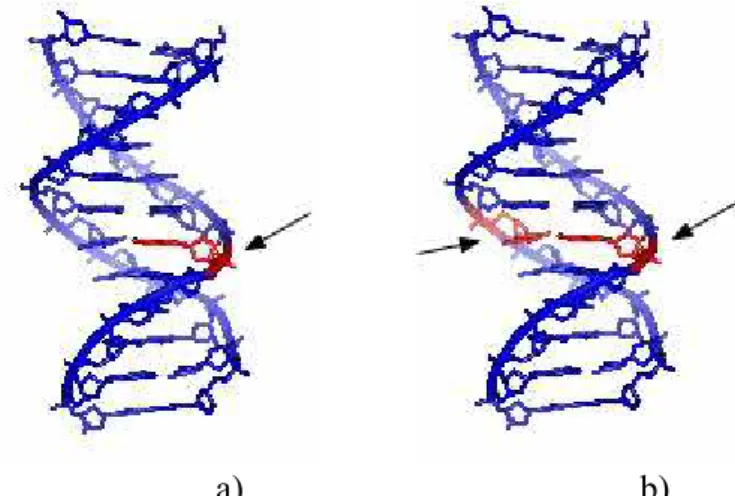
Figure 1.1 – Single (a)) and double (b)) strand breaks, SSBs and DSBs, respectively, pointed with arrows Picture from en.wiki ... 3 Figure 2.1 – Schematic potential energy diagram of H2 showing the neutral ground state and
higher states representing the exited or double ionized molecule, after [2.3] ... 10 Figure 2.2 – Schematic diagrams illustrating the positive and negative values of EA and the relation of EA to VAE and VDE, after [2.5] ... 18 Figure 2.3 – Electronic configuration for a one particle resonance and for a two particle one hole resonance ... 19 Figure 2.4 – The different types of resonances with respect to their energy in comparison to the neutral (excited) molecule ... 20 Figure 2.5 – Effective interaction potential for an electron approaching a neutral molecule, after [2.15] ... 21 Figure 2.6 – Schematic potential energy diagram showing the formation of core excited shape (open channel) resonances and core excited Feshbach (close channel) resonances, after [2.15]
... 23 Figure 2.7 – Illustration of some electron induced processes in clusters induced by low energy electrons: dissociative attachment, evaporative attachment and inelastic scattering, after [2.17, 2.18]... 25 Figure 2.8 – Schematic potential energy diagram illustrating DA in the gas phase and in clusters. The right side shows the cross section for the negative ion formed in gas phase and in clusters, after [2.15] ... 26 Figure 2.9 – Born-Oppenheimer potential energy curves associated with electron attachment and subsequent electronic dissociation, after [2.19]... 26 Figure 3.1 – Velocity distributions for different Mach numbers as a function of the
xiii
Figure 3.4 – Molecular orbital diagram for the He2 dimer... 36
Figure 3.4 – Pressure temperature phase diagram for 4He with isentropes, after [3.12] and references therein... 37
Figure 3.5 – Mean number size N4 and liquid droplets diameter DD of 4He formed in different types of continuous modes of jet operation, after [3.13] ... 38
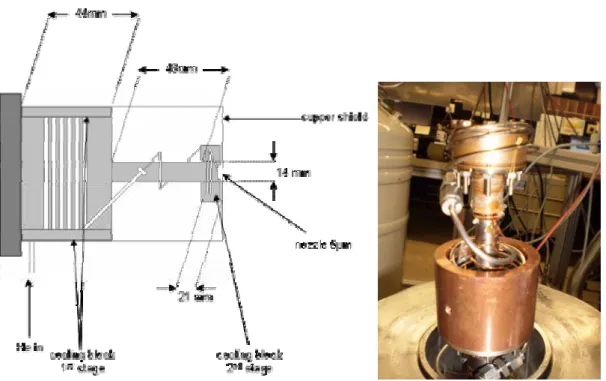
Figure 4.1a – Schematic draw and picture of cluster source, with 1st and 2nd cooling stages.. 44
Figure 4.1b – Top of the cold head with the nozzle in the centre and silicon diode sensor model DT-470 ... 44
Figure 4.2 – Oven and pick up cell for solid samples ... 44
Figure 4.3 – Ion source, adapted from [4.9] ... 46
Figure 4.4 – CH5 experiment scheme; P1 to P6 - pumps, S1, S2 - slits, EL - Einzel lenses, FFR - Free Field Region, SEM - Chaneltron type Secondary Electron Multiplier, B-Field - magnetic sector field, E-Field - electrical sector field... 47
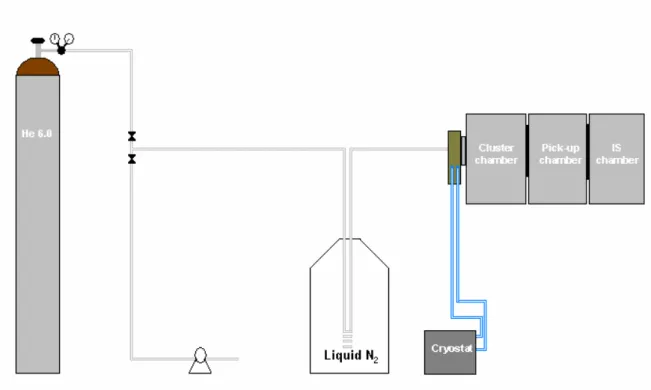
Figure 4.5 – Installation scheme of helium inlet and position of the different chambers ... 48
Figure 4.6 – LabView main window ... 49
Figure 4.7 – LabView Mass Scan window... 50
Figure 4.8 – LabView Mass Cluster Scan window ... 50
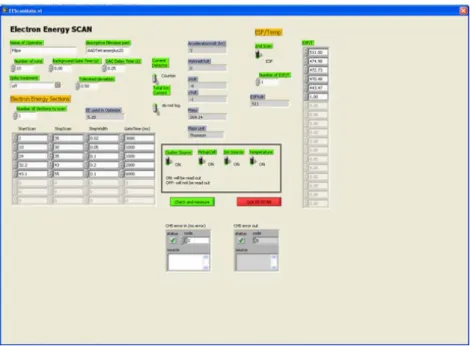
Figure 4.9 – LabView Electron Energy Scan window ... 51
Figure 4.10 – LabView MIKE Scan window ... 51
Figure 5.1 - Mass spectra of cations resulting from ionisation of helium droplets doped with I2 (panels a and b) and CH3I (panel c). Note the logarithmic ordinate and the break in the abscissa. Panel b was recorded with increased partial I2 pressure, thus increasing the likelihood of doping with more than one neutral molecule. Most prominent are cluster ion series Hen+ (marked black), I+Hen (red), I2+Hen (blue) and CH3I+Hen (green). Hatched peaks flag ions that contain significant contributions from two ion series. For example, He35+ and CHI+ both contribute to the peak at 140 u ... 59 Figure 5.2 - Mass spectra of anions resulting from attachment of electrons to helium droplets doped with a) C6H5Br, b) CCl4, and c) SF6. Cluster ions 79Br-Hen, 35Cl-Hen and F-Hen are
List of figures
xiv ... 62 Figure 5.4 - Yield of anions versus number of helium atoms attached. Data are deduced from mass spectra shown in Figure 5.2. The solid line shows the fitted step function... 62 Figure 5.5 - Radii of anions and cations in helium droplets derived with a classical model from the present data, assuming a bulk helium density. Anionic radii derived from lattice constants of alkali halide crystals are shown for comparison. Also shown are values resulting from a quantum molecular dynamics study [5.44] and from ion mobilities in superfluid bulk helium [5.42, 5.43] ... 66 Figure 6.1 - Upper panel: Section of a mass spectrum; Ar2+ is the most prominent peak.
Close-ups of the two peaks marked by triangles are presented in Figure 6.2b; they reveal two contributions at 44 u and three contributions at 88 u. The size distribution of two ion series with nominally identical mass, ArHen+ and Hen+10+, is displayed in the lower panel ... 80
Figure 6.2 - Upper panel: Mass spectrum showing argon cluster ions with up to 61 atoms. Two reproducible abundance anomalies are marked. Lower panel: Low-mass section of the same spectrum, showing mostly pure helium and pure argon cluster ions ... 81 Figure 6.3 - Abundance of Arn+. Two reproducible anomalies are marked ... 82
Figure 6.4 - Mass spectra near Ar55+ (2197.9 u) recorded with different impurity levels and
mass resolutions. The main peaks are due to pure Arn+; isotopomers containing one 36Ar are
resolved in panel c. The position of clusters containing one H2O or N2 molecule are marked
by triangles and vertical bars, respectively; peaks containing one O2 are also visible. Note the
abrupt drop in impurity abundance beyond Ar54N2+ and Ar55H2O+... 84
Figure 7.1 - Positive ion mass spectrum of CH3COOH measured at 100 eV electron energy. 91
Figure 7.2 - Positive ion mass spectrum of CH3COOD measured at 100 eV electron energy. 93
Figure 7.3 - Negative ion mass spectrum of CH3COOH measured at 2.8 eV electron energy.
Although not explicitly labelled in the figure, the long series of peaks above 120 Th arising from addition of helium atoms to the dimer anions (both parent and dehydrogenated) should be noted. Clusters with up to 14 helium atoms have been identified for the acetic acid dimer anion ... 94 Figure 7.4 - Part of the negative ion mass spectrum of CH3COOD measured at 2.8 eV electron
xv
kinetic energy ... 100
Figure 7.7 - Ion yields of (CH3COOH)·(CH3CO)- and (CH3COOH)·(CH3CO)- as a function of the electron energy... 100
Figure 8.1 - Electron impact ionisation mass spectrum derived from L-serine clusters in helium nanodroplets with a mean size of 16500 helium atoms... 106
Figure 8.2 - High resolution section of the electron impact ionisation mass spectrum derived from L-serine clusters in helium nanodroplets with a mean size of 9800 helium atoms ... 107
Figure 8.3 - L-serine clusters distributions in helium nanodroplets with a mean size of 4000 helium atoms obtained by electron impact ionisation ... 108
Figure 8.4 - Negative ion mass spectrum for glycine in helium nanodroplets. The electron impact energy was ∼ 2 eV. This mass spectrum focuses on the region between the dimer and trimer anions ... 112
Figure 8.5 - Negative ion mass spectrum for alanine in helium nanodroplets showing the region near the dimer and trimer anion peaks. The electron impact was energy was ∼ 2 eV 113 Figure 8.6 – Negative ion mass spectrum for serine in helium nanodroplets showing the rgion near the dimer and trimer anion peaks. The electron impact was energy was ∼ 2 eV ... 114
Figure 8.7 - Negative ion mass spectrum for serine in helium nanodroplets showing features near the trimer, tetramer and pentamer parent anion peaks... 114
Figure 8.8 - Relative intensities (note the logarithmic scale) of the HekAA2– anions (AA = amino acid) for glycine, alanine and serine... 117
Figure 8.9 – Glycine dimer upper panel and trimer lower panel anion yield spectra as a function of incident electron kinetic energy ... 118
Figure 8.10 – The yield of dehydrogenated glycine cluster anions as a function of incident electron kinetic energy ... 119
Figure 9.1 – D/L – serine enantiomers ... 125
Figure 9.2 – D/L – 2 aminobutiric acid enantiomers... 126
Figure 9.3 – L – cysteine ... 126
Figure 9.4 – a) L-tryptophane... b) L-phenylalanine ... 127
Figure 9.5 – Reaction of glycine formation from acetic acid and ammonia ... 127
List of figures
xvi side chain ... 128 Figure 9.8 – Ion yields for valine trimer anions ... 129 Figure 9.9 – Reaction between three generic amino acids with formation of two water
molecules, one by the reaction between amino and carboxylic groups, and another by the reaction between two carboxylic groups. ... 130 Figure 9.10 - Reaction between three generic amino acids with formation of two water
xvii
List of tables
Table 3.1 – Categories of clusters according to the constituent atoms, forces involved and binding energies, after [3.2]... 30 Table 4.1 – Power supplies... 52 Table 4.2 - Pumps... 53 Table 5.1a - Observed number ns of helium atoms in the first solvation shell of positive ions
embedded in Hen. Ionic radii rion are estimated from ns using a classical model (see Appendix)
and assuming a helium number density of 0.0218 Å-3. Literature values are shown for halide anions... 65 Table 5.1b - Observed number ns of helium atoms in the first solvation shell of negative ions embedded in Hen. Ionic radii rion are estimated from ns using a classical model (see
1
Chapter 1
Introduction
How life begins remains a fundamental unsolved mystery. The origin of life on Earth may well represent only one pathway among many, along which life can emerge [1.1]. In searching for the origins of life, one may find two possibilities: either the building blocks were assembled on Earth in the so-called primordial soup, or the building blocks were formed elsewhere in the universe and somehow have been “carried” to Earth (panspermia). Under this (second) scenario the primary constituents of life may have been delivered from the interstellar space (or medium) by meteorites or comets flying to the Earth between 4500 and 3500 millions years ago [1.2, 1.3].
The interstellar medium (ISM) has extreme conditions of low temperature of a few Kelvin and low pressure in the extreme ultra high vacuum region, such that only two body (i.e., bimolecular) reactions can occur, so that the probability of a 3-body collision is negligible at such pressures, even on the time-scale of the lifetime of the universe [1.4]!
The ISM contains different sources of radiation:
– Light emission (from cosmic background radiation to extreme gamma radiation) of which the ultraviolet (from nearby stars) is the most important for inducing chemistry;
– High energy particles: about 89% of which are protons, 10% helium nuclei (alpha particles) and about 1% ions of the heavier elements and electrons. It is believed that most galactic cosmic rays derive their energy from supernova explosions, which occur approximately once every 50 years in our galaxy [1.5].
2 therefore take place at low temperatures, indeed in many cases their reaction rate constants actually increase with decreasing temperatures [1.5].
So far, many building blocks for molecules important in biology of life are present in the interstellar environment [1.6]. More than a 150 species have been detected in the ISM and they include short and large-chain and ring-like molecules, positive and negative ions, free radicals, amines, alcohols, and also more complex molecules like sugars such as glycolaldehyde, among many others. This sugar can be a building block for ribose forming the DNA and RNA backbones. Ion-molecule reactions are competitive reactions with respect to reactions with free radical or ionic species, since the neutral-neutral molecules are generally inhibited by an activation energy and therefore shown not to compete with any of the above [1.7]. Complex living organisms, as humans are, have specified features towards the interaction of radiation with biological constituents which may open new questions and give new research targets, regarding the approach, either at the molecular or at the physiological level. The role of homochirality in living organisms is still a matter of research within the scientific community. Why only L amino acids are part of proteins, only D sugars exist in human organism and why nucleic acids in RNA and DNA appear in the D form [1.8]?
In order to understand several processes in the ISM and those related to the origins of life, life in space and astrobiology, a considerable number of experimental laboratories studying gas phase, surface (ices) or condensed phase reactions. Techniques have been developed to simulate or mimic conditions close to those found in the ISM.
Introduction
3 effect and photoionisation. These electrons play an important role in space chemistry. It has been suggested that ionising radiation to living cells might produce approximately 5×10⁴ low energy electrons for each MeV of incident radiation [1.9, 1.10]; these electrons have an energy distribution centred below 20 eV and may cause many of the lethal DNA lesions. The yields of single and double strand breaks (SSBs and DSDs, respectively) (Figure 1.1) caused by such electrons have been observed to be 8.2×10⁻⁴ and 2×10⁻⁴ strand breaks per electron, respectively, at 10 eV. Comparing these results with 10 to 25 eV photons they have found that the former (electrons) are roughly one to two orders of magnitude larger [1.11]. Furthermore, another study from Sanche’s group [1.12], report that SSBs and DSBs occur in the energy range of 5-7 eV, below the threshold of DNA ionisation, i.e., 7.5 eV. The yields of SSBs and DSBs showed to be energy dependent suggesting that electron attachment, a resonant process, is the initial mechanism damaging DNA. They claim that the SSBs are initiated by resonant electron attachment process to the DNA constituents, i.e, bases, deoxyribose phosphate or water, followed by bond cleavage. For the DSBs, they suggest that they are caused by subsequent reactions of the products of SSBs with other DNA constituents.
a) b)
Figure 1.1 – Single (a)) and double (b)) strand breaks, SSBs and DSBs, respectively, pointed with arrows
Picture from en.wiki
4 were to assess the effects of the secondary particles emitted during the ionisation tracks. So the question that we may raise relies on how about more complex systems?
To understand ionisation processes at a more complex level than the single molecular structures, cluster science provides tools to generate such targets. The technique to produce helium nanodroplets appeared in the 60’s. Helium nanodroplets offer special properties that open doors to new pathways that can go through some answers about the origin of life, life in space or many biological processes. Helium has special features that make helium nanodroplets a special tool to investigate complex molecular systems. Helium nanodroplets are somehow easily synthesized with sizes between 103 to 108 [1.13] helium atoms per droplet. Controlling the stagnation conditions enables to control the size of the droplet. By evaporative cooling of weakly bonded helium atoms, cold (internal) temperatures (0.38K) can be achieved. At this temperature helium nanodroplets are superfluid [1.14-1.15]. Due to this fact almost all molecules that collide with the droplets move towards the centre of the nanodroplet, where they are cooled down. One consequence of this feature is that cold clusters and metastable (unannealed) complexes can be formed. This technique may also be useful to elucidate several processes and reactions in the interstellar space due to the low temperature characteristic.
Introduction
5 side chain, were analyzed and compared. [1.23, 1.24] Results are described in detail in chapter eight.
6
References
[1.1] David J. Des Marais et al.,Astrobiology, 8, 2008, 715 – 730. [1.2] E. L. shock, Nature, 416, 2002, 380-381.
[1.3] P. Ehrenfreund etal., Astrobiology, 6, 2006, 490-520.
[1.4] D. Smith and P. Spanel, MassSpectrometryReviews, 14, 1995, 255-278. [1.5] M. Spotheim-Maurizot et al., Radiation chemistry, EDP sciences, France 2008. [1.6] www-691.gsfc.nasa.gov/cosmic.ice.lab/interstellar.htm
[1.7] D.K. Bohme, 2nd AFI-Symposium Conf Series, Innsbruck university press, 2009.
[1.8] R. G: Cooks and S. C. Nanita, Angew. Chem. Int. Ed., 45, 2006, 554-569 and references therein.
[1.9] Barrios R. et al, J. Phys. Chem B, 106, 2002, 7991-7994.
[1.10] International Commission on Radiation Units and Measurements, ICRU report 31, Washinton DC 1979.
[1.11] Boudaiffa et al., Science, 287, 2000, 1658-1660.
[1.12] Abdoul-Carime et al., Radiat. Res, 155, 2001, 625-633.
[1.13] O. Echt, Handbook of Nanophysics, Klaus Sattler Editor (in print) [1.14] J. A. Northby, J. Chem Phys., 115, 2001, 10065-10077.
[1.15] M. Hartmann et al., Phys. Rev. Let., 75. 1995, 1566.
[1.16] F. Ferreira da Silva et al, Chemistry – A European Journal, 15, 2009, 7101-7108. [1.17] H. Haberland, Clusters of atoms and molecules II, Springer-Verlag, Germany 1994. [1.18] Roy. L. Johnston, Atomic and Molecular Clusters, Taylor and Francis, London 2002. [1.19] P. Scheier and T. D. Märk, Int. J. Mass. Spectrom. Ion Proc, 102, 1990, 19-44. [1.20] P. Scheier, PhD Thesis University of Innsbruck.
[1.21] F. Ferreira da Silva et al., Ar clusters, in print, PCCP, 2009. [1.22] F. Ferreira da Silva et al., Acetic acid, to be submitted, 2009.
7
Chapter 2
Ionisation
This chapter is devoted to mechanisms related to the interaction of electrons with molecular targets through ionisation and attachment, leading to positive ion formation via electron impact ionisation and negative ion formation via electron attachment. We will recall the Frank Condon principle and the Coulomb explosion in case of multiple ionisation associated with these mechanisms. For the particular case of attachment, we will analyse the different kinds of resonant states of the negative ions and some comparisons will be drawn between gas and cluster/condensed phases.
2.1. Electron impact ionisation
Electron impact ionisation involves the interaction (collision) of an electron with a target particle, and subsequent formation of one ion and two electrons, one of those being ejected from the target. The first electron-ion ionisation measurement performed by Dolder, Harrinson and Thoneman [2.1] dates back to 1961 and the following process was studied:
e- + He+→ He2+ + 2e-,
8
2.1.1. Ionisation processes
Electron Impact Ionisation processes for a single molecule AB as a function of the incoming electron energy can be classified in the following exit channels:
AB + e → AB+ + es + ee single ionisation (2.1)
AB + e → AB2+ + es + 2ee double ionisation (2.2)
AB + e → ABz+ + es + zee multiple ionisation (2.3)
AB + e → ABk+ + es + ee k shell (inner) ionisation (2.4)
AB + e → AB** + es → AB+ + es + ee autoionisation (2.5)
AB + e → AB+* + es + ee → AB2+ + 2ee autoionisation (2.6)
AB + e → AB+* + es + ee → A+ + B + es + ee fragmentation (2.7)
AB + e → AB+* + es + ee → AB+ + hυ + es + ee radiative ionisation (2.8)
AB + e → A+ + B+ es + ee dissociative ionisation (2.9)
AB + e → A+ + B- + es + ee ion par formation (2.10)
AA + e → AA2+* + es + 2ee → A+ + A+ + es + 2ee Coulomb explosion (2.11)
In equations (2.1 – 2.11) es is the scattered electron and ee the ejected electron. The processes
described in the equations (2.1 –2.4) and (2.9 and 2.10), may be consider as single step ionisation (direct) reactions, whereas (2.5 – 2.8) and (2.11) have to be viewed as two steps ionisation (indirect) processes where the initial interaction leads to the intermediate product which reacts subsequently via a unimolecular process. Processes that occur by single step ionisation, the ejected and scattered electrons leave the atom/molecule within a time window of the order of 10-16 s. For the indirect ionisation cases, the processes are slower than the direct processes. The time window in these particular casees can be of the order of 10-13 and 10-5 s.
2.1.2. Frank-Condon Principle
Ionisation
9 Etotal = Erotational + Evibrational + Eelectronic (2.12)
with Eelectronic = 102Evibracional = 104Erotational [2.2]. Transitions between two electronic states can
easily be described if one considers that they occur so rapidly that the intermolecular distances of the molecule do not have time enough to change appreciably the position of equilibrium. This is known as the Frank Condon principle [2.6]. This is due to the great ratio of the nuclear to electronic mass and the short interaction time. The arrival point in the potential energy curve (for diatomics) of the excited state (that can also be an ionic state) lies above the starting point of the initial potential energy curve by drawing a vertical transition line from the vibrational ground state of the neutral. In the case of ionisation, the energy between both states in a vertical transition is the vertical ionisation energy, and usually assumed to correspond to the point of maximum intensity in the experimental spectrum. The probability that the vibrational quantum numbers may change depends on the relative position of the potential energy curves, which in turn means depending also on the geometry and energetic properties of the molecular states. This probability is defined by the Frank Condon overlap integral using the Born’s first approximation [2.5]:
(
')
2, ~ dR
plu
∫
ψöυψuυ (2.13)with pl,u the probability of the transition involving the vibrational level υ in the lower state l
and υ’ in the upper state u. ψυö and ψυu' the corresponding vibrational wave functions, and R the internuclear distance. Depending on the relative shape of the potential curves of a system, different reaction channels can be attained. Figure 2.1 shows the potential energy curves for H2 and H2+. The internuclear separation in the ground vibrational state lies between the limits
R1 and R2 for all possible transitions and according to the Frank Condon principle, it must still
lie between the same limits after any of these transitions. Figure 2.1 shows not only the discrete vibrational states that can be populated but also some part of the continuum and repulsive states [[H2(X 1Σg+) → H2(B 1Σu+), H2(X 1Σg+) → H2+(2Σg+), H2(X 1Σg+) → H2+(2Σu+),
10 Figure 2.1 – Schematic potential energy diagram of H2 showing the neutral ground state and higher states
representing the exited or double ionized molecule, after [2.3]
The Frank Condon principle described above is applied to diatomic molecules. However, in the case of polyatomic molecules, the potential energy curves have to be replaced by n-dimensional potential-energy surfaces where n is the number of the atoms in the molecule. For polyatomic molecules, the access to ionic states formed by electron impact ionisation, may be given in agreement with the Frank Condon principle. Moreover, for large polyatomic molecules due to the several degrees of freedom, the ionisation process in terms of the potential hypersurfaces, may be better described according to statistical concepts, as quasi-equilibrium theory (QET) or Rice-Ramsperger-Kassel-Markus basic assumption (RRKM), based in statistical dynamics [2.3].
The properties of the ionic states depend on the type of the ejected electron from the neutral molecule, which can be classified in three categories [2.6]:
Ionisation
11 ii) anti-bonding electron: the bonds became stronger, the ion bond length are
generally shorter than those in the neutral and the vibrational spacing increases; iii) bonding electron, the bonds became weaker, thus the ionic bond lengths became
larger than those than neutral and the vibrational spacing decreases.
2.1.3. Coulomb explosion
Coulomb explosion can be considered as a two steps ionisation process. In this thesis we will focus on the Coulomb explosion as a significant process in clusters. It is well known that many doubly ionised molecules are not stable because the Coulomb repulsion energy between the two positive holes exceeds the molecular binding energy. The first evidence of Coulomb explosion for clusters was reported by Sattler and co-workers [2.7]. Since energy transfer into the ionised molecule or cluster is much smaller in field evaporation or ionisation than the electron impact, the chance to observe doubly charged molecules or clusters should be greater in these cases than in the traditional ionisation methods [2.8]. The doubly charge particle (molecule or cluster) is stable only if the molecule or cluster exceeds a critical size. It was conclude that there is a Coulomb explosion when the size of the doubly charged ion is below a critical value, i.e., when the distance between holes is too small [2.8]. If the repulsive Coulomb energy Ec of the two separated holes exceeds the binding energy of the cluster
atoms, EB, the molecular system breaks apart to single charged particles. However, if the
diameter of the molecule or cluster exceeds the critical value only, the condition EC < EB is
fulfilled and doubly charge molecules or clusters are stable. The critical size of the cluster could be calculated using the Liquid-droplet approximation. The total energy Etof a multiple
charged cluster could be writing as the sum of the volume term, surface term and Coulomb term. The coulomb energy of the clusters is estimated by assuming that z elementary charges are distributed uniformly within the cluster. Taking the cluster as a continous medium with dielectric constant ε, we could write the follow expression for Coulomb energy [2.9]:
(
)
r e z z r e z Ec ε ε ε 5 1 3 21 2 02 + − 02 −
= (2.14)
12
2.1.4. Ion formation
Electron impact ionisation of atoms leads to the production of single and multiple charged ions. Ionisation of molecules or clusters gives rise to many different kinds of ions as parent ions, fragment ions, metastable ions, multicharged ions and rearrangement ions. In this section we will present a short description of the different kinds of ions produced by electron impact ionisation.
2.1.4.1. Parent ions
Ionisation
13
2.1.4.2. Fragment ions
If the electron energy increases above the ionisation potential of the molecule, fragment ions are produced according to reaction (2.6). The primary fragment ions may be formed in excited states and subsequently decay into further fragment ions. The number of fragment ions and their relative abundances are characteristic for a corresponding molecule. Fragments ions can be divided into three categories [2.5]:
i) those contain the functional group;
ii) those produced by breaking of the functional group; iii) rearrangement ions;
The relative abundance of fragment ions is related to their rates of formation and decomposition. There are several factors that influence these rates:
i) ionisation potential; ii) electronic configuration; iii) bond dissociation energies;
iv) rearrangement and eliminations reaction channels;
Concerning the ionisation potential, Stevenson [2.5.] reports to a general rule, that applied to hydrocarbons where the appearance potential for the reaction (2.9), AP(A+/AB), is given by the sum of the ionisation potential of A and the dissociation energy DE(A-B) if IP(A) < IP(B). This rule, known as Stevenson’s rule, was extended by Audier [2.5]. Audier used the Stevenson’s rule to state the decay of the cation AB+. This cation can decay into A+ + B or A + B+, and the preferred path is that producing the ion where neutral species have lower ionisation potential.
2.1.4.3. Metastable ions
14 The metastable decomposition, analysed in a sector field mass spectrometer, gives in the mass spectrum a peak showing that the daughter ion with mass m2 appears in a mass position
designated as the apparent m* according the following equation [2.5]:
(
)
⎟⎟ ⎠ ⎞ ⎜⎜ ⎝ ⎛ + − − = ∗ A A U U U m m m z m m m m 2 2 1 1 1 2 1 2 1 / / (2.15)where UA is the accelerating voltage, U the potential difference through which the parent ion
of mass m1 falls before the decomposition, z1 and z2 the charges of parent and daughter ions,
respectively.
The formation of metastable ions can be explained by different mechanisms depending on the size and property of the precursor ion [2.3]: forbidden predissociation, tunnelling through a barrier, vibrational predissociation and rearrangement transitions. The intensity of the peaks corresponding to the metastable ions is usually less than 1% of the parent ion [2.3] because of the distribution of internal energy, i. e. for high internal energy leads to prompt fragmentation and low internal energy leads to parent ion formation.
2.1.4.4. Doubly charged ions
The presence of doubly charged ions in mass spectra was observed as early as 1930. Under standard electron impact ionisation conditions, ~70 eV, doubly charged ions are formed from most of organic compounds since their double ionisation energies are between 25 and 35 eV. However, the abundance of the doubly charge ions is typically 103-104 smaller than the corresponding abundance of the singly charged ions [2.10]. Most of the doubly charged diatomic ions AB2+ observed, can be described according to [2.3]:
( ) ( ) ( ) ( )
+ + + < 2+ ≤ 2+ B IP A IP B IP AIP (2.16)
where IP are the single and double ionisation potentials for the single atoms A and B. There is a second group of doubly charged diatomic ions, satisfying the following condition:
( ) ( ) (
+ + + > 2+)
AB IP B IP A
Ionisation
15 The repulsive Coulomb interaction between A+ and B+ lies above the weakly bound state arising from A2+ + B allowing the formation of stable AB2+ ions [2.3].
Doubly ionised molecules or clusters can decompose via two different ways, depending on how the charges are distributed and if they remain in the same fragment or if they are distributed over the two fragments:
+ + + → +
B A
AB2 (2.18)
B A
AB2+ → 2++ (2.19)
In general, the larger fraction of the electron impact multiple ionisation processes of molecules leads to singly charged fragment ions following reaction (2.18).
2.1.4.5. Rearrangement ions
Generally, rearrangement ions are defined as ions that contain bonds that are not present in the precursor molecule. This can be represented by the following reaction:
(
X Y Z)
e(
X Z)
Y ee Z Y
X − − + → − − + +2 → − ++ +2 (2.20)
For rearrangement ions to occur, their unfavourable entropies of activation must be balanced by favourable activation energies, ∆H°f(X-Z+) + ∆H°f(Y) which in turn must be small.
Hydrogen or fluorine rearrangements are common but those involving groups as CH3 or C6H5
have also been frequently observed[2.5].
2.1.5. Ionisation in clusters
16 hopping process is terminated via formation of He2+ or by the irreversible cation formation of the dopant [2.12]. Penning ionisation is also a competitive ionisation process. The lowest excited state of He requires 19.82 eV, energy enough to ionise most dopants. The cross section of this process, is ten times lower than the ionisation cross section of helium, and has the maximum at energies between 20 and 30 eV [2.13].
2.2. Electron attachment
Low energy-electron collisions with atoms, molecules or clusters are among the most important elementary process in many environments including low temperature plasmas, gaseous dielectrics and biological systems [2.14]. The formation and decay of negative ions is a field that has brought to the attention physicists and physical chemists for several decades as well as considerable theoretical and experimental work [2.15].
2.2.1. Electron scattering
When one electron interacts with a neutral atom, molecule or cluster, this interaction is characterised as a scattering process by the incoming electron. If the electron is trapped for “longer” time, than in the case of direct scattering, the molecule forms a temporary negative ion (TNI). Electron capture can only happen if the energy of the incident electron fits with electronic state of the molecule and this is thus a resonant process. This process can be divided in two distinct classes: elastic and inelastic scattering.
2.2.1.1. Elastic scattering
If an incident electron collides with a target atom, molecule or cluster and will eventually be deviated from its original direction, this is known as direct scattering. Direct scattering may be divided into two classes concerning the energy deposited in the target. Elastic scattering is defined when the energy of the electron scattered is not affected, or the amount of energy that is released is of the order of me/M (me = electron mass and M = molecule mass) which is
generally speaking negligible and less than 10-5.
2.2.1.2. Inelastic scattering
Ionisation
17 (me< M), the direct inelastic scattering only causes initially electronic excitation of the target
molecule.
2.2.2. Electron affinity
The quantity that relates a neutral particle (M) with its negative ion (M-), is the electron affinity [2.16]. The electron affinity is normally defined as the difference between the neutral molecule plus one electron at rest at infinity and the molecular negative ion when both, neutral molecule and negative ion, are in their ground electronic, vibrational and rotational states, i.e., adiabatic electron affinity (EAad). The electron affinity can be positive (>0eV) if
18 Figure 2.2 – Schematic diagrams illustrating the positive and negative values of EA and the relation of EA to
VAE and VDE, after [2.5]
The schematic figure above shows the physical significance of the VDE, VAE and EA for electron capture by an atom (a and d) and a diatomic molecule (b, c, e, and f). In the diagrams a, b and c the EA is positive. For an atomEA
( )
A =VDE( )
A− , however for molecules( )
=( )
−AX VDE AX
EA only if the internuclear separation for AX and AX- is the same as is shown in c. Although, for the majority of the molecules, the situation is similar to the situation described in b, i.e., EA
( )
AX <VDE( )
AX− . d and e illustrate the cases of electron excited Feshbach resonances (will be described next), for atoms and molecules, respectively. In these cases the electron is capture in the field of an excited atom A* or an electronically excited molecule AX*, forming the respective anions, A*- and AX*-. The EA(A*) and EA(AX*) represent the electronic affinity for the excited atom and for the excited molecule, respectively. The situation depicted in f, the electron is temporarily bound to the molecule with a “transient binding energy spectrum” (shaded area). In this case VAE( )
AX ≤−EA( )
AX2.2.3. Temporary Negative Ion formation
Under single collisions, a stable molecular anion (M-) can be produced by electron transfer from neutral atoms or molecules and from atomic or molecular anions, following the two reactions:
− ++ →
+M A M
A (2.21)
− −+ → + M A M A (2.22)
Reaction 2.21 occurs if the electron affinity of M is lower than the ionisation energy of A, which means that this reaction is usually endothermic and can only occur if at least A and/or M contain sufficient energy (kinetic energy), i.e., above the reaction threshold. In a resonant process, the electron is trapped by the atom, molecule or cluster, forming a TNI (Transient Negative Ion).
−∗ →
+M M
Ionisation
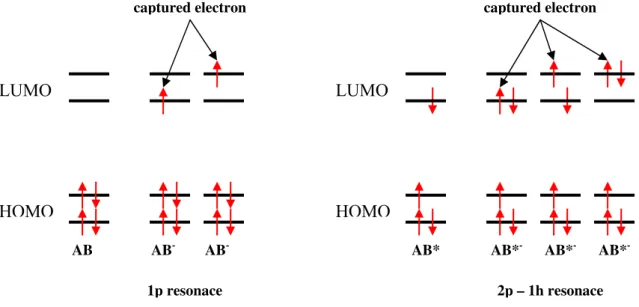
19 In the present work described in this thesis, the type of negative ions formed via electron attachment processes will be described based on the single particle (1p) and two particle-one hole (2p-1h) resonances. In a single particle resonance (1p), the incoming electron temporarily occupies one of the normally empty MOs, LUMO orbital, without affecting the electronic configuration of the target molecule. A two particle-one hole resonance (2p-1h), is formed when the incoming electron concomitantly excites at least one of the target electrons resulting in one hole and two electrons in normally unfilled MOs [2.15] (see figure 2.3).
Figure 2.3 – Electronic configuration for a one particle resonance and for a two particle one hole resonance
The resonances may be classified as a function to their energy in comparison with the neutral or excited molecule. When one electron is captured and the electronic state of the negative ion formed lies above in energy of the neutral state, this is classified as an open channel or shape resonance. On other hand, when an electron is captured and the electronic state of the negative ion produced lies below of the neutral state, this is referred as a nuclear excited Feshbach resonance (figure 2.4) [2.2]
LUMO
HOMO
LUMO
HOMO
AB AB- AB- AB* AB*- AB*- AB*
-captured electron captured electron
20 Figure 2.4 – The different types of resonances with respect to their energy in comparison to the neutral (excited)
molecule
2.2.3.1. One particle resonances
2.2.3.1.1. Shape or single-particle resonances
In this type of resonances, the incident electron is trapped in a potential well which arises from the interaction between the incident electron and the neutral molecule in its electronic ground state. This trapping mechanism is described by the shape of the interaction potential between the electron and the neutral molecule: combination of the attractive polarisation interaction [2.17].
( )
422r q r
Va =−α (2.24)
(where α is the polarisation of the target molecule, r is the distance between the incoming electron and the molecule and q the elementary charge), and the repulsive centrifugal term [2.17]
(
)
μ 2 2 2 1 rVl =h l l+ (2.25)
(where l is the angular momentum quantum number, μ reduced mass of the electron/molecule system (μ ~ me)) producing a centrifugal barrier in the resulting potential in
0 M M* -M* -M -M -M*
Neutral Negative Ion
Open channel
Close channel (Feshbach)
Shape
Vibrational Feshbach
En
erg
Ionisation
21 which the additional electron can temporarily be trapped. Since it is the particular shape of the potential which is responsible for the trapping, these states are also named as shape resonances.
Therefore the effective potential is given by the combination of the attractive polarisation and repulsive centrifugal potential resulting:
( )
( )
(
)
μ α
2 2
4 2
2 1
2r r
q V
r V r
Veff = a + l =− +h ll+ (2.26)
Figure 2.5 shows schematically the interaction potential for different angular momentum quantum numbers l= 0, 1 and 2. For l≠ 0 a centrifugal barrier is formed and the electron can be temporarily trapped within the effective potential [2.15]. Shape resonances are usually located at low energies, < 4 eV and above the potential energy curve of the neutral molecule, i.e., the molecular electron affinity is negative. The decay of the TNI is dictated by the competition between dissociation and autodetachment, the latter having lifetimes of the order of 10-15 - 10-10s.
Figure 2.5 – Effective interaction potential for an electron approaching a neutral molecule, after [2.15]
2.2.3.1.2. Nuclear-excited Feshbach resonances
22 vibrational level υ = 0 of the parent neutral state and can decay through autoionisation. The lifetimes are usually up to 10-6s.
2.2.3.2. Two particle one hole resonances
2.2.3.2.1. Core excited shape resonances or open channel resonances
If the energy of one incoming electron is high enough to produce an electronic excitation in the neutral molecule, a resonance can be formed in which two electrons occupy normally unoccupied MO, as shown in 2.3). The negative ion formed is energetically above the corresponding electronically excited state of the neutral molecule and the electron is bound by a centrifugal barrier like in the case of the shape or single particle resonances [2.15]. Since the potential barrier is strongly dependent on the l value of the occupied excited state orbital, no s electrons can be attached (through such barrier), so s-wave (l=0) resonances are turned into a bound state. Also, as in the case of shape or single particle resonances, core excited resonances can decay via autodetachment or dissociative attachment, which leads to a typical lifetime of 10-3 – 10-2s.
2.2.3.2.2. Core excited Feshbach or core excited close channel resonances
In this case the incident electron interacts with an excited electronic state of the target molecule. These resonances arise when the interaction potential between the excited target molecule and the incoming electron is strong enough to support the bound state. They lie below the parent state, usually 0 to 0.5 eV below the energy of the corresponding excited state. When the transient negative ion is in a vibrational level υ' that lies energetically below
0 =
Ionisation
23 Figure 2.6 – Schematic potential energy diagram showing the formation of core excited shape (open channel)
resonances and core excited Feshbach (close channel) resonances, after [2.15]
2.2.4. Decomposition processes of TNI
Under single collision conditions, the principal decomposition channels of the resonances described above can be:
( )∗ ( )∗ −
− → +
e AB
AB (2.27)
( )∗ → −+hω −
AB
AB (2.28)
( )∗ −
− → + B A
AB or A−+B (2.29)
24 named as dissociative electron attachment - DEA, represents unimolecular decomposition into a stable negative and neutral fragment. This process typically occurs on a time scale ranging from 10-14 to 10-12s, depending on the mechanism of the reaction. Dissociative electron attachment may occur if a thermodynamically stable anion, may be formed [2.16].
2.2.4. Decomposition processes of TNI under aggregation
The interaction of electrons with molecular aggregates, clusters, changes considerably as compared to the isolated phase. The formation of TNI in clusters may proceed via two different schemes:
i) The primary step of the incoming electron is to be captured to form a localised negative ion within the cluster and forms a core excited resonance which relaxes into the ground state leading to dissipation of the vibrational fraction of its excess energy within the cluster. This results in stabilisation of the TNI with respect to dissociation (dissociative attachment) as well as autodetachment and the excess energy is carried away by evaporation of a part or of the entire cluster. The latter is usually named as evaporative attachment. This process is assigned to direct electron capture.
ii) If the incoming electron is ineslastically scattered in the cluster, slowed down and captured by another molecule within the same cluster, this process is assigned as self-scavenging if it occurs in homogeneous clusters or auto-scavenging if it occurs in heterogeneous clusters [2.17].
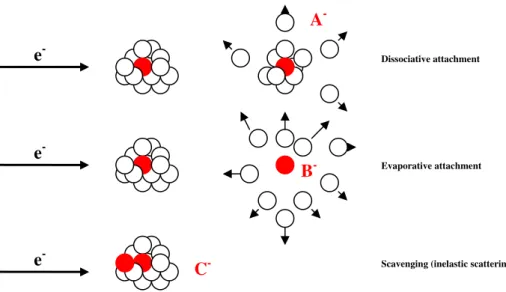
Figure 2.7 illustrates some of the different possibilities of negative ion formation following electron capture by clusters. The first situation corresponds to the case that the TNI decomposes via dissociative attachment, i.e., with emission of a free ionic fragment A- or solvated ion A-Mn; It can also relax into its a more stable configuration B- thereby evaporating
Ionisation
25 Figure 2.7 – Illustration of some electron induced processes in clusters induced by low energy electrons:
dissociative attachment, evaporative attachment and inelastic scattering, after [2.17, 2.18]
In Figure 2.8, we show schematic potential energy curves for the isolated neutral molecule and corresponding negative ion in gas phase (black line) and the potential energy curves in a clusters (red dashed curve and subscript solv). The autodetachment competes strongly with dissociation since the anionic potential energy surface is usually lowered more in the cluster with respect to the neutral, due to the binding interaction (induced polarization in the case of films); the time that the system needs to escape from the autodetachment region is shortened, and consequently, the cross section for negative ion formation is enhanced [2.17]. The figure also shows that the TNI is stabilised compared to the neutral precursor due the stronger polarisation of the environment in the presence of the negative charge. It is also possible to see, on the right side of the figure, the projection of the estimated cross section profile for the anion in gas phase and in the condensed phase cluster, by applying the reflection method to the anionic potential energy curve.
e
-e
-e
-Dissociative attachment
Evaporative attachment
Scavenging (inelastic scattering)
A
-B
-26 Figure 2.8 – Schematic potential energy diagram illustrating DA in the gas phase and in clusters. The right side
shows the cross section for the negative ion formed in gas phase and in clusters, after [2.15]
2.2.4. Energy balance for dissociative electron attachment
The process
( )
−( )
−− + → → +
X R M
M
e ε ε (2.30)
where ε is the electron energy can be pictured in the Born-Oppenheimer potential energy diagram below (Figure 2.9), applied to diatomic molecules.
Figure 2.9 – Born-Oppenheimer potential energy curves associated with electron attachment and subsequent
electronic dissociation, after [2.19]
The energy balance for dissociative electron attachment can be deduced from Figure 2.9, according with the following equation:
(
−)
−( )
+ ∗=D R X EA X E
Ionisation
27 Where D is the bond dissociation energy of the neutral molecule, EA is the electron affinity of X and ε1 ≤ε ≤ε2. The minimum heat of formation for the reaction is
(
R X)
EA( )
X DH = − −
Δ 0 (2.32)
By combination of the equations (2.31) and (2.32), the excess energy may be given by
0
H
E∗ =ε −Δ (2.33)
28
2.3. References
[2.1] Dolder KT et al., Proceedings of royal society of London series A – Mathematical and Physical sciences, 264, 1961, 367.
[2.2] S. Denifl, Ph.D. thesis, University of Innsbruck, 2004.
[2.3] T. D. Märk and G. H: Dunn, Electron Impact Ionization, Springer Verlag, Wien, 1985. [2.4] H. Haberland, Clusters of Atoms and Molecules II, Springer Verlag, Germany, 1994. [2.5] L. G. Christophorous, Electron-Molecule Interations and Their Applications, Vol 1, Academic Press, London 1984.
[2.6] P. Limao-Vieira, Ph. D. Thesis, University of London, 2003. [2.7] Sattler K. et al., Physical Review Letters, 47, 1981,160-163. [2.8] Jensch T. et al., Chem. Phys. Lett., 93, 1982, 144-147. [2.9] O. Echt et al., Phys. Rev. A, 38. 1988, 3236-3248. [2.10] Ast T., Adv. Mass. Spectrom., 8A, 1980, 555-576.
[2.11] Roy L. Johnston, Atomic and Molecular Clusters, Taylor &Francis, London, 2002. [2.12] Andrew M. Ellis and Shengfu Yang, Physical Review A, 76, 2007, 032714.
[2.13] Schiedmann A.A. et al., J. Chem Phys, 107(8), 1996, 2839-2844. [2.14] H. Hotop et al., Physica Scripta, T110, 2004, 22-31.
[2.15] I. Bald et al., Int. J. Mass. Spec., 277, 2008, 4-25. [2.16] E. Illenberger, Chemical Reviews, 9, 1992, 1589-1606.
[2.17] O. Ingólfsson et al., Int. J. Mass Spect. And Ion Proc., 155, 1996, 1-68. [2.18] R. Balog et al., Int. J.Mass. Spect., 233, 2004, 267-291.
29
Chapter 3
Clusters
3.1. Introduction
Clusters are of fundamental chemical and physical interest because of their own intrinsic properties and also because of the central role bridging gas phase molecular physics and condensed matter science [3.1]. Free electron attachment and electron impact ionisation experiments on molecules embedded in helium droplets were carried out during the course of the present PhD thesis. In this way, it is very important to understand how clusters and helium droplets are formed. Helium clusters usually are produced with several thousands of helium atoms, while “helium droplets” is usually the term to define neutral helium cluster. Helium droplets show unique properties (e.g., superfluidity) that will be addressed later in this chapter. Clusters can be defined as a group of atoms bound together by interatomic forces. In the simplest definition clusters are a group of particles, between 2 and 106 [3.2]. These particles can be identical, leading to homo clusters or different leading to hetero clusters. The earliest reference to clusters is reported in 1661 by Robert Boyle [3.2].
3.2. Types of clusters
30
Cluster Type Atoms involved Binding forces Mean binding
energy (eV)
Metal clusters s-block metals, sp- block metals,
d-block
Covalent metallic forces 0.5 - 3
Semiconductor
clusters
Semi conductors elements (ex. C, Si,
As, Ga)
Covalent forces 1 - 10
Ionic clusters Halides and oxides of the groups 1
and 2
Ionic forces 2 - 4
Rare gas
clusters
Rare gases and closed shell
molecules
Weak Van der Waals forces < 0.3
Molecular
clusters
Organic molecules, and molecules
with electronegative elements
Van der Waals, dipole-dipole
interaction and hydrogen
bonding
0.15 - 1
Table 3.1 – Categories of clusters according to the constituent atoms, forces involved and binding energies, after
[3.2]
3.3. Clusters sources
Clusters
31
3.4. Supersonic expansion
The supersonic expansion through a small nozzle (ø ≈ 5 μm) is assumed to be an adiabatic process [3.3]. The stagnation enthalpy of the gas is converted mainly into kinetic energy and a small remaining enthalpy, assuming that turbulence and effects of collisional heating are negligible. According to these assumptions, we may describe the following expression for the conservation of the energy as:
2 2
0
mv H
H = + (3.1)
with H0 =cpT0 and H =cpT. Where H0 is the stagnation enthalpy, H is the enthalpy after
expansion, cp is the specific heat at constant pressure, stagnation T0, T is the temperature
along the stream. Rearranging expression (3.1) we can write:
2 2 0 mv T c T
cp = p + (3.2)
Obtaining equation 3.2 as a function of T, the beam temperature is:
(
)
2 10 1 2 1 1 − ⎥⎦ ⎤ ⎢⎣ ⎡ + −
=T M
T γ (3.3)
where v p c c =
γ , cv is the specific heat at constant volume, and M is named the Mach number,
and defined as the ratio between the velocity of the molecules and the local speed of the sound.
c v
M = , where c is the speed of sound and is defined as
m kT
c= γ , with k = cp-cv.
During the expansion, the local speed of the sound decreases with T , this leads to the increase of the Mach number. Equation 3.2 can be written in terms of the velocity of the beam as: ) ( 2 0 T T m c
32 For T = T0 the beam velocity is 0 and increases with the decrease of the temperature. The
increasing of the beam’s velocity, leads also to an increase of the Mach number. The velocity function distributions (f(v)) for different Mach numbers as a function of the velocity are show in Figure 3.1.
Figure 3.1 – Velocity distributions for different Mach numbers as a function of the normalized velocity v where
α = (1KT/m)-0.5 is the most probable velocity for the Maxwell-Boltzmann distribution, after [3.3]
In the common situation of a real expansion, one has to consider additional features of the non-ideal supersonic jet which are schematically shown in Figure 3.2. Due to an overexpansion, very thin non-isentropic regions like the barrel shock at the side edges of the expansion region and the Mach disk shock in the forward direction are formed. In a descriptive explanation, the supersonic flow needs information about the boundary conditions along the expansion. This information is transported with the speed of sound but the particles in the expansion move faster. Thus leading to an overexpansion of the gas, but in order to get rid of these unknown boundary conditions, the Barrel shock and the Mach disc shock with a M number below 1 are provided to change the flow of the expansion if the boundary conditions are not satisfied. The Mach disk location at a distance xm from the nozzle can be
calculated as a function of the nozzle diameter d, stagnation pressure p0 and background
pressure pb with the following equation [3.4]:
b o M
p p d
x
67 . 0
= (3.5)
The Mach disk is depending on the intensity of the interaction between the flow and the background pressure. According to equation 3.5 for sufficiently low background pressure pb
![Figure 2.6 – Schematic potential energy diagram showing the formation of core excited shape (open channel) resonances and core excited Feshbach (close channel) resonances, after [2.15]](https://thumb-eu.123doks.com/thumbv2/123dok_br/16535970.736532/41.892.305.632.103.468/figure-schematic-potential-diagram-formation-resonances-feshbach-resonances.webp)
![Table 3.1 – Categories of clusters according to the constituent atoms, forces involved and binding energies, after [3.2]](https://thumb-eu.123doks.com/thumbv2/123dok_br/16535970.736532/48.892.133.806.136.476/table-categories-clusters-according-constituent-involved-binding-energies.webp)
![Figure 3.2 - Schematic view of the supersonic expansion structure illustrating jet boundaries and shock fronts, after [3.5]](https://thumb-eu.123doks.com/thumbv2/123dok_br/16535970.736532/51.892.230.709.444.696/figure-schematic-supersonic-expansion-structure-illustrating-boundaries-fronts.webp)
![Figure 3.4 – Pressure temperature phase diagram for 4 He with isentropes, after [3.12] and references therein](https://thumb-eu.123doks.com/thumbv2/123dok_br/16535970.736532/55.892.280.659.716.962/figure-pressure-temperature-phase-diagram-isentropes-references.webp)