Repositório ISCTE-IUL
Deposited in Repositório ISCTE-IUL: 2019-05-22
Deposited version: Post-print
Peer-review status of attached file: Peer-reviewed
Citation for published item:
Machado, M. J. (2019). Contingent variables to the price charged by hotels. International Journal of Procurement Management. 12 (3), 258-275
Further information on publisher's website: 10.1504/IJPM.2019.099549
Publisher's copyright statement:
This is the peer reviewed version of the following article: Machado, M. J. (2019). Contingent variables to the price charged by hotels. International Journal of Procurement Management. 12 (3), 258-275, which has been published in final form at https://dx.doi.org/10.1504/IJPM.2019.099549. This article may be used for non-commercial purposes in accordance with the Publisher's Terms and Conditions for self-archiving.
Use policy
Creative Commons CC BY 4.0
The full-text may be used and/or reproduced, and given to third parties in any format or medium, without prior permission or charge, for personal research or study, educational, or not-for-profit purposes provided that:
• a full bibliographic reference is made to the original source • a link is made to the metadata record in the Repository • the full-text is not changed in any way
The full-text must not be sold in any format or medium without the formal permission of the copyright holders. Serviços de Informação e Documentação, Instituto Universitário de Lisboa (ISCTE-IUL)
Contingent variables to the price charged by hotels
Maria João Cardoso Vieira Machado Instituto Universitário de Lisboa (ISCTE-IUL) Business Research Unit (BRU-IUL)
Avenida Forças Armadas, 1649-026 Lisboa Portugal
Email: maria.joao.machado@iscte-iul.pt
Biographical notes: Maria João Cardoso Vieira Machado (PhD in accounting) is an Assistant Professor of Accounting Department, at the Business School of the Instituto Universitário de Lisboa (ISCTE–IUL). She is also researcher at the Business Research Unit (BRU-IUL), with research interests in management accounting and tourism (see
https://ciencia.iscte-iul.pt/public/person/mjcvm.
This research is supported by a grant from the Fundação para a Ciência e Tecnologia (UID/GES/00315/2013).
ABSTRACT
This study has two specific objectives: to analyse the association between the hotel features and the price charged; to analyse whether the performance evaluation tools used are associated with the price charged by the hotels. Data collection began with a survey directed at the financial managers of 4 and 5 star hotels located in Portugal to collect information on the performance evaluation tools used, and on some hotel features. We obtained 241 completed questionnaires, and to meet the objectives proposed, we also collected the price charged by the responding hotels, using the online platform Booking.com. The results obtained help us to fill a knowledge gap identified in the literature review regarding the influence of the hotel’s operating conditions on the price charged, since it leads to the conclusion that hotel features and the performance evaluation tools used influence the price charged.
Keywords: hotel price; performance evaluation tools; Balanced Scorecard; Tableau de Bord; hotel features; hotel industry; contingency variables.
1 - INTRODUCTION
The general objective of this study is to contribute to the understanding of the factors that influence hotel prices. As specific objectives, the following can be identified: to analyse the association between the hotel features and the price charged; to analyse whether the performance evaluation tools used are associated with the price charged by the hotels.
The price charged by the companies continues to be a concern for researchers (Gani, 2017; Rabbani et al., 2018). The studies carried out on hotel prices focus mainly on the external factors that determine the price, the consequences of the price on the hotel customers' purchase intentions, and also on the association between the price charged and certain hotel features, such as category, location, and the quality of the facilities
(Chen and Rothschild, 2010; Espinet et al., 2012; Tse and Poon, 2012; Limberger et al., 2014; Borges et al., 2015; Guillet and Mohammed, 2015; Wang et al., 2015; Haddad et al., 2015). It is thus found a lack of knowledge about the influence of the hotel's internal operating conditions on the determination of the price charged, which justifies conducting further research on the association between other hotel features not yet studied, the performance evaluation tools used, and the price charged.
The universe of this study was defined as the set of 4 and 5 star hotels located in Portugal, having the information been collected using three sequential methods. First, we conducted a survey directed at the hotels’ financial managers, with the objective of collecting information on the performance evaluation tools used, and on certain hotel features. We obtained 241 fully completed questionnaires, which generates a response rate of 50.4%. The second method of data collection consisted in the identification of new additional features – relating to the responding hotels – available online or obtained through the treatment of the information collected in the surveys. The third method of data collection was to gather information on the price charged by the responding hotels, using the online platform Booking.com. In this study, there was no evidence of bias caused by the non-responding hotels, a conclusion arrived at through the analysis of two factors: geographical dispersion, and the size of the responding hotels.
2 – LITERATURE REVIEW
Recent articles on hotel prices focus mainly on the external factors that determine the price, on the consequences of the price on the hotel customers’ purchase intentions, and also on the association between price and hotels features (Chen and Rothschild, 2010; Espinet et al., 2012; Tse e Poon, 2012; Limberger et al., 2014; Borges et al., 2015; Guillet e Mohammed, 2015; Wang et al., 2015; Haddad et al., 2015).
Regarding the external factors that determine the price, Haddad et al., (2015) consider that the price is one of the bases of hotel profitability, since any room not booked on a given night is a lost revenue for the hotel. Hotels use dynamic pricing strategies that allow the same room to be sold to different customers, for the same date, at different prices (Wang et al., 2015). The factors considered by the hotels for the determination of dynamic prices are several, namely the distribution channel used, the type of customer, how far in advance was the reservation, and the competition’s prices (Haddad et al., 2015).
Regarding the impact of price on the hotel customers’ purchase intentions, revised studies conclude that several factors can mediate the relationship between the price charged by the hotel and the customers’ buying intentions, namely: comments from previous customers made available on online sites (Wang et al., 2015); customer satisfaction indexes also available on online sites (Limberger et al., 2014; Borges et al., 2015); customer features, such as their experience in reserving, and the purpose of the stay (Haddad et al., 2015); and the room’s elasticity of demand (Tse and Poon, 2012). However Williams (2014) suggest that there may be other factors that influence purchasing decisions, namely the quality of the service provided (Heikka and Mustak, 2017).
The articles that analyse the influence of hotel features in room pricing study the influence of factors such as hotel category, its location, and the quality of the facilities
(Chen and Rothschild, 2010; Espinet et al., 2012; Borges et al., 2015; Guillet and Mohammed, 2015). Chen and Rothschild (2010) analysed the features and the price charged by 73 hotels located in Taipei, through data collected on the website of a travel agency, and concluded that the price charged is associated with features such as the hotel’s location, the size of the rooms, the availability of conference rooms, gym and internet access. Espinet et al. (2012) analysed the association between hotel features and price seasonality, namely in terms of category, facility quality, and location. The results obtained by Espinet et al. (2012) lead to the following conclusion: the higher the number of stars and the quality of the facilities, the lower the price seasonality; certain geographic locations are associated with a lower price seasonality. Borges et al. (2015) concluded that the price charged by the hotel depends on the number of stars and on the competition, defined as the number of hotels of the same category with rooms available in the same area. Following a review of published studies on revenue management in the tourism sector, Guillet and Mohammed (2015) also indicate that the price charged by a hotel depends on features such as the number of stars, and the availability of other hotels in the same geographical area.
Performance evaluation tools are considered by the literature as very important for the sustainability of organizations (Singh and Acharya, 2014). The literature reveals thus a lack of knowledge about the influence of the hotels’ operating conditions in determining the price charged, namely in terms of the association between the performance evaluation tools used and the price charged by the hotels.
McPhail et al. (2008) consider as very important that the hotels use performance evaluation methods (PEM) considered by the theory as the most adequate, since these methods are fundamental to relate the strategy with the actions. Hotels operate nowadays in highly competitive environments that require the use of adequate PEMs to measure their performance against the strategic objectives defined (Kala and Bagri, 2013). The BSC has gained acceptance in the hotels as a method that focuses management on the intangible assets in general, and on the human resources in particular, without neglecting the financial measures (Kala and Bagri, 2013).
Several authors found that hotel performance is significantly influenced by employee satisfaction and performance (Evans, 2005; McPhail et al., 2008; Sainaghi et al., 2013). Satisfied employees present a better commitment to their work and interact better with their co-workers, which is a differentiating factor in terms of the quality of the service provided, while their performance evaluation is also essential to ensure this quality (Nadiri And Hussain, 2005). Park and Gagnon (2006) consider that the use of PEMs related with employee performance is a critical factor for hotel performance. Nadiri and Hussain (2005) carried out a survey to 285 European tourists who stayed overnight in hotels in Northern Cyprus, and concluded that hotel customers value significantly the satisfaction, the professional achievement, and the technical knowledge shown by the staff of the hotel. This makes the use of PEMs that contemplate employee satisfaction unavoidable. Kaplan and Norton (1996) also consider that the PEMs should incorporate indicators related to employee motivation, suggesting that it be measured through satisfaction surveys.
3 – METHODOLOGY 3.1 – Research Design
The specific objectives of this study (Figure 1) are as follows: to analyse the association between the hotel features and the price charged; to analyse whether the performance evaluation tools used are associated with the price charged by the hotels.
Figure 1 – Research Objective
Revised articles on hotel prices focus primarily on the external factors that determine the price, and on the price impact on the hotel customers’ purchase intentions (Tse and Poon, 2012, Limberger et al., 2014; Borges et al., 2015; Wang et al., 2015; Haddad et al., 2015). There are few articles analysing the influence of hotels features in determining room price. We only found three studies concluding that the price charged by the hotel depends on the number of stars, on the location of the hotel, and on the availability of other hotels in the same geographical area (Chen and Rothschild, 2010; Borges et al., 2015; Guillet and Mohammed, 2015). There is thus a lack of knowledge about the influence of the hotels’ operating conditions in the determination of the price charged, which justifies the conduction of new research on the association between other hotel features, the performance evaluation tools used, and the price charged. The price charged by the hotels is measured by the prices available, during a certain period of time, on the Booking.com platform. With respect to the first objective, the hotel features are those identified in previous studies as contingency variables to the performance evaluation methods used by the hotels, namely: the hotel category, identified by Alonso-Almeida et al. (2016) and measured by the number of stars; the legal form and the size, identified by Nunes and Machado (2014); and the geographical location, identified by Barros (2005). This study also intends to analyse an additional feature – the level of competitiveness to which the hotel is subject. The variable competitiveness level, although used in previous studies in other industries, has not been applied to the hotel industry (Lado-Sestayo et al., 2014). The construction of this variable was supported by studies by Barros (2005), Chiang (2006), and Lado-Sestayo et al. (2014), which suggest that the geographical concentration of the hotels increases the competitiveness level. With respect to the second objective, the performance evaluation tools analysed are those identified in previous studies as being very important for the hotel industry in particular, namely: the methods of evaluating hotel performance (McPhail et al., 2008); the interest in evaluating employee satisfaction and employee performance (Nadiri and Hussain, 2005; Evans, 2005; Park and Gagnon, 2006; McPhail et al., 2008; Sainaghi et al., 2013).
To meet the objectives of this study, two research questions were formulated – one to analyse the associations between price and hotel features, and the other to analyse the associations between price and the performance evaluation tools used:
Hotel Features - Category - Legal form - Geographic location - Size - Competitiveness level
Performance evaluation tools - PEM used
- Interest in evaluating employee performance
- Interest in evaluating employee satisfaction
• Research Question 1 - Is there an association between price and hotel features? • Research question 2 - Is there an association between price and the performance
evaluation tools used by the hotels? 3.2 – Data collection
The universe of this study was defined as the set of 4 and 5 star hotels located in Portugal. The exclusion of hotels of 3 stars or less was because a previous pilot study concluded that these hotels use few management accounting tools (Nunes and Machado, 2014). Using the information available at the public agency Turismo de Portugal, 478 hotels of 4 and 5 stars were identified in Portugal, thus defining the universe of this study.
Data collection took place through three sequential methods. Firstly, we carried out a survey to the hotel financial managers, to gather information about the performance evaluation tools used, and the legal form of the company the hotel belongs to. Regarding the tools used, the information requested for this study was the following: to identify the methods used to evaluate hotel performance; to identify whether the hotel evaluates its employees’ performance; to identify whether the hotel evaluates its employees’ satisfaction. The questionnaire was validated through a pilot test, as suggested by Machado and Alves (2017), with a convenience sample of two hotel managers, and two scholars with expertise in the field. The final questionnaire was modified to include the suggestions resulting from this pilot test, and only then was it sent to the universe, as suggested by Vicente et al. (2017). As a result of the four contact phases with the universe, 241 completed inquiries were received, which generates a response rate of 50.4%. The second method of data collection consisted in the creation of new additional features for the responding hotels. Three of them are available online: the category, measured by the number of stars (Alonso-Almeida et al., 2016); the size, measured by the number of rooms (Nunes and Machado, 2014); and the geographic location of the hotel. The fourth additional feature is the creation of a new variable that evaluates the level of competitiveness faced by the hotel. The variable level of competitiveness was measured by the concentration of the hotels by district or autonomous region, in the assumption that the greater the concentration of hotels in a given area, the greater the level of competitiveness the hotels face. To operationalize this feature, we resorted to the information available in the public agency Tourism of Portugal, regarding the distribution of the universe of this study in each district and autonomous region. The third method of data collection was to gather information on the price charged by the responding hotels, using the online platform Booking.com. We developed a set of procedures to minimize the bias that can occur in a variable of this type, namely: the prices of the 241 responding hotels were collected within 24 hours, for a night’s accommodation in a double room for one day of the following week. Both weeks, the one of data collection and the other regarding the price of the accommodation, belong to a period of average occupation, and do not coincide with any holidays.
Despite the high response rate, some authors suggest that a non-response of more than 20% may lead to a bias in the results, if the non-respondents have different features from the respondents (Machado, 2016; Laureano et al., 2016). In this study, there was no evidence of bias caused by the non-responding hotels, a conclusion drawn through the analysis of two factors. The first was the geographic coverage of the Portuguese
territory, where hotels from all the districts of the universe are represented, which suggests that the geographical representativeness factor is not indicative of biased results. The second was the size of the hotels, where we used the t-student test to compare the average size of the responding hotels with the non-responding ones. We obtained a p-value higher than 0.10, which does not allow us to reject the null hypothesis of average equality for both groups. There is thus no evidence that the size factor causes a bias in the results obtained in this study.
4 - ANALYSIS AND DISCUSSION OF THE RESULTS
4.1 – Hotel features and price
The data collected on the Booking.com platform show that the average price per night, charged by the hotels surveyed, is € 141, the median is € 114 and the mode is € 75. To analyse the associations between price and the other relevant variables to the study, a nominal variable with two response categories was created: the cheapest hotels, with a price equal to or lower than the median (n=121); and the more expensive hotels, which are priced above the median (n=120).
Regarding the hotel category, the results of this study show that the majority of the respondents (74%) belong to 4 star hotels. The association between the number of stars and the price charged by the hotels is presented in Table 1. The results obtained show that 5 star hotels are proportionally more expensive than 4 star hotels.
Table 1 – Hotel price and number of stars
Hotel price Number of stars TOTAL
Four Five
Cheaper 111 10 121
More expensive 68 52 120
TOTAL 179 (74%) 62 (26%) 241 (100%)
The objectives defined require the analysis of the association between the behaviour of these two nominal variables, which determines that the association test applicable is the Chi-Square test of independence (Siegel and Castellan, 1988). This test is based on the intersection of the response categories, where the absolute frequencies expected for each cell are calculated based on the theory of probabilities, and the null hypothesis is the independence of the variables (Mood et al., 1974). From the calculation of the Chi-Square test of independence, we obtained a value of 38.778 for a p-value of less than 0.001, which allows us to reject the null hypothesis of variable independence for a 1% error. These results lead to the conclusion that there is an association between the price charged and the hotel category. The intensity of this association can be measured by Cramer’s V coefficient, where we obtained a value of 0.401, which can be considered a strong association. However, Cramer’s coefficient is a symmetric association measure, which makes the validation of this association desirable through another measure that may provide additional information on the direction of the association. The Goodman and Kruskal’s Lambda is a test that defines the direction of the existing association between nominal variables, i.e., the dependent and the independent one (Siegel and
Castellan, 1988). The value of this test is based on the proportional reduction of the forecast error, with the value 1 meaning that this knowledge allows a 100% reduction of the forecast error regarding the behaviour of the dependent variable (Siegel and Castellan, 1988). This test has as null hypothesis a Lambda value of zero (Siegel and Castellan, 1988). We used the Goodman and Kruskal’s Lambda, which presented a value of 0.350, when the price variable is considered as dependent. The test results are statistically significant, for a 1% error, given that their p-value is less than 0.001, and confirm the direction of the association, i.e., it is the hotel category that influences the price.
Figure 2 presents a graphical analysis of this association, showing that most 5 star hotels charge higher prices (84%), while most 4 star hotels charge lower prices (62%). These results lead us to conclude that the price is proportionally higher in higher category hotels.
Figure 2 – Hotel price and number of stars
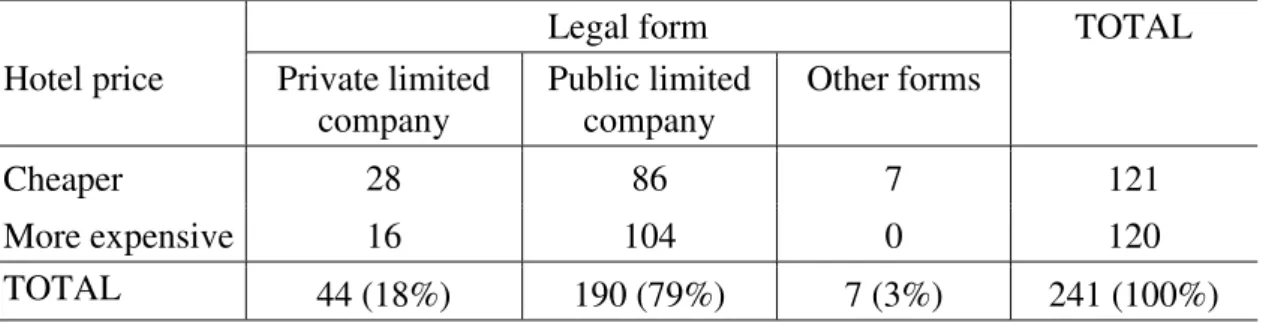
Regarding the legal form of the companies that support the hotel, the results presented show that the majority (79%) are public limited companies, only 18% of the hotels have a legal support in the form of private limited companies, and 3% are supported by companies with a legal form not specified by the respondents. Table 2 shows the association between the price and the legal form of the companies that own the hotels. The results presented make it clear that the hotels legally supported by public limited companies are proportionally more expensive than the hotels under the legal form of private limited companies.
Hotel price
Legal form TOTAL
Private limited
company Public limited company Other forms
Cheaper 28 86 7 121
More expensive 16 104 0 120
TOTAL 44 (18%) 190 (79%) 7 (3%) 241 (100%)
The Chi-Square test of independence presents a value of 11.974 for a p-value of less than 0.001, which leads to the conclusion that there is an association between the price charged and the legal form of the company supporting the hotel, for an error of 1%. Cramer's V coefficient, with a value of 0.223, suggests that this association is moderate. It was not possible to validate the direction of this association through Goodman and Kruskal’s Lambda. Figure 3 presents a graphical analysis of this association, showing that most hotels under the legal form of private limited companies practice lower prices (64%), while most hotels in the form of public limited companies (55%) practice higher prices. These results lead us to conclude that the price charged is proportionally higher in hotels owned by public limited companies.
Figure 3 – Hotel price and legal form
In terms of geographical location, the responding hotels are located in every Portuguese district and in the autonomous regions, namely: Lisbon (n=72), Faro (n=47), Porto (n=20), Madeira (n=13), Açores (n=11), Setúbal (n=10), Aveiro (n=7), Braga (n=7), Coimbra (n=7), Leiria (n=7), Santarém (N=7), Castelo Branco (n=6),Viana do Castelo (n=6), Viseu (n=6), Vila Real (n=4), Guarda (n=3), Évora (n=3), Portalegre (n=2), Bragança (n=2), and Beja (n=1). In view of the geographical dispersion of the respondents, the twenty districts and autonomous regions were grouped into six broader
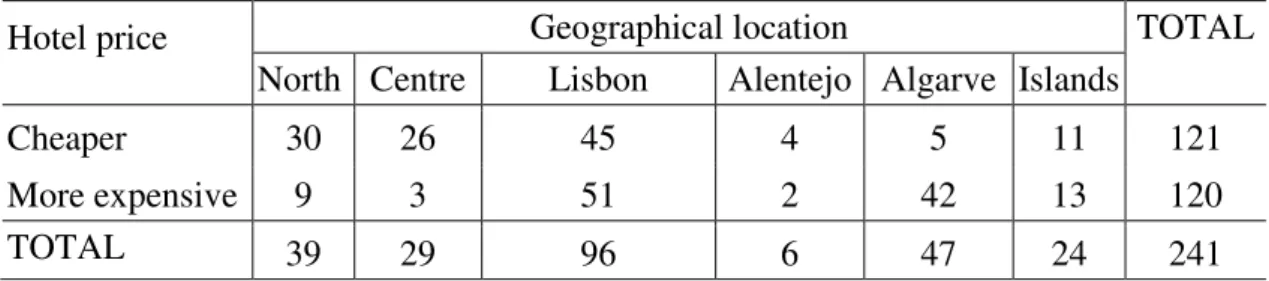
geographical areas: North (n=39), which includes the districts of Bragança, Porto, Braga, Viana do Castelo, and Vila Real; Centre (n=29), which includes the districts of Aveiro, Castelo Branco, Coimbra, Guarda, and Viseu; Lisbon and Tagus Valley (n=96), which includes the districts of Leiria, Lisbon, Santarém and Setúbal; Alentejo (n=6), which includes the districts of Beja, Évora, and Portalegre; Algarve (n=47), which includes the district of Faro; Islands (n=24), which includes the autonomous regions of the Azores and Madeira. Table 3 shows the association between price and location, highlighting the following: the hotels located in the North, Centre, and Alentejo, practice proportionally lower prices; the hotels located in the Islands, Algarve, and Lisbon, practice proportionately higher prices.
Table 3 – Hotel price and geographical location
Hotel price Geographical location TOTAL
North Centre Lisbon Alentejo Algarve Islands
Cheaper 30 26 45 4 5 11 121
More expensive 9 3 51 2 42 13 120
TOTAL 39 29 96 6 47 24 241
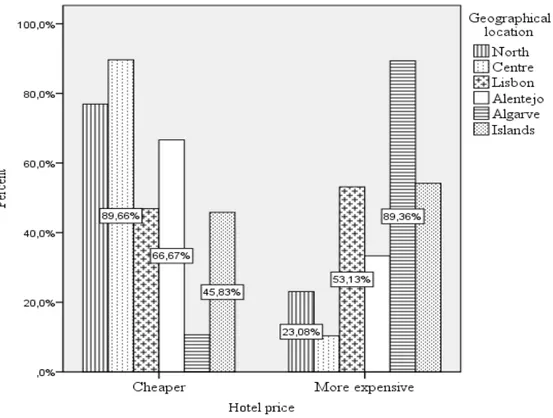
The Chi-Square test of independence presents a value of 59.882 for a p-value of less than 0.001, which leads to the conclusion that there is an association between the price charged and the geographical location of the hotel, for a 1% error. Cramer's V coefficient, with a value of 0.498, suggests that this association is strong. Goodman and Kruskal’s Lambda presents a value of 0.375, when the price variable is considered as dependent, for a p-value of less than 0.001, confirming that it is the variable geographical location that influences the price charged by the hotels.Figure 4 presents a graphical analysis of this association, showing that most hotels located in Lisbon (53%), in the Algarve (89%), and the Islands (54%) practice higher prices, while most hotels located in the North (77%), the Centre (90%), and in the Alentejo (67%) practice lower prices. Following these results, we conclude that the price charged is proportionally higher in hotels located in Lisbon and in the Algarve.
Regarding the characteristic size, location measures of central tendency show that the hotels surveyed have on average 135 rooms; the median of this variable is 112 rooms, and the mode is 30 rooms. For the purposes of analysing the associations between hotel size and the other variables relevant to the study, a nominal variable with two response categories was created, as suggested by Machado (2013): smaller hotels presenting a number of rooms equal to or less than the median (n=121), and the larger hotels, with a number of rooms above the median (n=120).Table 4 shows the association between the size of the hotel and the price charged, making it clear that larger hotels charge higher prices than smaller hotels.
Table 4 – Hotel price and size
Hotel price Hotel size TOTAL
Smaller size Larger size
Cheaper 75 46 121
More expensive 46 74 120
TOTAL 121 120 241
The Chi-Square test of independence presents a value of 13.480 for a p-value of less than 0.001, which leads to the conclusion that there is an association between the price charged and the hotel size, for a 1% error. Cramer's V coefficient, with a value of 0.237, suggests that this association is moderate. It was not possible to validate the direction of this association through Goodman and Kruskal’s Lambda.Figure 5 presents a graphical analysis of this association, showing that most of the larger hotels practice higher prices (62%), while the majority of the smaller hotels practice lower prices (62%). These results lead us to conclude that the price charged is proportionally higher in larger hotels.
Figure 5 – Hotel price and size
The variable competitiveness level was measured using the hotel concentration by district or autonomous region, assuming that the higher the hotel concentration in a given area, the greater the level of competitiveness the hotels face, as suggested by Barros (2005). To operationalize this variable, we analysed the concentration of 4 and 5 star hotels in each district and autonomous region, using the information available at the public agency Turismo de Portugal: the area in square kilometres (km2) of each district or region; the number of hotels of the universe in each district or region. Based on the area and the number of hotels, we calculated the ratio of km2 per hotel in each district or region. Following the results obtained, we conclude that the district of Lisbon and the autonomous region of Madeira, respectively with 25 km2 and 27 km2 per hotel, are the regions with the greater hotel concentration. The district of Beja with 5113 km2 per hotel, and that of Bragança with 2203 km2, are the districts with a lower hotel concentration. The average km2 per hotel at a national level is 741 km2, while the median is 300 km2 per hotel. Using the median again as a partition criterion, we constructed the variable competitiveness level with two response categories: the lowest competitiveness category (17%), including the hotels located in a district with a hotel concentration below or equal to the median (Beja, Bragança, Castelo Branco, Coimbra, Évora, Guarda, Portalegre, Santarém, Vila Real, and Viseu); the highest competitiveness category (83%), including the hotels located in a district or region with a hotel concentration above the median (Aveiro, Braga, Faro, Leiria, Lisbon, Porto, Setúbal, and Viana do Castelo, and the autonomous regions of the Azores and Madeira). Table 5 shows the association between the level of competitiveness and the price charged, making it clear that the hotels facing a higher level of competitiveness are proportionally more expensive than the hotels subject to a lower level of competitiveness.
Table 5 – Hotel price and competitiveness level
Hotel price Competitiveness level TOTAL
Lower competitiveness Higher competitiveness
Cheaper 34 87 121
More expensive 7 113 120
TOTAL 41 (17%) 200 (83%) 241 (100%)
The Chi-Square test of independence presents a value of 21.157 for a p-value of less than 0.001, which leads to the conclusion that there is an association between the price charged and the level of competitiveness the hotel faces, for an error of 1%. Cramer's V coefficient, with a value of 0.296, suggests that this association is moderate. Goodman and Kruskal’s Lambda presents the value of 0.217, when the price variable is considered as dependent, for a p-value of 0.064, confirming that it is the level of competitiveness that influences the price charged by the hotel. Figure 6 presents a graphical analysis of this association, showing that the majority of the hotels facing a lower level of competitiveness practice lower prices (83%), while most hotels facing greater competition practice higher prices (57%). Following these results, we conclude that the price charged is proportionally higher in hotels facing a higher level of competitiveness.
Figure 6 – Hotel price and competitiveness level
The results obtained in this research question lead us to the conclusion that the hotels of greater category and size, with the legal form of public limited companies, located in Lisbon and the Algarve, and subject to a greater level of competitiveness, practice a proportionally higher price. This study also contributes to the understanding about the
direction of these associations, as it proves statistically that it is the hotel’s category, its location and the level of competitiveness it faces that influence the price charged.
4.2 – Performance evaluation tools and price
The second research question aims to analyse whether the method of performance evaluation used, and the interest in evaluating employee performance and satisfaction, are associated with customer satisfaction.
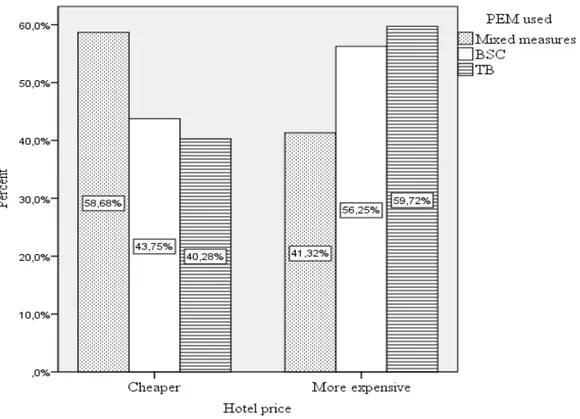
Regarding the performance evaluation method (PEM) used, the data collected show that 4 and 5 star hotels use the methods already identified by Nunes and Machado (2014): none of the hotels use only financial measures to evaluate their performance, which is considered by the theory as an inadequate method; half of the hotels use a set of financial and non-financial measures, called mixed measures; the other half uses two methods integrated in theoretical models with a specific conceptual structure, namely the Tableau de Bord (30%), and the Balanced Scorecard (20%), the latter being considered by the theory as the most suitable for hotels (Kala and Bagri, 2013). The association between the price charged and the PEMs used is presented in Table 6, showing that the hotels using the Tableau de Bord (TB) and the Balanced Scorecard (BSC) charge higher prices proportionally more, when compared to the hotels that use simpler methods.
Table 6 – Hotel price and PEMs used
Hotel price PEM used TOTAL
Mixed measures BSC TB
Cheaper 71 21 29 121
More expensive 50 27 43 120
TOTAL 121 (50%) 48 (20%) 72 (30%) 241 (100%)
The Chi-Square test of independence presents a value of 7.113 for a p-value of 0.029, which leads to the conclusion that there is an association between the price charged by the hotels and the PEM used, for a 5% error. Cramer's V coefficient, with a value of 0.172, suggests that this association is weak. Goodman and Kruskal’s Lambda presents a value of 0.167, when the price variable is considered as dependent, for a p-value of 0.066, confirming that it is the method used that influences the price.Figure 7 presents a graphical analysis of this association, showing that most hotels using the BSC (56%), and the TB (60%) charge higher prices, while most hotels using mixed unstructured measures practice lower prices (59%). Following these results, we conclude that the price charged is proportionally higher in hotels that use the more sophisticated PEMs. Figure 7 – Hotel price and PEMs used
Secondly, we asked the financial managers to identify whether the hotel uses formal mechanisms to evaluate the performance of its employees. We considered that the hotel has an interest in evaluating the employees’ performance when it uses formal methods to carry out this evaluation. The data collected show that only 63% of the hotels evaluate employee performance. The association between customer satisfaction and an interest in evaluating employee performance is presented in Table 7, making it clear that hotels that evaluate employee performance are proportionally more expensive than other hotels.
Table 7 – Hotel price and interest in evaluating employee performance
Hotel price Evaluation of employee performance TOTAL No evaluation Evaluation
Cheaper 60 61 121
More expensive 28 92 120
TOTAL 88 (37%) 153 (63%) 241 (100%)
The Chi-Square test of independence presents a value of 17.914 for a p-value of less than 0.001, which leads to the conclusion that there is an association between the price charged by the hotels and the interest in evaluating employee performance, for a 1% error. Cramer's V coefficient, with a value of 0.273, suggests that this association is moderate. Goodman and Kruskal’s Lambda presents a value of 0.258, when the price variable is considered as dependent, for a p-value of 0.011, confirming that it is the interest for evaluating employee performance that influences the price. Figure 8 presents a graphical analysis of this association, showing that most hotels that evaluate employee performance practice higher prices (60%), while most hotels that do not perform this evaluation practice lower prices (68%). These results lead us to conclude that the price
charged is proportionally higher in hotels that evaluate the performance of their employees.
Figure 8 – Hotel price and interest in evaluating employee performance
Thirdly, the financial managers were asked to identify whether the hotel uses formal mechanisms to evaluate their employees’ satisfaction. We consider that the hotel has an interest in evaluating employee satisfaction when it conducts satisfaction surveys. Although the evaluation of employee satisfaction is considered by the theory as an essential tool for maximizing hotel performance (Park and Gagnon, 2006), the data collected show that most hotels do not evaluate it (53%). Table 8 presents the association between price and interest in evaluating employee satisfaction, making it clear that hotels that evaluate employee satisfaction are proportionally more expensive than hotels that do not perform this evaluation.
Table 8 – Hotel price and interest in evaluating employee satisfaction
Hotel price Evaluation of employee satisfaction TOTAL No evaluation Evaluation
Cheaper 76 45 121
More expensive 51 69 120
TOTAL 127 (53%) 114 (47%) 241 (100%)
The Chi-Square test of independence presents a value of 9.970 for a p-value of 0.002, which permits us to conclude that there is an association between price and the interest in evaluating employee satisfaction, for a 1% error. Cramer's V coefficient, with a value of 0.201, suggests that this association is moderate. Goodman and Kruskal’s Lambda
presents a value of 0.200, when the price variable is considered dependent, for a p-value of 0.023, confirming that it is the interest for evaluating employee satisfaction that influences the price. Figure 9 presents a graphical analysis of this association, showing that most hotels that evaluate employee satisfaction practice higher prices (61%), whereas most hotels that do not perform this evaluation practice lower prices (60%). Following these results, we conclude that the price charged is proportionally higher in hotels that evaluate employee satisfaction.
Figure 9 – Hotel price and interest in evaluating employee satisfaction
5 – CONCLUSIONS
This study has two specific objectives: to analyse whether hotel features and the performance evaluation tools used are associated with the price charged by the hotels. Regarding the first objective, the results show that hotels of higher category and size, with the legal form of public limited companies, located in Lisbon and the Algarve, and subject to a higher level of competitiveness, practice a proportionally higher price. This study also contributes to the understanding of the direction of these associations, as it proves statistically that it is the hotel’s category, its location and the level of competitiveness it faces that influence the price charged.
Regarding the second objective, the performance evaluation tools used, the results show that the hotels using more sophisticated PEMs, and that evaluate employee performance and satisfaction practice a proportionally higher price. This study also contributes to the understanding of the direction of these associations, as it proves statistically that it is the PEM used, and the interest in evaluating employee performance and employee satisfaction that influence the price charged, which suggests that the hotels pass on to the price the cost of using more sophisticated performance assessment tools.
The main limitations of this study are the following: the fact that the method of data collection used did not permit the clarification of doubts regarding the questions asked to the hotel financial managers; the possibility that the variable legal form is distorted by the existence of hotels that identified other unspecified forms; the ways in which the variables interest in evaluating employee satisfaction and employee performance were measured. However, we consider that this study fills a knowledge gap identified in the literature review, regarding the influence of the hotels’ operating conditions on the price charged, since it helps us conclude that the hotel features, and the performance evaluation tools used influence the price charged.
We suggest that new studies be carried out, using a qualitative research paradigm based on case studies that explore the role of each feature now validated on the price charged by the hotels. We suggest also that new studies be carried out using other measures for the interest in evaluating employee satisfaction and employee performance, namely the average values of the results of those evaluations.
REFERENCES
Alonso-Almeida, M., Celemin-Pedroche, M. Rubio-Andrade, L. and Rodrigues-Antón, J. (2016) ‘Human and other critical factors in organizational learning in the hotel industry: a contingency approach’, Tourism & Management Studies, Vol. 12, No. 1, pp. 97-106.
Barros, C. (2005) ‘Measuring efficiency in the hotel sector’, Annals of Tourism
Research, Vol. 32, No. 2, pp. 456–477.
Borges, I., Pereira, G., Matos, C. and Borchardt, M. (2015) ‘Analysis of the relationship between the satisfaction of consumers and the prices offered on site booking.com’, Tourism & Management Studies, Vol. 11, No. 2, pp. 64-70. Chen, C., and Rothschild, R. (2010) ‘An application of hedonic pricing analysis to the
case of hotel rooms in Taipei’, Tourism Economics, Vol. 16, No. 3, pp. 685-696. Chiang, W. (2006) ‘An hotel performance evaluation of Taipei international tourist
hotels – using data envelopment analysis’, Asia Pacific Journal of Tourism
Research, Vol. 11, No. 1, pp. 29–42.
Espinet, J., Fluvià, M., Rigall-I-Torrent, R. and Saló, A. (2012) ‘Hotel characteristics and seasonality in prices: an analysis using Spanish tour operators' brochures’,
Tourism Economics, Vol. 18, No. 4, pp. 749-755.
Evans, N. (2005) ‘Assessing the balanced scorecard as a management tool for hotels’,
International Journal of Contemporary Hospitality Management, Vol. 17, No. 5,
pp. 376-390.
Gani, W. (2017) ‘Detection of abusively low prices in Tunisian public procurement using control charts’, International Journal of Procurement Management, Vol. 10, No. 5, pp. 568-580.
Guillet, B. and Mohammed, I. (2015) ‘Revenue Management research in hospitality and tourism, a critical review of current literature and suggestions for future research’, International Journal of Contemporary Hospitality Management, Vol. 27, No. 4, pp. 527-561.
Haddad, R., Hallak, R. and Assaker, G. (2015) ‘Price fairness perceptions and hotel costumers’ behavioral intentions’, Journal of Vacations Marketing, Vol. 21, No. 3, pp. 262-276.
Heikka, E. and Mustak, M. (2017) ‘Purchaising of knowledge-intensive business services: a case study of relevant factors’, International Journal of Procurement
Management, Vol. 10, No. 1, pp. 21-37.
Kala, D. and Bagri, S. (2013) ‘Applicability of Balanced Scorecard in Hotels’, Journal
of Tourism, Vol. XIV, No. 2, pp. 77–87.
Kaplan, R. and Norton, D. (1996), The Balanced Scorecard: Translating Strategy into
action, Harvard Business School Press, Boston.
Lado-Sestayo, R., Otero-Gonzáles, L. and Vivel-Búa, M. (2014) ‘Impacto de la localización y la estructua de mercado en la rentabilidad de los establecimientos hoteleros’, Tourism and Management Studies, Vol. 10, No. 2, pp. 41-49.
Laureano, R., Machado, M. and Laureano, L. (2016) ‘Maturity in management accounting: exploratory study in Portuguese SME’, Society and Economy, Vol. 38, No. 2, pp. 139-156.
Limberger, P., Anjos, F., Meira, J. and Anjos, S. (2014) ‘Satisfaction in hospitality on TripAdvisor.com: An analysis on the correlation between evaluation criteria and overall satisfaction’, Tourism and Management Studies, Vol. 10, No. 1, pp. 59-65.
Machado, M. (2013) ‘Balanced Scorecard: Empirical Study on Small and Medium Size Enterprises’, Review of Business Management, Vol. 15, No. 46, pp. 129-148. Machado, M. (2016) ‘Product valuation methods: empirical study on industrial SME’,
International Business Management, Vol. 10, No. 1, pp. 9-17.
Machado, M. and Alves, P. (2017) ‘Quality in management accounting: approach by activities in large companies’, International Journal of Productivity and Quality
Management, Vol. 21, No. 3, pp. 392-409.
McPhail, R., Herington, C. and Guilding, C. (2008) ‘Human resource managers’ perceptions of the applications and merit of the balanced scorecard in hotels’,
International Journal of Hospitality Management, Vol. 27, No. 4, pp. 623–631.
Mood, A., Graybill, F. and Boes, D. (1974) Introduction to The Theory of Statistics, 3th ed., McGraw-Hill, New York.
Nadiri, H. and Hussain, K. (2005) ‘Perceptions of service quality in North Cyprus hotels’, International Journal of Contemporary Hospitality Management, Vol. 17, No. 6, pp. 469-480.
Nunes, C. and Machado, M. (2014) ‘Performance evaluation methods in the hotel industry’, Tourism & Management Studies, Vol. 10, No. 1, pp. 23–29.
Park, J. and Gagnom, G. (2006) ‘A causal relationship between the Balanced Scorecard perspectives’, Journal of Human Resources in Hospitality & Tourism, Vol. 5, No. 2, pp. 91–116.
Rabbani, M., Aghsami, A., Farahmand, S. and Keyhanian, S. (2018) ‘Risk and revenue of a lessor’s dynamic joint pricing and inventory planning with adjustment costs under differential inflation’, International Journal of Procurement Management, Vol. 11, No. 1, pp. 1-35.
Sainaghi, R., Phillips, P. and Corti, V. (2013) ‘Measuring hotel performance: using a balanced scorecard perspectives’ approach’, International Journal of Hospitality
Management, Vol. 34, No. 1, pp. 150-159.
Siegel, S. and Castellan, N. (1988) Nonparametric statistics for the behavioral sciences, McGraw-Hill, New York.
Singh, R. and Acharya, P. (2014) ‘Performance evaluation of supply chain management systems: a critical review of literature’, International Journal of Procurement
Tse, T. and Poon, Y. (2012) ‘Revenue Management: resolving a revenue optimization paradox’, International Journal of Contemporary Hospitality Management, Vol. 24, No. 4, pp. 507-521.
Vicente, C., Laureano, R. and Machado, M. (2017) ‘The image of and the interest in the accounting profession: an empirical study in three social groups’, International
Journal of Business Excellence, Vol. 12, No. 4, pp. 433-449.
Wang, M., Lu, Q., Chi, R. and Shi, W. (2015) ‘How word-of-mouth moderates room price and hotel stars for online booking, an empirical investigation with Expedia data’, Journal of Electronic Commerce Research, Vol. 16, No. 1, pp. 72–80. Williams, A. (2014) ‘Re-examining procurement tenders with respect to price: a
transaction cost model of Portland procurement agencies’, International Journal