Universidade de Lisboa
Faculdade de Medicina de Lisboa
Characterization of adenosinergic system in Rett Syndrome
Catarina Miranda Lourenço
Mestrado em Neurociências
Dissertação
Universidade de Lisboa
Faculdade de Medicina de Lisboa
Characterization of adenosinergic system in Rett Syndrome
Catarina Miranda Lourenço
Orientadores: Maria José Diógenes (PhD), Cláudia Gaspar (PhD),
Sofia Duarte (MD)
Mestrado em Neurociências
Dissertação
Todas as afirmações efetuadas no presente documento são da exclusiva responsabilidade do seu autor, não cabendo qualquer responsabilidade à Faculdade de Medicina de Lisboa pelos conteúdos nele apresentados.
A impressão desta dissertação foi aprovada pelo Conselho Científico da
Faculdade de Medicina de Lisboa em reunião de 22 de Setembro de 2015.
v The scientific content of the present thesis is included in the manuscript currently in
preparation:
“Adenosine receptors as new therapeutic targets in Rett syndrome”.
Other papers where the author of this thesis participate during her master:
Sandau US, Colino-Oliveira M, Parmer M, Coffmana SQ, Liub L, Miranda-Lourenço C, Palminha C, Batalha VL, Xu Y, Huo Y, Diógenes MJ, Sebastião AM, Boison D, “Adenosine kinase deficiency in the brain triggers enhanced synaptic plasticity” – Under review;
Ribeiro FF, Xapelli S, Fonseca Gomes J, Miranda-Lourenço C, Tanqueiro SR, Diógenes MJ, Ribeiro JA, Sebastião AM, “Nucleosides in neuroregeneration and neuroprotection” – Submitted.
vii
Index
Figure index ... ix
Table Index ... xi
Abbreviations list ... xiii
Resumo ... v
Abstract ... ix
1. Introduction ... 1
1.1 Rett Syndrome ... 1
1.1.1 Genetic Basis ... 2
1.2 Rett Syndrome disease modelling ... 7
1.2.1 Mouse models ... 7
1.2.2 Induced Pluripotent Stem Cells (IPSCs) ... 8
1.3 Adenosine ... 12
1.3.1 Adenosine metabolism ... 13
1.3.2 Adenosine receptors ... 14
1.3.3 Adenosine and pathology ... 18
1.4 BDNF ... 21
1.4.1 BDNF expression ... 21
1.4.2 BDNF signalling upon TrkB receptors ... 22
1.4.3 Interaction between adenosine and BDNF ... 23
2. Aims ... 25
3. Materials and Methods ... 27
3.1 Biological Samples ... 27
3.1.1 Animals ... 27
3.1.2 Post-mortem Brain Sample ... 27
3.2 Human Induced Pluripotent Stem Cells (hIPSCs) ... 27
3.2.1 Cell lines ... 27
3.2.2 Materials ... 29
3.2.3 Matrigel dish coating ... 30
3.2.4 Laminin coating ... 31
3.2.5 hIPSCs expansion ... 31
3.2.6 Neuronal induction, the dual SMAD inhibition protocol ... 32
3.3 Molecular Biology Techniques ... 34
viii
3.3.2 ELISA assay... 36
3.3.3 Immunohistochemistry ... 36
3.3.4 RNA extraction and cDNA synthesis ... 38
3.3.5 Quantitative PCR ... 39
3.4 Electrophysiology ... 41
3.4.1 Ex vivo electrophysiological recordings ... 41
3.5 Data analysis ... 43
4. Results ... 45
4.1 Characterization of adenosine receptors in Mecp2 KO mice model ... 45
4.1.1 Rational ... 45
4.1.2 Adenosine receptors changes in Mecp2 KO mice ... 47
4.1.3 Adenosine kinase as a possible cause of adenosine impairment in Mecp2 KO mice ... 49
4.2 BDNF signalling impairment in Mecp2 KO mice ... 51
4.2.1 Rational ... 51
4.2.2 BDNF protein expression level in Mecp2 KO mice ... 52
4.2.3 TrkB receptors characterization in Mecp2 KO mice ... 52
4.3 Exploring adenosinergic system through neurons-derived from hIPSCs and in human brain sample……….54
4.3.1 Rational ... 54
4.3.2 Characterization of hIPSCs ... 54
4.3.3 Adenosine receptors expression in hIPSCs and human brain sample ... 60
4.3.4 BDNF signalling impairment ... 63
5. Discussion ... 71
6. Acknowledgments ... 77
ix
Figure index
Figure 1.1 - Onset and clinical manifestations of RTT. ... 2
Figure 1.2 - Structure of MECP2 gene. . ... 4
Figure 1.3 - MeCP2 protein structure, mutations and associated impairments in RTT. ... 5
Figure 1.4 - MeCP2 and its functions.. ... 6
Figure 1.5 - Schematic representation of hIPSCs production and possible applications. ... 9
Figure 1.6 – Phenotypical characteristics of neurons-derived from RTT-hIPSCs. ... 10
Figure 1.7 - Challenges in RTT-IPSCs modelling. ... 11
Figure 1.8 - Adenosine structure.. ... 12
Figure 1.9 - Adenosine formation and catabolism... 14
Figure 1.10 - Adenosine receptors structure.. ... 15
Figure 1.11 - Adenosine signalling pathways.. ... 17
Figure 1.12 - Adenosine receptors are targeted in several disorders.. ... 20
Figure 1.13 - BDNF signalling through TrkB full-length (TrkB-FL) receptors.. ... 23
Figure 3.1 - Schematic representation of neuronal differentiation, described in sections 3.2.5 and 3.2.6. ... 33
Figure 3.2 - Extracellular recording from hippocampal slices. ... 42
Figure 4.1 - Changes in fEPSP induced by DPCPX and CPA. ... 45
Figure 4.2 - A1R protein expression level in Mecp2 KO mice... 45
Figure 4.3 - A1R mRNA relative expression in Mecp2 KO mice. ... 48
Figure 4.4 - A2AR mRNA relative expression and protein expression level in Mecp2 KO mice. ……….……..48
Figure 4.5 - ADK protein expression level in Mecp2 KO mice………..………...49
Figure 4.6 - fEPSP changes induced by ITU and ITU+DPCPX. ………50
Figure 4.7 - TrkB-FL and TrkB-Tc protein expression level in Mecp2 KO mice…………..………..51
Figure 4.8 - BDNF concentration in Mecp2 KO mice. ... 52
Figure 4.9 - TrkB-FL and TrkB-T1 mRNA relative expression in Mecp2 KO mice. ... 53
Figure 4.10 - Stages of neuronal differentiation and cell type specific markers……….56
Figure 4.11 - Characterization of the first 3 stages of neuronal induction. ... 58
Figure 4.12 - Characterization of final neuronal differentiation stage….………….………..59
Figure 4.13 - Neuronal and glial-marker expression in neurons-derived from hIPSCs.………59
Figure 4.14 - A1R mRNA relative expression in neurons-derived from hIPSCs and in RTT human brain ………61
x Figure 4.15 - A2AR mRNA relative expression in neurons-derived from hIPSCs and in RTT human brain
………...………62 Figure 4.16 - ADK protein expression level in neurons-derived from hIPSCs. …………..……….63 Figure 4.17 - BDNF mRNA relative expression in neurons-derived from hIPSCs and in RTT human brain ………..………....64 Figure 4.18 - BDNF concentration in neurons-derived from hIPSCs..………..65 Figure 4.19 - TrkB-FL mRNA relative expression in neurons-derived from hIPSCs and in RTT human
brain……….. 66
Figure 4.20 - TrkB-FL protein expression level in neurons-derived from hIPSCs. ……….……. 67 Figure 4.21 - TrkB-T1 mRNA relative expression in neurons-derived from hIPSCs and in RTT human
brain. ……….….. 68
xi
Table Index
Table 3-1 - Characterization of hIPSCs lines. ... 28
Table 3-2 - Reagents for hIPSCs expansion and neuronal induction. ... 29
Table 3-3 - Medium formulation for hIPSCs expansion and neuronal induction. ... 30
Table 3-4 - Western-Blot primary antibodies. ... 35
Table 3-5 - Western-Blot secondary antibodies. ... 35
Table 3-6 - Immunohistochemistry primary antibodies. ... 37
Table 3-7 - Immunohistochemistry secondary antibodies. ... 38
Table 3-8 - Primer sequence and annealing temperature for all primer pairs used for quantitative analysis. ... 40
Table 3-9 - Drugs used in electrophysiology. ... 43
Table 4-1 - Neuronal markers used to characterize hIPSCs.. ... 55
xiii
Abbreviations list
A1R - Adenosine A1 receptor
A2AR - Adenosine A2A receptor
A2BR - Adenosine A2B receptor
A3R - Adenosine A3 receptor
aCSF - Artificial cerebrospinal
fluid
AD - Alzheimer’s disease ADA - Adenosine deaminase ADK - Adenosine kinase ADP – Adenosine diphosphate AKT - Protein kinase B AMP - Adenosine
monophosphate
AR - Adenosine receptors ATP - Adenosine triphosphate BDNF – Brain-derived
neurotrophic factor
BRN2 - Brain-2
BSA - Bovine serum albumin CA1-3 - Cornu Ammonis, areas
1-3
cAMP - Cycle adenosine
monophosphate
cDNA - Complementary DNA CNS - Central nervous system CPA -
N6-Cyclopentyladenosine
CpG - -C-phosphate-G CREB - cAMP response
element-binding protein
CTD - C-terminal domain CypA - PPIA peptidylprolyl
isomerase A (cyclophilin A) DAG - Diacylglycerol dATP - Deoxyadenosine triphosphate dCTP - Deoxycytidine triphosphate dGTP - Deoxyguanosine triphosphate
DNA - Deoxyribonucleic acid DPCPX -
1,3-Dipropyl-8-cyclopentylxanthine
DTT - Dithiothreitol dTTP - Deoxythymidine
triphosphate
DMSO - Dimethyl sulfoxide EDTA -Ethylenediaminetetraacetic acid ELISA - Enzyme-Linked Immunosorbent Assay ER - Endoplasmic reticulum Erk - Extracellular
signal-regulated kinases
FBS - Fetal bovine serum fEPSP - Field excitatory
post-synaptic potential
FOXG1 -Forkhead box protein
G1
GABA - γ-AminoButyric Acid GAPDH -
Glyceraldehyde-3-phosphate dehydrogenase
GFAP - Glial fibrillary acidic
protein
HD - Huntington’s disease HDACs - Histona deacetilases hIPSCs - Human induced
pluripotent stem cells
ID - Inter domain
IP3 - Inositol
1,4,5-triphosphate
IPSCs - Induced pluripotent
stem cells
IRAK1 - Interleukin-1
receptor-associated kinase Km - Michaelis menton constant KO - knockout LTD - Long-term depression LTP - Long-term potentiation MAP2 - microtubule-associated protein 2 MAPK - Mitogen-activated protein kinases
MBD - Methyl binding domain MeCP2 - Methyl CpG binding
protein 2
mTOR - Mammalian target of
rapamycin
NF-kB - factor nuclear kappa B NGF - nerve growth factor NLS - Nuclear localization signals NMDA - N-methyl-D-aspartic acid NT-3(4/5) - neurotrophin-3(4/5) NTD - N-terminal domain OCT3/4 - Octamer-binding transcription factor 4/3 (POU5F1)
OMIM - Online Mendelian
Inheritance in Man
OTX2 - Orthodenticle
homeobox 2
v PBS - Phosphate-buffered saline PD - Parkinson’s disease PenStrep - Penicillin Streptomycin PFA - paraformaldehyde PI3K - Phosphoinositide 3-kinase PIP2 - Phosphatidylinositol-4,5-bisphosphate PK - Protein kinase PLC - Phospholipase C PLD - Phospholipase D PNS - Peripheral nervous system PVDF - Polyvinylidene fluoride qPCR - Quantitative
polymerase chain reaction
RCP - Red Opsin gene RIPA -
Radio-Immunoprecipitation Assay
Rpl13A - Ribosomal protein
L13A
RNA - Ribonucleic acid RT - Reverse transcription RTT - Rett Syndrome
SAH - S-adenosylhomocysteine SDS-PAGE - Sodium dodecyl
sulphate-polyacrylamide-gel electrophoresis
SIN3A - Paired amphipathic
helix protein Sin3a
SNAP25 -
Synaptosomal-associated protein 25
SOX2 - Sex determining region
Y-box 2 TBR1 - T-box, brain, 1 TBR2 - T-Box, brain, 2 TBS-T - Tris-Buffered Saline and Tween 20 TRD - Transcription repression domain Trk – tropomyosin-related kinase Trk(B)-FL -
tropomyosin-related kinase (B) full-lengh
TrkB-T1 - tropomyosin-related
kinase B T1 isoform
Trk(B)-Tc -
tropomyosin-related kinase (B) truncated isoforms
TUJ1 - Neuron-specific class III
β-tubulin
UTR - Untranslated region VGAT - Vesicular GABA
transporter
VGLUT - Vesicular glutamate
transporter
WT - wild type XCI -X-chromosome
inactivation
ZO1 -Tight junction protein
v
Resumo
A Síndrome de Rett (RTT) é uma doença rara do neurodesenvolvimento e de causa genética que afeta cerca de 1:10000 raparigas em todo o mundo. Esta doença caracteriza-se por um aparente normal desenvolvimento até aos 6 a 18 meses de idade, seguido de uma fase de regressão, na qual ocorre a perda das capacidades já adquiridas. Entre outros sintomas, destacam-se: severa disfunção cognitiva e motora, epilepsia e aparecimento de movimentos estereotipados e repetitivos das mãos com progressiva perda da sua funcionalidade.
Estudos genéticos mostraram que esta síndrome se deve, maioritariamente, a mutações no gene methyl CpG binding protein 2 (MECP2) localizado no cromossoma X. Este gene codifica a proteína MeCP2, um modulador epigenético e regulador da estrutura da cromatina, com funções primordiais no desenvolvimento e maturação do Sistema Nervoso Central (central nervous system - CNS). Uma das proteínas cuja expressão é controlada pela MeCP2 é o fator neurotrófico derivado do cérebro (brain-derived neurotrophic factor - BDNF), conhecido pelas suas importantes funções na maturação e diferenciação celular, plasticidade sináptica e sobrevivência neuronal. Consequentemente, alterações na MeCP2 podem comprometer os níveis de expressão e função do BDNF.
Estudos em modelos animais, que reproduzem a maioria dos sintomas característicos da RTT, demonstraram que o aumento da expressão do BDNF consegue reverter parcialmente algumas das disfunções e sintomas desta síndrome. Contudo, o uso terapêutico de BDNF não é ainda exequível uma vez que a barreira hematoencefálica (blood-brain barrier - BBB) é impermeável a este fator neurotrófico, impedindo-o de chegar ao cérebro e desempenhar adequadamente as suas funções. Na tentativa de facilitar os efeitos do BDNF, têm-se desenvolvido novas estratégias envolvendo, por exemplo, a utilização de fármacos que atravessando a BBB potenciem a ação neuroprotetora do BDNF. Um dos fármacos que tem merecido particular atenção é a adenosina. A adenosina é um neuromodulador do CNS que exerce as suas funções através da ativação de quatro recetores, A1, A2A, A3 e A2B. Em particular,
a ativação dos recetores A2A é fulcral para a manutenção dos níveis de BDNF e do seu recetor,
TrkB-FL, assim como para os seus efeitos sinápticos. É de realçar que, o sistema adenosinérgico, para além de ser crucial na sinalização mediada pelo BDNF, também tem um
vi papel de destaque no controlo da excitabilidade sináptica através da ativação dos recetores inibitórios do tipo A1, reconhecidos como potenciais alvos terapêuticos no controlo da
epilepsia. Estas ações da adenosina sugerem a possibilidade de este neuromodulador também estar afetado na RTT. De facto, estudos preliminares, realizados no nosso laboratório, apontam para a existência de uma disfunção do sistema adenosinérgico em associação à desregulação já conhecida da sinalização mediada pelo BDNF na RTT.
Assim, este projeto teve como principal objetivo fazer a caracterização detalhada do sistema adenosinérgico e da sinalização mediada pelo BDNF, através da utilização de: 1) modelo animal, ratinho mutante Mecp2 knockout (KO); 2) modelo humano, neurónios derivados de células pluripotentes induzidas humanas (human induced pluripotent stem cells - hIPSCs) de pacientes com RTT e 3) tecido cerebral humano recolhido durante autópsia realizada a paciente com RTT.
Ensaios de ligação anteriormente realizados já tinham mostrado um aumento dos níveis proteicos dos recetores A1 em amostras de córtex cerebral de ratinhos Mecp2 KO
quando comparado com amostras de ratinhos WT, não havendo alterações na expressão do seu mRNA. No presente trabalho, ensaios de Western-Blot revelaram uma diminuição significativa dos recetores do tipo A2A no córtex cerebral dos ratinhos Mecp2 KO, não tendo
sido contudo, detetadas alterações nos níveis de expressão do mRNA avaliados por polimerase chain reaction (PCR) quantitativo. Curiosamente, registos eletrofisiológicos realizados no hipocampo destes animais sugerem uma diminuição dos níveis de adenosina endógena, que não é atribuível a variações nos níveis proteicos de um dos enzimas responsáveis pela degradação da adenosina, adenosina cinase (Adenosine Kinase - ADK).
No modelo animal, os resultados, obtidos por ELISA, confirmaram que os níveis proteicos de BDNF estão bastante diminuídos. Semelhante resultado foi obtido para os níveis dos seus recetores TrkB-FL quando avaliados pela técnica de Western Blot, não havendo, contudo, alterações significativas nos recetores truncados deste fator neurotrófico (TrkB-Tc). No entanto, os níveis de expressão de mRNA para as duas isoformas do recetor TrkB (TrkB-FL e TrkB-T1 – isoforma truncada) não mostraram alterações significativas.
Em neurónios derivados de hIPSCs, a avaliação dos recetores adenosinérgicos (A1 e
vii considerável variabilidade, não sendo por isso possível fazer uma comparação com os resultados obtidos no modelo animal. Relativamente ao estudo dos níveis proteicos de BDNF, neste modelo, observou-se uma tendência para aumento e, pelo contrário, registou-se uma tendência para diminuição dos níveis de expressão dos seus recetores.
Os resultados obtidos a partir da amostra de córtex temporal de uma paciente com RTT mostraram um aumento da expressão de mRNA dos recetores A1 e uma diminuição da
expressão de mRNA dos recetores A2A. No que respeita aos recetores TrkB, observou-se um
aumento da expressão do mRNA que codifica para o recetor TrkB-FL. Não se observou contudo alteração no mRNA para o recetor TrkB-T1. Em associação, não foi observada alteração na expressão de mRNA que codifica para o BDNF.
Neste trabalho, o maior problema encontrado foi a variabilidade observada, não só entre as linhas celulares provenientes de indivíduos do mesmo género, como também entre as rondas independentes de diferenciação da mesma linha parental. Parte dessa variabilidade pode estar relacionado com as múltiplas alterações genéticas e epigenéticas que ocorrem durante os procedimentos de reprogramação e de diferenciação, tais como a fixação de mutações aleatórias esporádicas e a inativação aleatória do cromossoma X em linhas femininas. Uma outra importante fonte de variabilidade é a eficiência da produção de neurónios corticais, que é propensa a flutuar comprometendo os resultados. Ainda que alguns resultados mostrem tendências concordantes entre os modelos estudados, é difícil retirar conclusões a partir destes, o que é ainda mais agravado pelo reduzido tamanho da amostra.
Globalmente, os resultados apontam para uma disfunção na sinalização mediada quer pelo BDNF quer pelo sistema adenosinérgico, sugerindo um possível envolvimento de ambos na fisiopatologia da doença. Estas evidências abrem novas perspetivas para a intervenção farmacológica nesta patologia.
ix
Abstract
Rett Syndrome (RTT) is a genetic neurodevelopmental disorder, with an incidence of 1:10,000 female live births. This disorder is the main genetic cause of intellectual disability in females and it is mainly caused by mutations in the methyl-CpG binding protein 2 (MECP2) gene.
The MeCP2 protein, codified by the MECP2 gene, is an epigenetic modulator that controls chromatin structure. This protein is known to modulate the expression of brain-derived neurotrophic factor (BDNF), a neurotrophin with essential functions in cell differentiation, synaptic plasticity and survival. Furthermore, BDNF overexpression can partially ameliorate some RTT associated symptoms. Thus, therapeutic strategies designed at delivering BDNF to the brain could be a breakthrough for RTT. However, this strategy has been hampered by the inability of BDNF to cross the blood-brain barrier (BBB). The development of new therapeutic strategies is, therefore, of the outmost importance.
The adenosine is a neuromodulator that acts through the activation of four different receptors: A1R, A2AR, A2BR and A3R. The two most well characterized receptors in the brain are
the A1R and A2AR and their manipulation has been suggested for the treatment of several
neurological pathologies. Given that, the activation of A2AR is known to potentiate BDNF
synaptic actions in healthy animals, one could anticipate that the activation of these adenosine receptors could be a potential therapeutic strategy. On the other hand, most of RTT patients have epilepsy, a pathology where adenosine system might be affected. However, until recently, there was no available information about the contribution of the adenosinergic system to the pathophysiology of RTT. To overcome this gap in knowledge, our lab has developed a new line of research on this topic. The main goal of this project was to further characterize both the adenosinergic system and the BDNF signalling in RTT. This goal was achieved by using: i) a well-established animal model, Mecp2 KO mice; ii) human RTT model, neurons-derived from RTT patients induced pluripotent stem cells (IPSCs) and iii) post-mortem human brain samples from a RTT patient.
Even though we found some concordant tendencies between the human and the mouse models, given the high variability observed in the human material, no clear conclusions can be drawn. This is certainly aggravated by the small sample size that, in the future, could
x be solved by increasing not only the number of patient-derived hIPSCs lines but also by increasing the amount of independent rounds of differentiation. The availability of more post-mortem samples would also be an important asset.
Overall, the here presented results clearly show a dysfunction in BDNF signalling and in the adenosinergic system, suggesting that both systems are involved in the pathophysiology logy of the disorder. These evidences open new pharmacological avenues for the treatment of RTT.
1
1. Introduction
1.1 Rett Syndrome
Rett Syndrome (RTT, OMIM 312750) is a progressive neurodevelopmental disorder that affects brain development during early childhood (Chahrour and Zoghbi, 2007; Banerjee et al., 2012). This rare syndrome, with an incidence of approximately 1 in 10,000 female live births (Chahrour and Zoghbi, 2007) was first described in 1966 by Dr. Andreas Rett (Rett, 1966) but only 17 years later became recognised by the medical community when Dr. Bengt Hagberg and colleagues described 35 RTT cases (Hagberg et al., 1983). Children have an apparently normal development until 6-18 months of age when a regression phase starts with loss of previously acquired skills (Chahrour and Zoghbi, 2007; Bedogni et al., 2014). Patients develop typical symptoms grouped in 4 clinical stages: i) developmental stagnation; ii) rapid regression; iii) stationary stage and iv) motor deterioration (Figure 1.1) (Abreu, 2014; Chahrour and Zoghbi, 2007).
The most prominent features in girls with RTT are the development of stereotypic hand movements with a decline of purposed hand movements, stagnation of neuromotor development, severe cognitive impairment, seizures (epilepsy), autistic features and autonomic dysfunctions (reviewed by Chahrour and Zoghbi, 2007). RTT patients can live until sixty/seventy years of age in spite of their severely affected physical condition (Chahrour and Zoghbi, 2007).
In 1999 Amir and colleagues described mutations in the MECP2 gene (methyl-CpG binding protein 2) as the cause of RTT (Amir et al., 1999). This gene codifies the MeCP2 protein and is located in X chromosome, explaining the high prevalence of this disorder in the female gender and the low rate of survival in male patients (Liyanage and Rastegar, 2014; Chahrour and Zoghbi, 2007).
2
1.1.1 Genetic Basis
RTT represents the most common genetic cause of severe intellectual disability in females (Percy and Lane, 2005). About 99% of RTT cases are sporadic, hindering the initial quest of the associated locus (Chahrour and Zoghbi, 2007). However, studies using rare familial cases allowed the identification of the locus Xq28 followed by the identification of mutations in MECP2 (Amir et al., 1999). Mutations in MECP2 gene appear in 90% of RTT classical cases (Liyanage and Rastegar, 2014), missense and nonsense mutations represent 70% of all mutations, small C-terminal deletions represent 10% and complex rearrangements 6% of the cases (reviewed in Chahrour and Zoghbi, 2007). The majority of the mutations arise de novo in the paternal germline and involve a C to T transition at CpG dinucleotides (Girard et al., 2001; Trappe et al., 2001; Wan et al., 1999). A relationship
Figure 1.1 - Onset and clinical manifestations of RTT.RTT patients have normal development during the first months of life. After this period, starts a phase of developmental stagnation followed by a rapid deterioration with loss of acquired speech, loss of purposeful hand use and midline stereotypies. Autistic features also emerge and, in advanced stages of the disease, the clinical condition deteriorates with loss of motor skills and profound cognitive impairment. In addition, patients suffer from anxiety, seizures, and autonomic abnormalities (Chahrour and Zoghbi, 2007).
3 between RTT phenotype and the type of MECP2 mutation has already been shown, where truncating mutations and mutations affecting the nuclear localization signals (NLS) of MeCP2 protein are associated with a severe RTT phenotype (Amir and Zoghbi, 2000; Smeets et al., 2005).
Atypical cases of RTT (around 10% of RTT patients), are characterized by mutations in other genes, namely CDKL5 and FOXG1 genes and display distinct phenotypes (Neul et al., 2011; Evans et al., 2005; Philippe et al., 2010).
MeCP2: gene, protein and its functions
MECP2 gene
MeCP2 was first identified in 1992 by Bird and colleagues (Lewis et al., 1992) and it is the most studied protein of the methyl-CpG binding protein family due to its primordial functions and link to this specific disorder (reviewed in Liyanage and Rastegar, 2014 and Bedogni et al., 2014).
The MECP2 gene spans approximately 76 Kb, between the Interleukin-1 receptor associated kinase gene (IRAK1) and the Red Opsin gene (RCP) (Liyanage and Rastegar, 2014). The structure of MECP2 gene, both in human and mouse, is comprised of 4 exons (exon 1-4) and 3 introns (intron 1-3) and two different isoforms are generated by alternative splicing: MeCP2_e1 and MeCP2_e2 differing only in N-terminal sequence (Figure 1.2) (Cheng and Qiu, 2014; Liyanage and Rastegar, 2014).
These two isoforms have redundant and also non-redundant functions and their expression pattern is distinct. MeCP2_e1 is 10 times more abundant in the postnatal human brain than MeCP2_e2 and expression studies in the adult mouse brain showed that MeCP2_e2 expression is exclusive to the thalamus and cortex layers (reviewed in Liyanage and Rastegar 2014). Loss of MeCP2_e2 isoform does not cause typical symptoms of RTT, suggesting that this isoform alone is not responsible for RTT pathology (Itoh et al., 2012).
4
MeCP2 protein
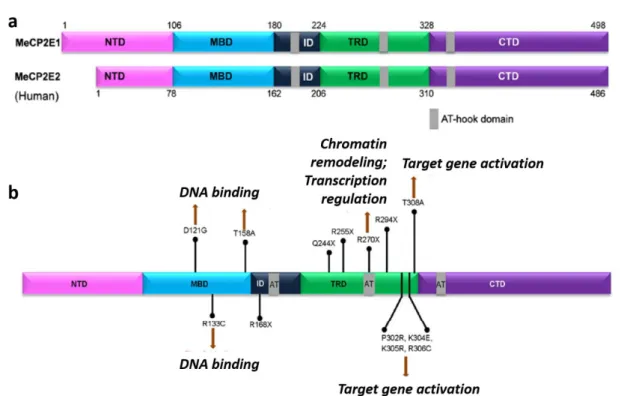
The protein structure of MeCP2 is constituted by 5 domains: N-terminal domain (NTD), methyl binding domain (MBD), inter domain (ID), transcription repression domain (TRD) and C-terminal Domain (CTD) (Figure 1.3a) (Liyanage and Rastegar, 2014).
Most of the missense mutations in MeCP2-related disorders affect the MBD, required for methylation-dependent chromatin binding (Galvão and Thomas, 2005; Kudo et al., 2003), explaining the inability of MeCP2 to locate and cluster into heterochromatin and its retention in the cytoplasm (Stuss et al., 2013). Mutations in the TRD and CTD domain are also present in MeCP2-related disorders (Figure 1.3b) (Liyanage and Rastegar, 2014; Bedogni et al., 2014).
MeCP2 is mainly detected in neurons but it is also present in astrocytes, oligodendrocytes and microglia (reviewed in Liyanage and Rastegar, 2014; Zachariah et al., 2012). Its expression is high during embryonic development and low during neuronal maturation and synaptogenesis. MECP2 expression starts to increase over to the first 3 postnatal weeks, reaching a plateau phase until later adult life, where a new increase of MeCP2 expression takes place (Shahbazian et al., 2002).
Figure 1.2 - Structure of MECP2 gene. a – MECP2 is found in the X chromosome (Xq28), between RCP and IRAK1 genes. b – MECP2 is composed of four exons (exons 1-4), three introns (1-3) and three
polyadenylation sites at the 3’UTR. c – Alternative splicing generates two isoforms: MeCP2_e1, encoded by exons 1, 3 and 4 and MeCP2_e2 by exons 2, 3 and 4. Translation start site (arrows); coding region (red bars); non coding-sequence (green bars) (adapted from Liyanage and Rastegar, 2014).
5
MeCP2 functions
MeCP2 is a multifunctional protein involved in transcriptional regulation and modulation of chromatin structure. The two prominent MeCP2 functional domains, MBD and TRD, enable multiple functions through direct DNA binding, interaction with other proteins or recruitment of essential factors (see Liyanage and Rastegar, 2014; Banerjee et al., 2012; Bedogni et al., 2014). Post-translational modifications have been found to regulate protein stability and modulate protein activity (reviewed in Liyanage and Rastegar, 2014; Cheng and Qiu, 2014).
The precise role of MeCP2 in transcriptional repression or activation remains controversial. MeCP2 was first identified as a transcription repressor since MeCP2 was located at methylated promoters and recruited co-repressors like SIN3A and histone deacetylases (HDACs) 1 and 2, promoting a global compaction of chromatin (Nikitina et al., 2007; Klose and Bird, 2004). On the other hand, MeCP2-mediated transcriptional gene activation occurs in association with activator complexes containing cAMP response
Figure 1.3 - MeCP2 protein structure, mutations and associated impairments in RTT. a – MeCP2_e1 and
MecP2_e2 protein has 498 and 486 amino acids, respectively. Both isoforms have the some functional domains: methyl-CpG-binding domain (MBD), transcriptional regression domain (TRD), C-terminal domain (CTD) and N-terminal domain (NTD). AT-hook, in grey, allows binding to AT rich DNA. b – Frequently reported mutations in MECP2 and affected domains (adapted from Liyanage and Rastegar, 2014).
6 element-binding protein (CREB) (Chahrour et al., 2008). The regulation of brain-derived neurotrophic factor (Bdnf) gene by MeCP2, is an example of the paradoxical role of MeCP2 upon transcriptional regulation. Binding of MeCP2 to the Bdnf promoter represses its expression but in Mecp2-deficient mice, BDNF expression levels are decreased (see section 1.4.1) (reviewed in Li and Pozzo-Miller, 2014).
Furthermore, MeCP2 plays also an important role in the regulation of RNA splicing, microRNA regulation, and in the regulation of protein synthesis through AKT/mTOR pathway, relevant to neuronal differentiation and maturation (Figure 1.4) (see Cheng and Qiu, 2014; Liyanage and Rastegar, 2014; Bedogni et al., 2014).
Given the wide range of cellular activities of the MeCP2, alterations in its functions result in impaired brain development and function (Banerjee et al., 2012; Liyanage and Rastegar, 2014). However, the exact mechanisms caused by MeCP2 dysfunction that result in RTT related pathophysiological features remain undisclosed. To this end, the use of MECP2-deficient models is of the outmost importance.
Figure 1.4 MeCP2 and its functions. Multiple MeCP2 functions are schematized. Involvement of MeCP2 in
transcriptional repression and activation is associated with specific factors, such as Sin3A and HDAC in repression and CREB1 in activation. MeCP2 has also an active role on protein synthesis via AKT/mTOR pathway, in chromatin condensation and in alternative splicing (Bedogni et al., 2014).
7
1.2
Rett Syndrome disease modelling
Several models are currently available to study RTT. The majority of them have been developed in mice where the insertion of specific mutations or deletion of large portions of the gene result in MECP2 dysfunction (Liyanage and Rastegar, 2014). The recent breakthrough in reprogramming of patient-derived fibroblasts into human induced pluripotent stem cells (hIPSCs) together with the ability to promote differentiation into specific neuronal populations, allows the generation of human disease relevant cell lines as disease models. In this chapter, the advantages and disadvantages of each model are discussed.
1.2.1 Mouse models
Several mouse models have been generated in order to understand the cellular mechanisms and behavioural traits underlying RTT. The same models have also been used to develop and test possible therapeutic strategies (Katz et al., 2012; Liyanage and Rastegar, 2014; Banerjee et al., 2012). A good model is characterized by its ability to recapitulate the disease phenotype and its utility in translational studies. Therefore, it is important that a considerable overlap between the mouse and human phenotypical traits exist as well as reproducibility and robustness between laboratories, as discussed in (Katz et al., 2012).
The established models include mice carrying global alleles and conditional null alleles. In the first group, we can distinguish the null mutations (Guy et al., 2001; Chen et al., 2001), that are similar to the large deletions found in 10% of RTT patients; truncations and single-nucleotide mutations, that are more approximate to the mutations found in the majority of RTT patients and point mutations (reviewed in Katz et al., 2012). The second group is characterized by mice models where: Mecp2 deletions or mutations are cell type specific (Calfa et al., 2011b).
The majority of RTT mice models used are the null despite of only 10% of RTT patients present large deletions.
Due to X chromosome inactivation (XCI), girls affected with RTT present mosaicism for the expression of the mutant allele resulting in different degrees of severity. To avoid this
8 confounding effect experiments are typically done in male mice which do not mimic this genetic mosaicism but simplify data interpretation (Stearns et al., 2007; Robinson et al., 2012). Mecp2-null male mice exhibit consistent early abnormalities in motor behaviour, within 6 weeks of age, and more severe than in heterozygous females (Pratte et al., 2011; Stearns et al., 2007). Other characteristics in common with the human disease are: breathing and cardiac abnormalities (Mccauley et al., 2011; Pratte et al., 2011); cognitive impairments; anxiety and alterations in social behaviour (Stearns et al., 2007). These animals also have reduced brain volume (Stearns et al., 2007) and prototypical features of human RTT neuropathology such as smaller neurons, higher neuronal packing density, reduced dendritic arbour and abnormal dendritic spines (reviewed in Katz et al., 2012).
1.2.2 Induced Pluripotent Stem Cells (IPSCs)
Due to the constraints of isolating neurons from living subjects, initial studies using the human brain were performed on post-mortem tissues that are not always well preserved, accessible and often represent an end-stage of the disease. On the other hand, animal models, fail to recapitulate in full, the complexity of the human pathology (Jang et al., 2014; Amenduni et al., 2011; Chailangkarn et al., 2012).
Pluripotent human embryonic stem cells were for the first time successfully generated from early stages of the human embryo in 1998 (Thomson et al., 1998). To develop cellular models of human disease it is essential to generate cell lines genetically predisposed to disease. In 2006, it was demonstrated that the expression of 4 transcription factors (OCT4, SOX2, KLF4 and c-MYC) was sufficient to reprogram mice somatic cells, like fibroblasts, to a pluripotent state – Induced Pluripotency (Takahashi and Yamanaka, 2006). A similar protocol was also successfully applied to generate hIPSCs (Takahashi et al., 2007). Most IPSCs lines are derived by retroviral transduction of dermal fibroblasts due to its availability and high reprogramming efficiency (Saporta et al., 2011; Jang et al., 2014; Dajani et al., 2013; Cheung et al., 2012). IPSCs are pluripotent and can differentiate into any cell type by manipulation of the culture environment with growth factors, small molecules and extracellular matrix proteins guiding their differentiation into the cell-type of interest (Dajani et al., 2013; Saporta et al., 2011)
9 Recently, neurons-derived from IPSCs emerged as a promising alternative providing a new paradigm for the generation and study of human disease-specific neurons with a predominant role in certain neurological/neurodevelopment/neuropsychiatric pathologies (Saporta et al., 2011). Once its validity as a model has been demonstrated, it could even be used in translational studies and in the screening of potential therapeutic strategies (Figure 1.5) (Saporta et al., 2011; Freitas et al., 2012; Jang et al., 2014; Chailangkarn et al., 2012).
In the specific case of RTT, this in vitro human neurodevelopmental model, offers an excellent opportunity to recapitulate the early stages of development and mimic specific biochemical and cellular features of the disease difficult to reproduce in other models (Freitas et al., 2012).
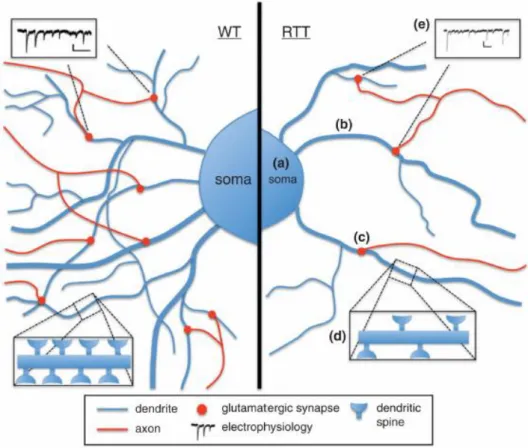
The first RTT-IPSCs were generated in 2009 (Hotta et al., 2009) and multiple studies have followed in order to study RTT neuronal and glial phenotype from a neurodevelopmental point of view. In these studies, neurons-derived from RTT-hIPSCs recapitulate some of the phenotypes already described in the mouse models and observed in patients (reviewed in Dajani et al., 2013). These include, reduced soma/nuclear size, lower expression of neuronal markers, reduced dendrite spine density, reduced glutamatergic synapse number, altered neuronal morphology, reduction in the transient rise of intracellular calcium and decrease in the frequency/amplitude of spontaneous excitatory and inhibitory postsynaptic currents (Figure 1.6) (Marchetto et al., 2010). The high overlap between the characteristics observed in these studies and the human disease
Figure 1.5 - Schematic representation of hIPSCs production and possible applications. To generate IPSCs, reprogramming of somatic patient-derived cells is achieved using retroviral transduction of four pluripotency factors (OCT4, SOX2, c-MYC and KLF4). IPSCs can be differentiated into the desired cell type that allows human disease modelling, to investigate patient-specific cell therapy and drug screening (Yamanaka and Blau, 2010).
10 provides strong support to the utility of neurons-derived from IPSCs as a model to study RTT.
Nevertheless, it is important to take into account that this model still requires improvement given the newness of this technique. One of the challenges of using hIPSCs is to produce differentiated and functional specific cell types. However, the protocols used generally result in a heterogeneous cell population, neurons and glia. This could be an advantage given the improved neuronal survival when cultured in mixed populations but it can create difficulties in data analysis. Therefore, biochemical and gene expression analysis cannot be performed without a careful normalization for cell type and their proportions (Saporta et al., 2011). Secondly, epigenetic memory of the original cell (fibroblast) might not be fully erased, affecting the differentiation potential. Variability between cell lines and clones from the same individual in proliferation and differentiation potential have been observed, which affect data interpretation (Chailangkarn et al., 2012).
Figure 1.6 Phenotypical characteristics of neurons-derived from RTT-hIPSCs. As observed in other RTT
models, neurons derived from RTT-hIPSCs exhibit (a) smaller soma size; (b) reduced dendritic branching;
(c) less glutamatergic synapses; (d) fewer dendritic spines and (e) decreased frequency of spontaneous
11 Nevertheless, this can be partially solved by using different clones from the same individual or improving of differentiation protocols (Dajani et al., 2013).
Another specific challenge in X-linked diseases is the random X chromosome inactivation process that is not epigenetically stable demanding screening of cellular lines to evaluate the proportion of cells expressing the mutant allele (Cheung et al., 2012; Kim et al., 2011). Nevertheless, this outcome can also be considered as an advantage since isogenic clones expressing either the wild type allele (WT) or the mutant allele can be studied (Ananiev et al., 2011). Finally, generation of individual IPSCs is an expensive and time-consuming process which can be exceeded with collaborations between laboratories and institutes (Figure 1.7) (Chailangkarn et al., 2012).
The continuous improvement of this model could have enormous impact in health by contributing to personalized medicine, making predictions about the efficiency of certain drugs in individuals, to regenerative medicine and cell-replacement therapies overcoming rejection issues (Chailangkarn et al., 2012; Jang et al., 2014).
2
Figure 1.7 - Challenges in RTT-IPSCs modelling. During reprogramming, de novo genetic and epigenetic
variation appears as a possible problem as well as parental epigenetic memory. In female IPSCs X-chromosome instability has also to be considered and followed throughout the process. During differentiation, clonal variation and optimal differentiation protocol should be taken into account when interpreting experiment results (adapted from Dajani et al., 2013).
12
1.3
Adenosine
Adenosine is an endogenous purine nucleoside, constituted by an adenine attached to a ribose (Figure 1.8) and is ubiquitously distributed throughout the body (Sachdeva and Gupta, 2013; Chen et al., 2007). This purine has an essential and vital role in several physiologic functions, acting in the synthesis of nucleic acids and ATP, blood supply, glucose homeostasis and can produce pharmacological effects in peripheral and central nervous system (PNS) (reviewed in Sachdeva and Gupta, 2013). Adenosine has the particularity of acting both as a neuromodulator and as a homeostatic modulator in a wide variety of systems. As a neuromodulator, adenosine, controls the information flow through neuronal circuits and as a homeostatic modulator sends paracrine signals that can tone metabolic activity in specific cells of a tissue, allowing a trans-cellular coordinated response to changes in the tissue workload (reviewed in Gomes et al., 2011).
Extracellular adenosine acts through multiple G-protein coupled receptors and it is constitutively present in extracellular space at low concentrations (nanomolar range) that markedly rise in stressful conditions, like ischemia, hypoxia, excitotoxicity and inflammation, having a cytoprotective role (Boison, 2013; Jacobson and Gao, 2012; Chen et al., 2007).
Figure 1.8 -Adenosine structure. Adenosine is composed by an adenine (filled line) attached to a ribose
13
1.3.1 Adenosine metabolism
Adenosine can be formed intra and extracellularly by the action of the enzyme 5’-nucleotidase on adenosine monophosphate (AMP) (Phillips and Newsholme, 1979) or intracellularly by the hydrolysis of S-adenosylhomocysteine (SAH) (Nagata et al., 1984) catalysed by SAH hydrolase.
The intracellular levels of adenosine are controlled by adenosine kinase (ADK), which phosphorylates adenosine to produce AMP, and by adenosine deaminase (ADA) resulting in the formation of inosine. Small changes in ADK activity rapidly cause dramatic changes in intracellular adenosine concentration (Bontemps et al., 1983; Bontemps et al., 1993). Several studies have shown that ADK is the primordial enzyme for adenosine clearance under baseline conditions, once it has a low-capacity and a low-Km. ADA with an
high-capacity and high-Km acts in adenosine clearance when adenosine levels are excessive
(Boison et al., 2010).
Adenosine does not accumulate in synaptic vesicles like the classical neurotransmitters, but it is instead released from the cytoplasm into the extracellular space through a nucleoside transporter (see e.g. Ribeiro et al., 2002).
In summary, adenosine homeostasis is determined by three major pathways working in a concerted manner: 1) adenosine formation, 2) adenosine removal and 3) adenosine uptake by transmembrane transporters (reviewed in Boison, 2013 and Boison et al., 2010). The activity of the transporters depends on the intracellular metabolic clearance rate to maintain adenosine uptake. This means that under steady-state conditions of adenosine production, extracellular adenosine concentration is controlled by intracellular adenosine clearance rate (Greene, 2011). In parallel, since ADK is the main enzyme involved in adenosine clearance and the enzymatic reaction is ATP dependent, adenosine homeostasis is largely influenced by the energetic status of the cell (Boison, 2013). During metabolic stress, the huge increase in adenosine concentration is achieved by the release and degradation of adenine nucleotides, such as adenosine triphosphate (ATP), adenosine diphosphate (ADP) and AMP by a cascade of ecto-5’nucleotidases, namely CD39 and CD73 (Figure 1.9) (Sachdeva and Gupta, 2013).
14 Interestingly, enzymes involved in adenosine degradation have been considered promising pharmacological targets for disorders where adenosine levels are deregulated, such as epilepsy (Boison, 2012; Boison, 2013). In addition, alterations in the mechanisms that control adenosine levels have also been reported, in particular the overexpression of ADK has been detected in epileptogenic brain areas (Gouder et al., 2004), highlighting the use of this particular enzyme as a possible pharmacological target.
1.3.2 Adenosine receptors
To the present date, four different receptors have been cloned A1, A2A, A2B and A3 (R).
A1R and A3R are mainly coupled to Gi proteins, while the A2AR and A2BR act mainly through
activation of Gs proteins (Ralevic and Burnstock, 1998) though coupling to Gq can also
occur.
Figure 1.9 - Adenosine formation and catabolism. Schematic representation of the multiple processes
involved in the formation, transport and removal of adenosine. Adenosine can be synthetized intracellularly by AMP dephosphorylation via nucleotidases or by cleavage of S-adenosylhomocysteine via SAH-hydrolase. Extracellularly, adenosine is formed by ectonucleotidades that dephosphorylate AMP, ADP and ATP. Adenosine clearance is performed by the adenosine deaminase, intra- and extracellularly and by adenosine kinase, only intracellularly. All these processes produce inosine. Adenosine transport between cytosol and extracellular space occurs via membrane nucleotide transporters. ADP - adenosine diphosphate; AMP - adenosine monophosphate; ATP - Adenosine triphosphate; SAH - S- adenosylhomocysteine (adapted from Sachdeva and Gupta, 2013).
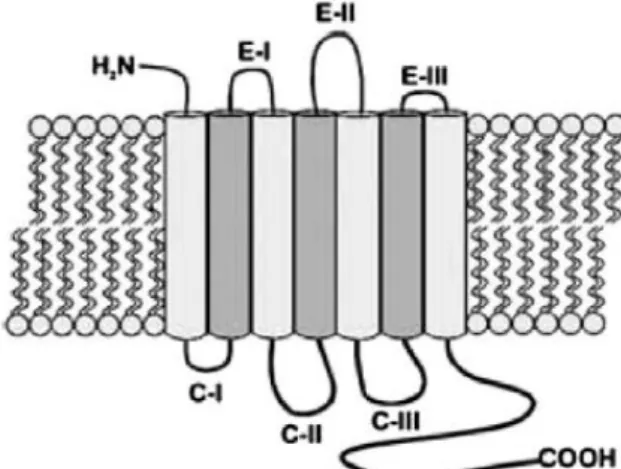
15 Adenosine receptors (AR) have an extracellular domain comprised of the N-terminal and 3 extracellular loops and by an intracellular domain that comprises the C-terminal and 3 intracellular loops (Figure 1.10) (Sachdeva and Gupta, 2013). In humans, the similarity between receptors is greater between A1R and A3R and between A2AR and A2BR (Jacobson
and Gao, 2012).
A1R and A2AR are considered to be the high affinity receptors for adenosine, and in
basal conditions are probably tonically activated (Dunwiddie and Masino, 2001). Given the higher density of A1R and A2AR in the brain comparing to the other adenosine receptors,
these receptors probably have higher impact in cerebral function (reviewed by Gomes et al., 2011).
Adenosine A1 receptors
A1R are the most abundant adenosine receptors in the central nervous system (CNS),
with higher expression density in the neocortex, cerebellum, hippocampus and dorsal horn of spinal cord. They are pre-, post- and nonsynaptically located (Fredholm et al., 2005). When located postsynaptically they can influence excitatory response controlling both N-type Ca2+ channels and NMDA receptors (Mendonça et al., 1995). If located
nonsynaptically they control the K+ current resulting in neuronal hyperpolarization
(Greene and Haas, 1991). Besides being expressed in neurons they can also be found in astrocytes and microglia (reviewed by Gomes et al., 2011). Moreover, these receptors can
Figure 1.10 - Adenosine receptor structure. Adenosine receptors are constituted by an N-terminal
extracellular domain, 3 extracellular loops (E-I, E-II and E-III), a C-terminal intracellular domain and 3 intracellular loops (C-I, C-II and C-III) (Sachdeva and Gupta, 2013).
16 also be found in adipose tissue, heart muscle and inflammatory cells like neutrophils (reviewed in Sachdeva and Gupta, 2013).
The activation of A1R promotes the inhibition of adenylyl cyclase due to the activation
of toxin-sensitive Gi proteins. It can also promote the inhibition of G-protein
coupled-activation of voltage dependent Ca2+ channels and induce PLC activation (Figure 1.11)
(Rogel et al., 2005).
A1R activation selectively depresses excitatory transmission and also can decrease
miniature events in excitatory synapses (Scanziani et al., 1992).
Adenosine A2A receptors
A2AR are mostly coupled to Gs, which consequently increase intracellular cAMP. In the
striatum they are also coupled to Golf (Corvol et al., 2001) and, in the hippocampus, there
is evidence that these receptors can be coupled to Gi/Go (Figure 1.11) (Cunha et al., 1999).
Besides being postsynaptically highly expressed in the striatopallidal GABAergic neurons and in the olfactory bulb (see e.g. Fredholm et al., 2001), the A2AR are also expressed in
the hippocampus and cortex (see e.g. Ribeiro et al., 2002). These adenosine receptors are mostly found in synapses (pre- and postsynaptically) and also in glial cells (reviewed in Gomes et al., 2011).
The A2AR do not have a marked effect on basal synaptic transmission but they play an
important role in synaptic plasticity (reviewed in Gomes et al., 2011), specially in aged animals (Costenla et al., 1999). The ability of A2AR to enhance the activity-dependent
efficiency of excitatory synapses has been argued to result from: 1) an enhanced release of neurotransmitters (Lopes et al., 2002; Rebola et al., 2003) 2) a localized desensitization of A1R-mediated inhibition (Lopes et al., 1999); 3) a facilitation of brain-derived
neurotrophic factor-induced signalling (Fontinha et al., 2008; Diógenes et al., 2011); and 4) from an enhanced responsiveness of N-methyl-d-aspartate (NMDA) receptors (Rebola et al., 2008).
17
A3 A2B
A1 A
2A
Adenosine A2B and A3 receptors
A2BR, like A2AR, are positively coupled to adenylyl cyclase and PLC, through Gq proteins
(Linden et al., 1999), and are mostly expressed in gastrointestinal tract, bladder, lung and mast cells (reviewed in Sachdeva and Gupta 2013). Even though the closest structure between A2AR and A2BR and their capacity to activate adenylyl cyclase (Figure 1.11), these
two receptors have very different functions, being postulated that A2BR could act by a
different transduction system than adenylyl cyclase. The affinity of these receptors is also low, being activated predominantly when adenosine levels are increased (in µM order) (Sachdeva and Gupta, 2013).
A3R can be found in liver, lung, mast cells, eosinophils, neutrophils, testis, heart and
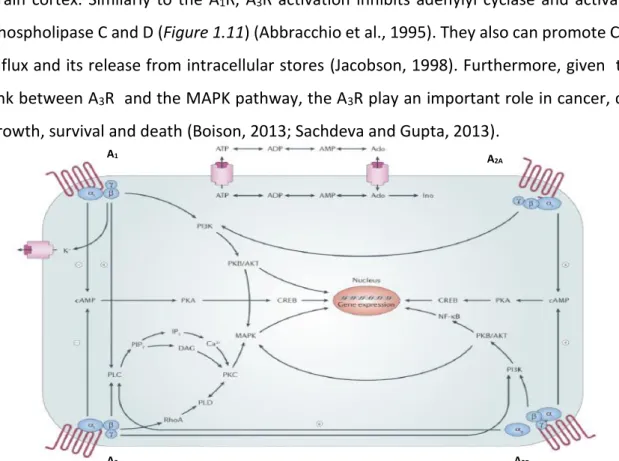
brain cortex. Similarly to the A1R, A3R activation inhibits adenylyl cyclase and activates
phospholipase C and D (Figure 1.11) (Abbracchio et al., 1995). They also can promote Ca2+
influx and its release from intracellular stores (Jacobson, 1998). Furthermore, given the link between A3R and the MAPK pathway, the A3R play an important role in cancer, cell
growth, survival and death (Boison, 2013; Sachdeva and Gupta, 2013).
Figure 1.11 Adenosine signalling pathway. Schematic representation of the pathways activated by
adenosine. Activation of A1R and A3R inhibits adenylyl cyclase activity through activation of toxin-sensitive
Gi proteins, increasing PLC activity via Gβγ subunits. A2AR and A2BR activation leads to adenylyl cyclase
increased activity by Gs protein activation. A2AR activation induces inositol phosphate formation in some
situations, probably via Gα15 and Gα16 proteins. A2BR activation induces PLC through Gq. All four adenosine
receptors can couple to MAPK. Ado - adenosine; ADP - adenosine diphosphate; AKT - protein kinase B; AMP - adenosine monophosphate; ATP - adenosine triphosphate; CREB - cAMP response element binding protein; DAG - diacylglycerol; Ino - inosine; IP3 - inositol 1,4,5-trisphosphate; MAPK - mitogen-activated protein kinases; PI3K - phosphatidylinositol 3-kinase; PIP2 - phosphatidylinositol-4,5-bisphosphate; PK - protein kinase; PLD - phospholipase D; NF-κB - nuclear factor-κB (Jacobson and Gao, 2012).
18
1.3.3 Adenosine and pathology
Dysfunction in the adenosinergic signalling has been associated with several pathologies. Therefore, adenosine and its receptors have been pointed out as promising pharmacological targets in several disorders: cardiovascular, renal, pulmonary, inflammatory, endocrine and neurologic (Figure 1.12) (reviewed in Jacobson and Gao, 2012).
Within the neurologic disorders, epilepsy, Huntington’s, Parkinson´s and Alzheimer´s diseases are the ones receiving more attention.
In epilepsy, the role of adenosine as an anti-epileptic drug has been extensively studied. Initial evidence came from studies showing that the inhibitory A1R are enriched
in excitatory synapses, where they were responsible for the inhibition of glutamate release, decreasing therefore glutamatergic responsiveness and hyperpolarising neurons. These events are highly desirable to counteract epilepsy, characterized by an exacerbated and repetitive excitation (see for review Gomes et al., 2011). In addition, levels of extracellular adenosine rise during seizures, which could be a hint that adenosine plays an important role as an endogenous anti-epileptic molecule (During and Spencer, 1992; Berman et al., 2000). Subsequently, several studies have shown that the administration of compounds that increase the extracellular levels of adenosine, such as inhibitors of adenosine transporters or ADK inhibitors (briefly explored above in chapter 1.3.1), and agonists of A1R, attenuate seizures and convulsive activity in animal models (reviewed in
Boison et al., 2013). However, it was also shown that synaptic A1R have decreased density
and efficiency in animal models of epilepsy (Glass et al., 1996; Ekonomou et al., 2000) which could complicate the manipulation of A1R receptors to modulate inhibition of this
pathology. Nowadays, the inhibition of the excitatory A2AR is appearing as a new strategy
to control chronic epilepsy and its blockage, by the use of antagonists, could be an alternative (El Yacoubi et al., 2008).
In Huntington’s disease (HD) the available data points to a possible involvement of A2AR
on the pathophysiology of this disorder given that several alterations were detected in the A2AR gene as well as in the expression levels of the A2AR protein (Varani et al., 2001; Tarditi
19 glutamatergic transmission, in neuroinflammation, on metabolism and mitochondrial function, all of them altered in HD (reviewed in Gomes et al., 2011). Thus A2AR antagonists
have been explored as a potential therapeutic strategy since they improve motor function and also act as a neuroprotective agent decreasing glutamate levels and consequently controlling glutamatergic synapses. However, this topic brings some controversy since some studies refer A2AR agonists as a preferential therapeutic target in HD, because A2AR
activation by its agonists could also facilitate BDNF functions, that are impaired in HD, through TrkB transactivation (Sebastião and Ribeiro, 2009) (explored in chapter 1.4.3) and at the same time, A2AR antagonism, initially suggested, potentiate NMDA-mediated
toxicity. (Popoli et al., 2002).
The role of adenosine in the pathology of Parkinson’s disease (PD) has also been described. Since A2AR are involved in motor control (reviewed in Chen et al., 2007), in
glutamatergic transmission control, neuroinflammation, metabolism and mitochondrial function, known to be impaired in PD, modulation of A2AR improves PD. The use of A2AR
antagonists in PD is more accepted than in HD, and it is now being evaluated in clinical trials with the propose to ameliorate motor impairments and promote neuroprotection (LeWitt et al., 2008; Hauser et al., 2003).
The capacity of adenosine to control and integrate cognition and memory, through A1R
and A2AR, provides the link between adenosine impairment and Alzheimer’s Disease (AD),
a disorder characterized by the progressive impairment in these two functional capacities (Cunha and Agostinho, 2010). It was shown that A1R and A2AR change their density and
localization pattern in AD brain and that the chronic stress found in these patients also upregulates A2AR suggesting that its manipulation could promote neuroprotection
(reviewed in Gomes et al., 2011). The capacity of A2AR to modulate learning and memory,
are vastly studied in AD, where an epidemiologic relationship between caffeine consumption and AD risk has been shown (Maia and Mendonça, 2002). This relationship suggests that the A2AR antagonism achieve by caffeine (A2AR antagonist) consumption
could decrease AD risk.
Even though the A2AR antagonism is beneficial in the above described
20 once it can potentiate BDNF functions, through TrkB facilitation (Numakawa, 2014). This is an important breakthrough since BDNF is impaired in these disorders but cannot be administrated due to pharmacokinetic issues.
Despite above mentioned pathologies share some phenotypical traits with RTT, the adenosinergic system in RTT has not yet been fully characterized.
Figure 1.12 - Adenosine receptors are targeted in several disorders. Use of adenosine receptors
antagonists, agonists or both is widely explored and already applied in the treatment of some disorders (Jacobson and Gao, 2012).
21
1.4 BDNF
BDNF was discovered in 1982 (Barde et al., 1982) and it is a member of the neurotrophin family that in mammals includes nerve growth factor (NGF), neurotrophin-3 (NT-3), and neurotrophin-4/5 (NT-4/5) (Cohen-cory et al., 2011). Axon targeting, neuron growth, synapses maturation and synaptic plasticity are some of essential functions executed by these signalling molecules, in particular by BDNF (Binder and Scharfman, 2004).
1.4.1 BDNF expression
The Bdnf gene is composed by four untranslated 5’ exons associated to different promotors and one 3’ exon (Li and Pozzo-Miller, 2014; Binder and Scharfman, 2004). Eight different transcripts can be transcribed from this locus but all of them are translated into an identical BDNF protein (Li and Pozzo-Miller, 2014). BDNF is synthetized in the endoplasmic reticulum (ER) as a precursor protein, pro-BDNF, and proper protein folding takes place in the Golgi apparatus. Pro-BDNF is then cleaved both intra- and extracellularly, near synapses to produce the mature and active BDNF form (14 kDa) (Binder and Scharfman, 2004; Lee et al., 2001). However, some studies have demonstrated that pro-BDNF is also present in the extracellular space, with a negative regulator function promoting apoptosis, inhibiting dendritic complexity and promoting long-term depression (LTD) by the activation of the p75 receptor (Barker, 2004). In the rodent brain, BDNF levels are low during prenatal development and rise drastically in the postnatal period (Kolbeck et al., 1999). Interestingly, this expression pattern coincides with MeCP2 expression pattern. Remarkably, it was also observed that BDNF expression remains unaffected during presymptomatic stage in Mecp2 knockout (KO) mice (Chang et al., 2006). In addition, Bdnf-deficient mice have a phenotype similar to that found in Mecp2 KO models (Chang et al., 2006). Besides, the positive correlation between BDNF and MeCP2 expression, it has also been shown that MeCP2 binds to Bdnf at methylated CpG sites adjacent to A/T runs (Klose et al., 2005), which could occur in association with repressor factors, such as HDACs, indicating a negative relation between these two molecules (Martinowich et al., 2003). How MeCP2 can modulate BDNF expression has not been fully
22 addressed and therefore the “Dual operation model”, that proposing a dual action of MeCP2 upon BDNF expression is widely accepted (see Li and Pozzo-Miller, 2014).
1.4.2 BDNF signalling upon TrkB receptors
Neurotrophins can bind to one or more tropomyosin-related kinase (Trk) receptors members (Binder and Scharfman, 2004). Their action is mediated by the high-affinity full-length receptors (Trk-FL), which signal through their intrinsic tyrosine kinase activity. Neurotrophin binding induces receptor dimerization, which results in kinase activation and receptor autophosphorylation on multiples tyrosine residues. This creates binding sites for intracellular target proteins via the SH2 domain (Huang and Reichardt, 2003). Truncated isoforms of Trk receptors (Trk-Tc), formed by alternative splicing, can also bind neurotrophins, but cannot activate classical pathways of full-length receptors. This happens because truncated isoforms do not have the intracellular kinase domain (Allen et al., 1994). They are also thought to act as negative effectors of full-length Trk receptors (Luikart et al., 2003) and may have their own signalling properties (see e.g. Rose et al., 2003).
Mature BDNF has high-affinity to TrkB receptors, activating signal transduction through these. There are at least three signalling transduction pathways that BDNF can trigger: 1) PLC γ pathway, associated to synaptic plasticity BDNF-mediated, which leads to protein kinase C activation; 2) PI3K pathway, related to cell survival BDNF functions, which activates serine/threonine kinase AKT and 3) MAPK pathway, linked to growth and differentiation BDNF functions, that activates several downstream effectors as shown in (Figure 1.13) (Huang and Reichardt, 2003).
Three different truncated isoforms of TrkB receptor (Tc) can be consider: TrkB-T1, the most abundant truncated isoform in the brain, TrkB-T2 and TrkB-Sch (Luberg et al., 2010). All of them can inhibit the BDNF activity by acting as dominant negative inhibitors of TrkB-FL receptors (Eide, 1996).
23
1.4.3 Interaction between adenosine and BDNF
A close relationship between adenosine receptors and neurotrophic factors, namely BDNF, has been found.
Presynaptic depolarization, that leads to an increase in adenosine extracellular levels and consequently to an enhancement of cAMP by A2AR activation trigger hippocampal
synaptic actions of BDNF (Diógenes et al., 2004). At the same time, A2AR activation can
transactivate TrkB receptors in the absence of the neurotrophin (Rajagopal et al., 2004; Lee and Chao, 2001). It was also seen that A2AR activation can mediate neuroprotection,
by increasing cell survival through Trk-dependent and PI3K/AKT pathway, in hippocampal neurons after BDNF and NGF withdrawal (Lee and Chao, 2001). Interestingly, it is also known that A2AR are required for normal BDNF expression levels in the hippocampus
(Tebano et al., 2008).
BDNF
TrkB-FL
Figure 1.13 BDNF signalling through TrkB full-length (TrkB-FL) receptors. BDNF binding to TrkB-FL receptor
promotes receptor autophosphorylation and dimerization, activating downstream signalling pathways: PI3K (promotes cell survival); MAPK pathway (promotes cell growth and differentiation); and PLCγ (activates IP3, which is related with synaptic plasticity). These pathways activate CREB, a transcription factor that up-regulates gene expression. Akt - protein kinase B CREB - cAMP response element binding protein;
DAG - diacylglycerol; Erk - extracellular signal-regulated kinases IP3 - inositol 1,4,5-trisphosphate; MAPK -
mitogen-activated protein kinases; PI3K - phosphatidylinositol 3-kinase; PLC - phospholipase C (adapted from Autry and Monteggia, 2012).
24 During high neuronal activity, such as long-term potentiation (LTP), higher release of adenosine or its precursor, ATP, is observed creating the ideal conditions for the interplay between A2AR and TrkB-FL receptors (Sebastião and Ribeiro, 2009). Indeed, when A2AR
activity is blocked or extracellular adenosine is depleted, the facilitatory action of BDNF upon LTP is completely lost (Fontinha et al., 2009; Fontinha et al., 2008; Jerónimo-Santos et al., 2014).
Decreased BDNF levels might be involved in neurodegenerative disorders (Connor and Dragunow, 1998), diabetic neuropathies (Nitta et al., 2002) and RTT (reviwed in Li and Pozzo-Miller, 2014) making the use of BDNF very promising for their treatment. However, until now the pharmacological administration of BDNF has not been easy mainly due to pharmacokinetic problems. Therefore, the discovery that the activation of A2AR
potentiates BDNF actions opened a new avenue for potential therapeutic strategies for these disorders, in particular for RTT.