Repositório ISCTE-IUL
Deposited in Repositório ISCTE-IUL: 2019-02-22
Deposited version: Post-print
Peer-review status of attached file: Peer-reviewed
Citation for published item:
Pinto, N., Dias, P. & Paiva, I. (2018). Earnings management and debt in private companies: The effect of economic adjustment programmes. In 41st EAA Annual Congress. Milão
Further information on publisher's website: http://eaa2018.eaacongress.org
Publisher's copyright statement:
This is the peer reviewed version of the following article: Pinto, N., Dias, P. & Paiva, I. (2018). Earnings management and debt in private companies: The effect of economic adjustment programmes. In 41st EAA Annual Congress. Milão. This article may be used for non-commercial purposes in accordance with the Publisher's Terms and Conditions for self-archiving.
Use policy
Creative Commons CC BY 4.0
The full-text may be used and/or reproduced, and given to third parties in any format or medium, without prior permission or charge, for personal research or study, educational, or not-for-profit purposes provided that:
• a full bibliographic reference is made to the original source • a link is made to the metadata record in the Repository • the full-text is not changed in any way
The full-text must not be sold in any format or medium without the formal permission of the copyright holders. Serviços de Informação e Documentação, Instituto Universitário de Lisboa (ISCTE-IUL)
Earnings management and debt in private companies: The effect of economic adjustment programmes
Nelson Pinto
Instituto Universitário de Lisboa (ISCTE-IUL)
Paulo Dias
Instituto Universitário de Lisboa (ISCTE-IUL)
Inna Paiva
Instituto Universitário de Lisboa (ISCTE-IUL)
Abstract
Our study analyses the relationship between the level of earnings management and the debt of unlisted companies in two countries liable to economic adjustment programmes – Portugal and Ireland – between 2008 and 2016. We also analyse whether there are differences between both countries in what results are concerned. In a sample of 970 unlisted companies, and according the discretionary accruals, we find evidence of a positive relationship between the level of debt and the level of earnings management, thus concluding that the level of this relationship is different in each country. We also demonstrate that during the period of time in which the financial support occurred, there was mitigation in the relationship between the level of earnings management and indebtedness.
1. Introduction
The quality of financial information publically issued by companies is relevant to world economy, because external users make decisions relying on and depending on that accuracy. An important part of studies on the quality of financial information has defended that the higher level of earnings management is associated to a greater financial leverage (Beatty & Weber, 2003; Christie & Zimmerman, 1994; Dechow & Dichev, 2002; DeFond & Jiambalvo, 1994; Dhaliwal, 1980; Easterwood, 1997; Gu et al., 2005; Watts & Zimmerman, 1986). Other studies have been defending quite the opposite (Beneish, 1999b; Bowen et al., 2008; P. M. Dechow et al., 2011; Jelinek, 2007; Nardi & Nakao, 2009).
Though the quality of financial information and debt contraction has been studied in listed companies, less attention has been given to small and medium-sizes enterprises from other European countries. This way, the present study intends to approach the issue in other countries (that is to say to Portugal and Ireland) where, such as the majority of EU countries, the corporate fabric is majorly built by smaller companies. There is also the fact that the world economy has faced a deep economic and financial crisis. The private companies suffered significant impact which struck both their performance and their capital structure, forcing adjustments in the latter, imposed by the rise of financing conditions and lack of it. The goal of this study is to analyse the relationship between the level of earnings management and the debt of unlisted companies in Portugal and Ireland, two countries liable to economic adjustment programmes between 2008 and 2016. The programmes of macroeconomic adjustment constitute processes which seek not only the change of politics but also of behaviours which should be adopted by the countries, acting over variables such as consumption, investment and imports, to increase competition after periods of great shock (Alcidi et al., 2016). Thus, from November 2010, Ireland would be the first country to seek the adjustment programme, leaving it successfully in December 2013. Portugal would follow a similar programme in the first semester of 2011, marking its exit, also successfully, in May
In a sample of 970 unlisted companies from both countries, and according to the method of accruals, whose discretionary component was obtained by four models originated in Jones (1991), we found evidence that there is a positive relationship between the level of debt and the level of earnings management, also concluding that this relationship was different in both countries. We also demonstrate that in the period when the financial help programmes occurred, there was a decrease on the relationship between the level of earnings management and indebtedness.
Prior literature has produced divergent conclusions as far as the relationship between the level of earnings management and indebtedness is concerned. The present investigation contributes to previously published literature so as to understand if more recent data clearly distinguish one of those options, never neglecting that it is totally impossible to exclude the impact of many of the context variables that have suffered changes in the meantime (between this period of time), namely the central banks monetary policy decisions, accounting standards which stop the struggle of the strength of the economy, the experience accumulated by the financial markets / financing entities and the consequent evolution of financing contracts. This work also contributes to financial institutions, because it gives some more data on the behaviour of companies in what earnings management action is concerned, information they might add to their hazard analysis and to regulatory bodies which seek a more robust and rigorous frame of regulation.
This study is structured as follows: after the introduction, the second chapter presents the literature review and the development of the hypothesis. The third chapter presents the research design and the fourth chapter, the obtained results. This study ends with the presentation of the conclusions.
2. Literature review and development of hypothesis
2.1. Earnings management and the importance of financial information
The issue of information asymmetry related to the interaction of companies with their external partners, namely with investors, has recurrently been discussed. Previous studies let us understand that this asymmetry will tend to grow once the quality of financial information
decreases (Easley & O’Hara, 2014). The financial and accounting information thus leads a
crucial role in decisions of capital allocation (Bhattacharya et al., 2013). Schipper and Vincent (2003) add that that same allocation will be inefficient if it is done based on information of low level of quality.
The interest shared by auditors, partners, investors and the academic community, among others, illustrates well the relevance of this topic. The research based on it has also been fertile, with a long list of contributions, of which we highlight the overview done by Schipper and Vincent (2003) and Dechow et al. (1996).
There has also been a similar effort carried by the regulatory bodies, through the creation of legal frameworks which promote a strengthening on the quality of the accounting procedure and of the financial report. Both the International Accounting Standards Board (IASB) and the Financial Accountig Standards Board, internationally speaking (FASB)1, and the
Accounting Standardisation Commission (CNC)2 and the Irish Auditing & Accounting Supervisory Authority (IAASA), in the specific case of the countries focussed on this study, which demonstrate well the pursuit of this goal.
Therefore, there is not an explicit awareness of the quality of the accounting data. This is quite clear in the different interpretations focussed on research, so that a possible summary of the concept would become a challenge. We can start with Penman and Zhang (2002) in their assurance that the quality will exist once the reported information has a strong ability to stimulate future data. In the same vein, Easley and O’Hara (2004) underline the fact that the bigger the accuracy on the prediction of future cash-flows, the greater the quality of information.
However, the quality of financial report is negatively affected by practice of distortion of results (Healy & Wahlen, 1999; Leuz et al., 2003) which invoke the flexibility of the accounting standards and professional judgement, as far as political and estimation techniques are concerned, which allow managers to change results to show external bodies a certain performance (Gorgan et al., 2012). Nevertheless, there is also the downside, when managers choose methods and estimates/forecasts to reflect, in a more precise way, the companies’ economic performance (Healy & Wahlen, 1999).
To Mendes and Rodrigues (2007), it is about not denying a certain level of discretion in an accounting period, which may be important for the companies to correct specific sector and/or operational details, allowing them to give more realism and trustworthiness to the information available.
2.2. Earnings management at the background of the crisis
In a contextual insight, bearing in mind that the analysis period in the present study includes years of strong economic distress, it is important to analyse the evolution of earnings management in this scenario.
The strengthening of laws as far as accounting and financial procedures are concerned, along with risk analysis empowerment by investors/financiers and research contributions have also had a crucial role in the decrease of the levels of earnings management (Gorgan et al., 2012). Another pertinent issue is about the use of periods of crisis to report poorer performances, allowing the presentation of surprisingly positive results in the following years. Big bath is a technique which is led by discretionary accruals; its goal is to presume that possible poor results are connected to poor economic moments. In Kousenidis et al. (2013), the crisis may build an opportunity for the spread of acts of manipulation of results.
The agency theory refers another path of contradictory interests which helps understand the adjustments in the capital structures and indebtedness as lead strengths for the act of earnings management: the conflict between stock brokers and investors/financiers.
All companies must deal with the urging decision to find out how to finance the investments/actives in a continuous way, because it is not at all indifferent to choose for a specific financing source instead of another. Each of them holds specific features which will diversely affect the multiple aspects of entrepreneurial reality, namely the government structures and control, the economic and financial performance and the strategic orientation. In the decision-making about capital structure, it is important to define what proportions of equity and debt capital are preferable to a certain organisation. The attempt to explain the combination of several ways of financing to deal with real investments is, according to Myers (2001), the study of capital structure.
On the one hand, companies seek a great capital structure which allows them to maximise their value. On the other hand, some studies demonstrate that the value of the company does not depend on the combination of several financing sources. Thus, a great capital structure should apparently not exist. Besides the several opinions, the determination of the level of financial leverage constitutes a central element in all the research. Although the latitude of the definition suggested by Myers (2001), a significant amount of literature sums up the level of indebtedness to the ratio between long term debt and the total of capitals, which to Welch
(2011) does not capture the true dimension of companies ‘indebtedness. The author defends the inclusion of the current component (short term debt). Welch’s argument (2011)
strengthens the need to deal with current passive rubrics as a debt, otherwise companies would show a leverage profile really less aggressive than the one they actually have. For this author, the most consensual reasoning should be total passive over total assets.
There is a bipolarisation of opinions about the relationship between indebtedness and earnings management. On the one hand, there are those who defend a positive relationship (Beatty & Weber, 2003; Christie & Zimmerman, 1994; DeFond & Jiambalvo, 1994; Dichev & Skinner, 2002; Easterwood, 1997; Gu et al., 2005), on the other hand, those who see indebtedness as a moderator, thus giving a negative polarisation to the relationship (Bowen et al., 2008; Nardi & Nakao, 2009). This way we are led to formulate the following research hypothesis, which suggests more level of debt is connected to a greater level of earnings management:
H1: There is a positive relationship between the level of debt and earnings management.
Habib et al. (2013) show that, in economically harder periods, the benefits for the practice of earnings management are lower due to the strong sensitivity of financiers and investors. Kousenidis et al. (2013) confirms a decrease on the practice of earnings management with positive effects on the quality of the financial report during the first years of the latest financial crisis (2008). Gorgan et al. (2012) agree.
Yet, the opposite also seems plausible, according to the argumentation of Kousenidis et al. (2013): the companies might be lured to introduce practice of big bath behaviour, taking advantage of least favourable economic periods, leading to a greater proliferation of EM in this context.
Hence, once our study looks upon a period of particularly hard years from an economic point of view, as a result of the appliance of economic adjustment programmes, we formulate the following research hypothesis:
H2: The positive relationship between indebtedness and earnings management is softened in periods of economic adjustment programmes.
Part of Ireland’s strategy to attract investment in the recent decades is based on an attractive
law policy from a business perspective. Ireland has been able to attract many companies to set up in its market, many of those of a relevant size and with global operations. This reality has produced several changes in the business fabric, and one of them is without a doubt the increase of the average size of companies which contribute for its economy, differing a little from the Portuguese reality, as far as this is concerned.
Larger companies regularly use EM to control political costs which come from their dimension, as Watts and Zimmerman (1978), Zimmerman (1983) and Watts and Zimmerman (1990) focus. Evidence given by Rajan and Zingales (1995) say that larger companies have distinct behaviour as far as financing is concerned, as it is also defended by Frank and Goyal (2009). On the other hand, the increased size is mentioned by many (e.g., Doyle et al. 2007 e Ge & McVay 2005) as a disincentive to EM, due to the greater level of exposure and scrutiny that those kind of companies are subjected to.
The contingency theory offers an alternative model of organisational performance, which defends the idea that appropriate management decisions and actions depend on specific characteristics of each situation (Bartol et al., 1995). This theory is particularly relevant to studies on accounting which follow several countries, because it overcomes the companies’ features and considers the impact of those cultural and institutional contexts on accounting practices. (Lopes & Rodrigues, 2007). Previous literature offers empirical evidence that an institutional context of the country influences the quality of financial statement, being the greatest quality interpreted as the poorer earnings management (for instance, Ball et al., 2000; Leuz et al., 2003; Francis et al., 2005; Gaio, 2010). These assertions lead us to the formulation of our last research hypothesis:
H3: The relationship between the level of indebtedness and of earnings management is different among Portugal and Ireland.
3. Research design 3.1. Sample
Once this study is focussed on the analysis of unlisted companies in countries which have successfully complied economic adjustment programmes (Portugal and Ireland), the data was taken from Amadeus database, which belongs to Bureau Van Dijk group (BvD), between 2008 and 2016. This research has determined a total of 35 547 companies. Afterwards, we
have eliminated the companies which didn’t provide enough information for the calculation of
the pertinent variables, which reduced the sample to 1031 companies.
Then, we have removed the entities which belong to public administration, financial administration and insurances, because due to its specific systems and accounting standards,
the method of estimating accruals is different from the companies of the remaining sectors. From this operation we found a total of 1025 companies.
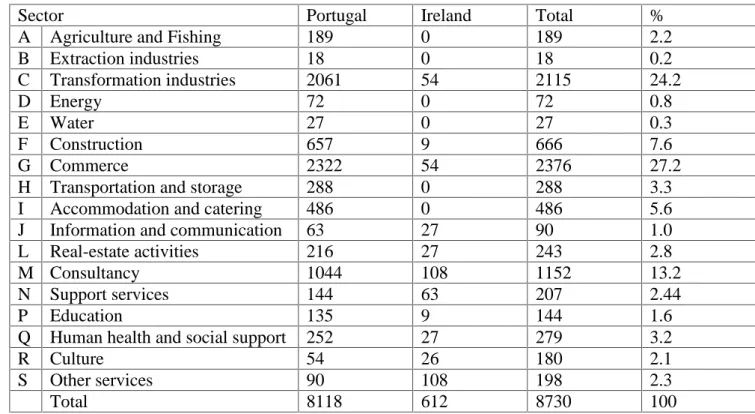
Finally, in each of the remaining sectors we have eliminated the values considered extreme, correspondent to the data with quantities outside the range of the average more/less 3 times the standard deviation, thus closing the sample in 970 companies, which correspond to 8730 observations. Table 1 summarises up the distribution of the sample per country and activity sector.
Table 1 – Distribution of the sample per country and activity sector
Sector Portugal Ireland Total %
A Agriculture and Fishing 189 0 189 2.2
B Extraction industries 18 0 18 0.2 C Transformation industries 2061 54 2115 24.2 D Energy 72 0 72 0.8 E Water 27 0 27 0.3 F Construction 657 9 666 7.6 G Commerce 2322 54 2376 27.2
H Transportation and storage 288 0 288 3.3
I Accommodation and catering 486 0 486 5.6
J Information and communication 63 27 90 1.0
L Real-estate activities 216 27 243 2.8
M Consultancy 1044 108 1152 13.2
N Support services 144 63 207 2.44
P Education 135 9 144 1.6
Q Human health and social support 252 27 279 3.2
R Culture 54 26 180 2.1
S Other services 90 108 198 2.3
Total 8118 612 8730 100
Table 1 summarises the sample per activity sector, where the prevaling of Industry and Commerce sectors is obvious, more than half of the companies of our sample (51,4%), followed by the Consultancy sector with 13,2% of the companies involved. The sample is majorly build of Portuguese companies, due to lack of data from Ireland’s analogous.
3.2. Dependent variable
The dependent variable of our study is the level of earnings management (EM). The way to measure the level of EM has been a major issue shared by the majority of authors throughout research dedicated to it. The method based on the accruals is one of the alternatives followed by many, among who we have included ourselves for the present study.
Accruals ensue from the economic or financial performance registered (expenses and incomes) which does not have permanent nor temporary equivalence with a corresponding cash-flow (cash receipts and payments). Together with the cash-flows, the accruals are the core of financial statements presented by the companies. Its calculation is possible, though indirectly, by the difference between the operational cash-flows and the earnings of a certain period (Healy, 1985).
The work of Callao & Jarne (2010) had Amadeus database (BvD) as its source for the data collection. The calculation of the total accruals (TA) was done according to the following equation:
, = Δ , + Δ , − Δ , − , (1)
In which:
, = Total Accruals of company i during period t
Δ , = Variation of the Recievables of company i during period t
Δ , = Variation of Inventories of company i during period t
Δ , = Variation of Payables of company i during period t , = Total of depreciations of company i during period t
Nevertheless, not all accruals are truly changeable, evidence which has found wide agreement amongst researchers in the past few years. As a result, in the literature it is almost certain that TA have two ways: one that comes from normal operational activity and investment, which corresponds to non-discretionary accruals (AND), and another one that occurs from accounting standards and managers’ professional judgement, which assumes the discretionary way (AD) (Gorgan et al., 2012).
However, the latter may not be obtained nor calculated directly from the companies’ financial
statements. It can be done through estimation models, and in the context of this study we have chosen to follow the model suggested by Jones (1991), as well as the versions modified by Dechow et al. (1995), Kasznik (1999) and Kothari et al. ( 2005).
From the regression of the models mentioned above, we obtain the portion of AND present in TA, while AD will be the released residues (that is to say, the unexplained portion of the models) or, if we will, the difference between TA and AND.
Mathematically we reach:
TA, = AND, + AD, (2)
Readjusting according to AD:
AD, = TA, − AND, (3)
In which:
AD, = Discretionary Accruals of company i during t
TA, = Total Accruals of company i during t
AND,= Non-Discretionary Accruals of company i during t
The measure of EM will be:
The more the level of EM is higher, the greater will the absolute value of AD be, due to estimation models, individually applied to each sector as a way to decrease possible sectorial effects while finding the level of accruals.
The original model of Jones (1991) estimates the accruals according to the variation of the
companies’ turnover and the companies’ tangible fixed assets. It is obvious that the turnover
is a non discretionary caption, so it is not subjected to manipulation. This model, Original Jones Model (OJM) is embodied in the following phrase:
, , = + 1 , + ( Sales, ) , + , , + , (5)
Afterwards, in order to improve the original model, several changes of the original model were developed (Dechow et al., 1995; Kasznik, 1999; Kothari et al., 2005). In the present study, three additional models apart from the original model were: Modified Jones Model suggested by Dechow et al. (1995); Cash-Flow Jones Model developed by Kasznik (1999); and Performance Matched Model developed by Kothari et al.(2005).
Dechow et al. (1995) lead the first change of the previous model because they feel the turnover caption is highly influenced by managers’ discretionary behaviour, which leads them to suggest the inclusion of the caption of receivables, subtracting it to the turnover, so that it is possible to decrease the effect of credit sales. The materialisation of this change is quite obvious in the model Modified Jones Model (MJM), illustrated in the following equation:
, , = + 1 , + (ΔSales, − Δ , ) , + , , + , (6)
A new adjustment is developed by Kasznik (1999), by adding Operational Cash-Flow (CFO). The author considers that this component has a non-discretionary effect on AT, and its inclusion is plausible to soften mistakes in measuring the accruals. Cash-Flow Jones Model
(CFJM) is represented as follows: , , = + 1 , + (ΔSales, − Δ , ) , + , , + , , + , (7)
Once Kothari et al. (2005) admits another measure of performance, that is to say Return on Assets (ROA), he wishes to purge EM motivated by weaker stronger performances, thus capturing the level of earnings management which goes beyond that reality, and at the same time makes it possible to compare companies from the same sector. The mathematical expression comes from the change operated by Dechow et al. (1995), in addition to the element ROA, Performance Matched Jones Model (PMJM):
, , = + 1 , + (ΔSales, − Δ , ) , + , , + , + , (8) In which:
TA, = Total Accruals of company i in year t
ΔSales, = Sales variation of company i in year t according to year t-1
ΔRec, = Variation of the receivables of company i in year t according to year t-1
PPE, = Total of AFT (property, plant and equipment) of company i in year t
CFO, = Operational Cash-flow of company i in year t
ROA, = Return on Assets of company i in year t;
A, = Total Assets of company i in year t-1.
To close and make the estimation of AD possible in the equation (3) for the correspondent phrase in equation (4) which allows its calculation.
Original Jones - Jones (1991) , , = , , − + 1 , + , , + , , (9)
The rest of the changed models were estimated according to the same method.
3.3. Independent variables
The main independent variable of this study is the level of financial leverage (LEV), which acknowledges attracting variations on the debt capitals related to the actives, picturing the movement of companies in what concerns financing contract. It also acknowledges differing the way companies which consistently operate with high levels of leverage behave, from the way companies deal with financing as an occasion resource.
According to previous studies, the leverage variable (LEV) has differed, as there are those who prefer considering only the long term debt over the total active as a ratio (e.g., Bowen et al. 2008). Other studies, for instance, Watrin et al. (2014), divide the total of the financial debt (which consists of long and short term debt) by equity. More widespread, Gu et al. (2005) consider the total of the passive in the numerator, arguing that all captions of the passive, including receivables, are financing tools. In the present study we calculate the debt variable according to Gu et al. (2005), by dividing the total passive for the total assets.
We have selected, as variables of control, some aspects of corporate reality which simultaneously influence the level of EM and capital structure, and that have earlier been followed by many researchers, such as Watrin et al. (2014) and Gu et al. (2005), just to mention a few. They have found relationships in different ways between size (SIZE), profitablility (PROF), growth (GROW) and earnings management. There is also those who add the level of tangible fixed actives as a preferable variable to measure EM (e.g., Harris & Raviv 1991), an option that we too have chosen to follow.
The variable SIZE goes beyond reflecting political sensitivity and its consequences (namely a more regular tool to EM by larger companies in order to control the inherent political costs which come from its size), mentioned by Watts & Zimmerman (1978), Zimmerman (1983) and Watts & Zimmerman (1990), because larger companies tend to show specific behaviour in what indebtedness is concerned, according to their ability to access different sources of investment and growing to remain in higher financial leverage standards (Rajan & Zingales, 1995). Frank & Goyal (2009) assign this ability to a lower portion of fixed bankrupcy costs,
2007 and Ge & McVay 2005) as a discouragement of EM, because of the higher level of exposure and scrutiny that companies in this condition are subjected to. The calculation of the variable SIZE is done through the natural logarithm of the total assets.
For the control, the variable profitability (PROF) was considered. The ability to generate positive earnings, catalist for self-financing, allows greater Independence in what external financing is concerned, and at the same time puts companies in more comfortable situations in accessing it, in terms of negotiating. Rajan and Zingales (1995) also prove that more profitable companies are most likely less leveraged. The same authors determine profitability (PROF) through the quotient EBITDA / Total Assets, option that we have also chosen for our research. The relationship between profitability and earnings management practices may be even more different: (i) managers may manipulate earnings shifted upwards to please analysts, or for their own interest, depending on the compensation package; (ii) they may try quite the opposite by cleansing their poor earnings (Big Bath Behaviour), in more hostile economic contexts such as the current crisis (Kousenidis et al., 2013); (iii) or even a disciplinarian relationship, as suggested by Kothari et al. (2005), when companies showing consistently positive earnings become more coveted, and subjected to a thorough scrutiny. The level of tangible actives (TANG) is also essential, equally important, in the path of securing financing. One of the main reasons lays on the fact that these actives may easily be changed (Rajan & Zingales, 1995). At the same time, they constitute some kind of assurance for investors in liquidation contexts. Harris and Raviv (1991) infer through their model that between companies with higher liquidation value are those with higher level of tangible actives. These reasons point to a negative relationship between financing costs and levels of tangible actives, which leads us to believe that companies with larger volume of tangible actives operate with more generous indebtedness ratio. The works of Titman and Wessels (1988), Frank and Goyal (2009) and Rajan and Zingales (1995) confirm these inferences. The ratio Tangible Fixed Assets / Total Assets was a factor to take into account the calculation of
TANG, as Cohen and Zarowin (2008) had noticed, among other authors.
We also add another variable of control, growth (GROW), which corresponds to the growth rate of the companies in the sample, calculated through the percentage variation of the total active, copying Lee and Mande (2002). Besides being a motivation for earnings management itself, this also allows to help the control of the effects of different performances between companies.
3.4. The model
As the main goal of this study is to analyse the relationship between the financing decisions and the EM practice, we have developed the following model:
, = + , + , + , + , + , (10)
In which:
, = Level of Earnings Management of company i during t , = Level of financial leverage of company i during t
, = Size of company i during t
, = Level of tangible actives of company i during t , = Growth of company i during t
4. Results
4.1. Descriptive statistics
The average values for each of the variables presents in the model, as well as other descriptive measures of statistic relevance, are presented in Table 2.
Table 2 – Descriptive statistic of the variables present in the model
Variável Medium Median Standard
deviation Minimum Maximum EM-OJ 0.099 0.061 0.134 0.000 4.808 EM-MJ 0.098 0.060 0.142 0.000 4.733 EM-CFJ 0.099 0.063 0.138 0.000 4.593 EM-PMJ 0.096 0.060 0.139 0.000 4.864 LEV 0.764 0.691 0.875 -0.053 29.137 PROF 0.002 0.013 0.170 -5.9742 1.452 SIZE 6.561 6.364 1.739 1.799 12.166 TANG 0.347 0.287 0.277 0.000 0.999 GROW -0.003 -0.001 0.237 -6.714 0.942
EM-OJ is the absolute value of discretionary accruals calculated by Original Jones Model; EM-MJ is the absolute value of discretionary accruals calculated by Modified Jones Model; EM-CFJ is the absolute value of discretionary accruals calculated by Cash-Flow Jones Model; EM-PMJ is the absolute value of discretionary accruals calculated by Performance Matched Jones Model; LEV is the ratio between the total liabilities and the total assets; PROF is the ratio between EBITDA and the total assets; SIZE is the natural logarithm of the total assets; GROW is the annual percentage variation of the total assets; Number of observation is 8730.
By descending order we have the dependent variable in its four calculation variants, followed by the independent variables.
The level of EM measured by the four models presents averages around 9.9% similar to the values presented by Leuz et al. (2003) for Portuguese companies, with averages around approximately 7.5% and 12%, as foreseen by the study of Dias (2015). Such as in Gu et al. (2005), the main independent variable, which finds the financial leverage level, presents a relatively high average value, in our case even higher, with a value around 76%. The average profitability below 1% and the negative growth rate partially justify the economic hard period of the years studied. The average level of tangible actives rested at 34.7%, in rough terms.
4.2. Results of empirical analysis
Table 4 demonstrates the results obtained on the estimation of the model (10) for the total of the sample. The present estimation intends to test the first hypothesis (H1) developed in the present study. The results show, with significant statistic (a level of 0.01), a positive relationship between the level of EM and the level of indebtedness. We infer that this relationship show the same level of significance in all the other estimation models, that is to say, for the four variants of the EM variable (EM-OJ, EM-MJ, EM-CFJ, EM-PMJ).
Consequently we can Podemos então deduce that, in average, higher levels of financial leverage will be positively related to higher levels of earnings management.
Table 4 – Relationship between indebtedness and earnings management
EM-OJ EM-MJ EM-CFJ EM-PMJ
LEV 0.024*** (13.134) 0.025*** (13.073) 0.0220*** (11.938) 0.0223*** (12.116) SIZE -0.009*** (-10.364) -0.009*** (-9.996) -0.009*** (-10.480) -0.008*** (-9.742) TANG -0.067*** (-12.920) -0.067*** (-12.625) -0.072*** (-13.912) -0.067*** (-12.971) GROW 0.057*** (8.903) 0.060*** (9.078) 0.050*** (7.878) 0.064*** (9.957) PROF -0.067*** (-6.342) -0.069*** (-6.400) -0.0449*** (-4.665) -0.038*** (-2.643) Adj R2 0.077 0.076 0.071 0.065 N 8730 8730 8730 8730
*, **, e *** statistically significant for a level of significance of 0.1, 0.05 e 0.01 respetively; EM-OJ is the absolute value of discretionary accruals calculated by Original Jones Model; EM-MJ is the absolute value of discretionary accruals calculated by Modified Jones Model; EM-CFJ is the absolute value of discretionary accruals calculated by Cash-Flow Jones Model; EM-PMJ is the absolute value of discretionary accruals calculated by Performance Matched Jones Model; LEV is the ratio between the total liabilities and the total assets; PROF is the ratio between EBITDA and the total assets; SIZE is the natural logarithm of the total assets; GROW is the annual percentage variation of the total assets.
These conclusions validate and confirm the first research hypothesis (H1) which we have formulated and are consistent with previous research (e.g., Beatty & Weber, 2003; Christie & Zimmerman, 1994; DeFond & Jiambalvo, 1994; Dichev & Skinner, 2002; Easterwood, 1997; Gu et al., 2005).
The variable size (SIZE) is negatively associated to earnings management, which indicates that smaller companies tend to use EM more than larger companies. The same is proven in what the profitability variable (PROF) is concerned, indicating that less profitable companies use EM more than those which are more profitable. These conclusions corroborate previous ones, namely by Doyle et al. (2007). Furthermore, we have the growth rate variable (GROW) which presents a positive relationship with EM, meaning that companies with higher growth rates are more likely to manipulate their earnings, such as McNichols (2000), Skinner & Sloan (2002) and again Doyle et al. (2007) had said. Finally, the negative association between the level of fixed tangible actives (TANG) and EM found, is in accordance with Frank and Goyal (2009), Rajan & Zingales (1995), Harris & Raviv (1991) and Titman & Wessels (1988), and allows us to conclude that to a lower level of tangible fixed actives (AFT) corresponds a higher level of EM.
The second hypothesis of the study (H2) intends to analyse whether the relationship between the use of earnings management and indebtedness is softened during the economic adjustment programmes applied to Portugal and Ireland. In order to do so, adjustments have been made to the model firstly designed (10), in a way to yield pertinent inferences to the approach of the second research hypothesis.
For this, a dichotomy variable was created, named ADJPR (Adjustment Programme), which allows controlling the effects of the readjustment period earlier referred to, whose value equals to one for the years of adjustment and a value equal to zero for the rest of the years. Before creating the variable of interaction, we centred the variable LEV in its average (which
we further designate as LEVC), in order to optimise its interpretation and avoid future issues of multicolinearity, as explained by Afshartous & Preston (2011). We then relate the latter with the variable for the adjustment period (ADJPR), which originated the variable
LEVCxADJPR, which allows inferring the behaviour of the relationship between EM and
indebtedness in the adjustment period. Consequently, the adjusted model was estimated. All the years of transition were excluded from the model, in order to avoid the potentially contradictory effects, as DeFond et al. (2012) had previously done. Thus, once the adjustment years are not perfectly coincident among the two countries, we have excluded the years of 2011 and 2014 for the Portuguese companies and the years of 2010 and 2013 for the Irish. This improvement has decreased the number of observations from the initially 8730 to 6790. Table 5 shows the results of this second regression, making the effects of financial assistance programmes visible in the relationship between the financial leverage and earnings management.
Table 5 – Impact of the economic adjustment period in the relationship between Indebtedness and earnings management
EM-OJ EM-MJ EM-CFJ EM-PMJ
LEVC 0.015*** (6.167) 0.014*** (5.832) 0.014*** (6.4142) 0.015*** (6.469) ADJPR -0.015*** (-4.086) -0.014*** (-3.628) -0.014*** (-3.703) -0.014*** (-3.819) LEVC*ADJPR -0.013** (-2.478) -0.010* (-1.926) -0.022*** (-4.4275) -0.017*** (-3.165) SIZE -0.009*** (-8.545) -0.008*** (-8.239) -0.009*** (-8.807) -0.008*** (-8.101) TANG -0.073*** (-12.019) -0.072*** (-11.701) -0.076*** (-12.631) -0.072*** (-11.707) GROW 0.109*** (13.420) 0.111*** (13.478) 0.101*** (12.631) 0.103*** (12.664) PROF -0.194*** (-13.554) -0.195*** (-13.488) -0.177*** (-12.564) -0.158*** (-11.059) Adj R2 0.095 0.093 0.089 0.081 N 6790 6790 6790 6790
*, **, e *** statistically significant for a level of significance of 0.1, 0.05 e 0.01 respectively; EM-OJ is the absolute value of discretionary accruals calculated by Original Jones Model; EM-MJ is the absolute value of discretionary accruals calculated by Modified Jones Model; EM-CFJ is the absolute value of discretionary accruals calculated by Cash-Flow Jones Model; EM-PMJ is the absolute value of discretionary accruals calculated by Performance Matched Jones Model; LEV is the ratio between the total liabilities and the total assets; PROF is the ratio between EBITDA and the total assets; SIZE is the natural logarithm of the total assets; GROW is the annual percentage variation of the total assets.
The results show that, whether with the main independent variable or with the control variables, the correlation remains unaltered, also maintaining its relevance in terms of statistic significance. The interaction of the variable LEVC with ADJPR, added to control the effects of the effects of the adjustment programmes, is highly significant from a statistical point of view, although at different levels for the four versions of EM. As far as the EM calculated by the models CFJM and PMJM are concerned, the level of significance is 0.01, whilst to OJM and MJM it is 0.05 and 0.10 respectively, although statistically significant. In every case the coefficient is negative, which allows the conclusion that the relationship between the level of
hypothesis was thus validated, confirming a softening in the positive relationship between indebtedness and the use of earnings management in the adjustment period for the sample of this study.
Table 6 demonstrates the results obtained by estimating model (10) separated by each country to test the third hypothesis (H3) of our study.
Table 6 – Relationship between indebtedness and earnings management in Portugal and Ireland: Regression Isolated by country
EM-OJ EM-MJ EM-CFJ EM-PMJ
Panel A: Ireland LEV 0.045*** (5.182) 0.053*** (5.170) 0.050*** (4.969) 0.056*** (4.222) SIZE -0.005*** (-3.284) -0.002 (0.926) -0.002* (-1.680) -0.005** (-2.438) TANG -0.045*** (-6.163) -0.033*** (-3.965) -0.050*** (-5.897) -0.063*** (-6.930) GROW 0.021 (1.410) 0.006 (0.346) -0.012 (-0.672) -0.055*** (2.900) PROF -0.003 (-0.182) 0.009 (0.465) 0.046** (2.214) 0.027 (1.220) Adj R2 0.090 0.063 0.089 0.10 N 612 612 612 612 Panel B: Portugal LEV 0.023*** (11.928) 0.023*** (11.783) 0.020*** (10.682) 0.022*** (11.452) SIZE -0.008*** (-9.354) -0.008*** (9.317) -0.009*** (-9.834) -0.008*** (-9.121) TANG -0.065*** (-11.052) -0.065*** (-10.929) -0.070*** (-11.979) -0.065*** (-11.167) GROW 0.057*** (8.531) 0.060*** (8.808) -0.052*** (-7.708) -0.068*** (10.202) PROF -0.074*** (-6.523) -0.077*** (-6.673) -0.058*** (-5.156) -0.027*** (-2.446) Adj R2 0.071 0.070 0.065 0.60 N 8118 8118 8118 8118
*, **, e *** statistically significant for a level of significance of 0.1, 0.05 e 0.01 respectively; EM-OJ is the absolute value of discretionary accruals calculated by Original Jones Model; EM-MJ is the absolute value of discretionary accruals calculated by Modified Jones Model; EM-CFJ is the absolute value of discretionary accruals calculated by Cash-Flow Jones Model; EM-PMJ is the absolute value of discretionary accruals calculated by Performance Matched Jones Model; LEV is the ratio between the total liabilities and the total assets; PROF is the ratio between EBITDA and the total assets; SIZE is the natural logarithm of the total assets; GROW is the annual percentage variation of the total assets.
The results show that in Ireland the relationship between the level of indebdtedness and EM is higher than the one in Portugal, with aproximate coefficients of 0.045 and 0.023, respectively. This result is outstanding because of the high level of statistic significance, of 0.01. Consequently, we confirm our hypothesis 3, validating that the relationship between the level of indebdtedness and the level of EM is not the same in Portugal as in Ireland, for the companies which we include in our sample. The conclusions are applicable to the four calculation variants of the dependent variable EM (EM-OJ, EM-MJ, EM-CFJ e EM-PMJ), regardless of, in any case, some of the variables of control have partially, or even completely lost its statistic significance.
5. Conclusions
The present study analyses the relationship between the major decisions of capitals (assuming the level of indebtedness as its representation) and the level of earnings management, practised by Portuguese and Irish private companies between 2008 and 2016. The choice of these two countries lies on the fact that they both experienced strong financial assistance programmes, and it is pertinent to assess the indebtedness and earnings management phenomenon in this particularly economic harsh context.
The main results of the study demonstrate that the higher the companies’ indebtedness, the stronger the level of earnings management, coherent with previous studies (e.g., Beatty & Weber, 2003; Christie & Zimmerman, 1994; DeFond & Jiambalvo, 1994; Dichev & Skinner, 2002; Easterwood, 1997; Gu et al., 2005). Additionally, the results show that earnings management is softened in the economic adjustment period, which is similar to what was found by Habib et al. (2013) and Kousenidis et al. (2013), for periods of economic retraction. Finally, this study concluded that there is a difference of levels of earnings management amongst Portugal and Ireland.
For future studies it should be interesting to include other countries subjected to adjustment programmes in the sample. Greece and Spain would utterly be good candidates for that. In addition, the few years after the adjustment programmes are obviously insufficient to allow a post-adjustment analysis, which would be relevant to understand whether the conclusions expounded would maintain. Future studies may research those effects.
6. Bibliography
Afshartous, D., & Preston, R. (2011). Key result of interaction models with centering. Journal
of Statistics Education, 19(3), 1–24.
Alcidi, C., Belke, A., Giovannini, A., & Gros, D. (2016). Macroeconomic adjustment programmes in the euro area: an overall assessment. International Economics and
Economic Policy, 13(3), 345–358.
Allayannis, G., & Weston, J. P. (2006). Earnings volatility , cash Flow volatility , and Firm
value.
Baker, M., & Wurgler, J. (2002). Market Timing and Capital Structure. The Journal of
Finance, 57(1), 1–32.
Ball, R., S.P. Kothari and A. Robin (2000), The effect of international institutional factors on properties of accounting earnings, Journal of Accounting & Economics 29, 1–52.
Baralexis, S. (2004). Creative accounting in small advancing countries. The Greek case.
Managerial Auditing Journal, 19(3), 440–461.
Barth, M. R., Beaver, W. H., Hand, J. M., & Landsman, W. R. (1999). Accruals, cash flows, and equity values. Review of Accounting Studies, 4(3), 205–229.
Beatty, A., & Weber, J. (2003). The effects of debt contracting on voluntary accounting method changes. Accounting Review, 78(1), 119–142.
Belke, A., & Schnabl, G. (2013). Four Generations of Global Imbalances. Review of
International Economics, 21(1), 1–5.
Beneish, M. D. (1999). Incentives Earnings and Penalties Related to Overstatements that Violate. The Accounting Review, 74(4), 425–457.
Beneish, M. D. (2001). Earnings management : A perspective. Managerial Finance, 27, 3–17. Bowen, R. M., Rajgopal, S., & Venkatachalam, M. (2008). Accounting Discretion, Corporate Governance, and Firm Performance. Contemporary Accounting Research, 25(2), 351– 405.
Bradley, M., Jarrell, G. a, & Kim, E. H. (1984). On the Existence of an Optimal Capital Structure: Theory and Evidence. Journal of Finance, 39(3), 857.
Brennan, M. J., & Schwartz, E. S. (1978). Corporate Income Taxes, Valuation, and the Problem of Optimal Capital Structure. The Journal of Business, 51(1), 103–114.
Burgstahler, D. C., Hail, L., & Leuz, C. (2006). The Importance of Reporting Incentives: Earnings Management in European Private and Public Firms. The Accounting Review,
81(5), 983–1016.
Burgstahler, D., & Eames, M. J. (2003). Earnings Management to Avoid Losses and Earnings Decreases: Are Analysts Fooled?. Contemporary Accounting Research, 20(2), 253–294. Cahan, S. F. (1992). The Effect of Antitrust Investigations on Discretionary Accruals: A
Refined Test of the Political-Cost Hypothesis. The Accounting Review, 67(1), 77–95. Callao, S., & Jarne, J. I. (2010). Have IFRS Affected Earnings Management in the European
Union? Accounting in Europe, 7(2), 159–189.
Christie, A. A. (1990). Aggregation of test statistics. Journal of Accounting and Economics,
12(1–3), 15–36.
Christie, A. a, & Zimmerman, J. L. (1994). Efficient and Opportunistic Choices of Accounting Procedures: Corporate Control Contests. The Accounting Review, 69(4), 539–566.
Cohen, D. A. (2011). Quality of Financial Reporting Choice: Determinants and Economic
Consequences.
Cohen, D. A., & Zarowin, P. (2008). Economic Consequences of Real and Accrual-Based
Earnings Management Activities. Working Paper, New York University.
Coppens, L., & Peek, E. (2005). An analysis of earnings management by European private firms. Journal of International Accounting, Auditing and Taxation, 14(1), 1–17.
Dai, R. (2012). International Accounting Databases on WRDS: Comparative Analysis.
Wharton Research Data Services, University of Pennsylvania.
Dechow, P., & Dichev, I. D. (2002). The Quality of Accruals and Earings: The Role of Accruals Estimation Errors. The Accounting Review, 77(supplement), 35–59.
Dechow, P. M. (1994). Accounting earnings and cash flows as measures of firm performance. The role of accounting accruals. Journal of Accounting and Economics, 18(1), 3–42. Dechow, P. M., Ge, W., Larson, C. R., & Sloan, R. G. (2011). Predicting Material Accounting
Misstatements. Contemporary Accounting Research, 28(1), 17–82.
Dechow, P. M., & Skinner, D. J. (2000). Earnings management: Reconciling the views of accounting academics, practitioners, and regulators. Accounting Horizons, 14(2), 235–
250.
Dechow, P. M., & Sloan, R. G. (1991). Executive incentives and the horizon problem: An empirical investigation. Journal of Accounting and Economics, 14(1), 51–89.
Dechow, P. M., Sloan, R. G., & Sweeney, A. P. (1995). Detecting Earnings Management. The
Accounting Review, 70(2), 193–225.
Dechow, P. M., Sloan, R. G., & Sweeney, A. P. (1996). Causes and Consequences of Earnings Manipulation: An Analysis of Firms Subject to Enforcement Actions by the SEC. Contemporary Accounting Research, 13(1), 37–47.
DeFond, M., Hu, X., Hung, M., & Li, S. (2012). Has the widespread adoption of IFRS
reduced US firms’ attractiveness to foreign investors? Journal of International Accounting Research, 11(2), 27–55.
DeFond, M. L., & Jiambalvo, J. (1994). Debt covenant violation and manipulation of accruals. Journal of Accounting and Economics, 17(1–2), 145–176.
Dhaliwal, D. S. (1980). The Effect of the Firm’s Capital Structure on the Choice of
Accounting Methods. The Accounting Review, 55(1), 78–84.
Dias, P. (2015). As diferenças entre o resultado contabilístico e o fiscal e a gestão dos
resultados Evidência empírica de empresas privadas portuguesas.
Dichev, I. D., & Skinner, D. J. (2002). Large-sample evidence on the debt covenant hypothesis. Journal of Accounting Research, 40(4), 1091–1123.
Doyle, J., Ge, W., & McVay, S. (2007). Accruals and internal control over financial reporting.
The Accounting Review, 82(5), 1141–1170.
DuCharme, L. L., Malatesta, P. H., & Sefcik, S. E. (2001). Earnings Management: IPO Valuation and Subsequent Performance. Journal of Accounting, Auditing & Finance,
16(4), 369–396.
Easley, D., & O’Hara, M. (2004). Information and the cost of capital. Journal of Finance, 59(4), 1553–1583.
Easterwood, C. M. (1997). Takeovers and Incentives for Earnings Management: An Empirical Analysis. Journal of Applied Business Research, 14(1), 29–48.
Elliot, J. a, & Hanna, J. D. (1996). Repeated Accounting Write-Offs and the Information Content of Earnings. Journal of Accounting Research, 34(Supplement), 135–155.
European Stability Mechanism. (2014). Eurpean Stability Mechanism Annual Report -2014. Fischer, E. O., Heinkel, R., & Zechner, J. (1989). Dynamic Capital Structure Choice : Theory
and Tests. Journal of Finance, 44(1), 19–40.
Francis, J., Hanna, J. D., & Vincent, L. (1996). Causes and Effects of Discretionary Asset Write-Offs. Journal of Accounting Research, 34, 117–134.
Francis, J.R., I.K. Khurana & Pereira, R. (2005), Disclosure incentives and effects on cost of capital around the world, The Accounting Review 80(4), 1125-1162.
Frank, M. Z., e Goyal, V. K. (2009). Capital Structure Decisions around the World: Which Factors Are Reliably Important? Financial Management, 38(1), 1–37.
Gaio, C. (2010), The relative importance of firm and country characteristics for earnings quality around the world, European Accounting Review 19(4), 693-738.
Ge, V., & McVay, S. (2005). The diclosure of material weaknesses in internal control after the Sarbanes -Oxley Act. Accounting Horizons, 19(3), 137–158.
Giavazzi, F., & Spaventa, L. (2010). Why the current account matters in a monetary union
Lessons from the financial crisis in the Euro area.
Gorgan, C., Gorgan, V., Dumitru, V. F., & Pitulice, I. C. (2012). the Evolution of the Accounting Practices During the Recent Economic Crisis : Empirical Survey Regarding the Earning Management. The Amfiteatru Economics Journal, 14(32), 550–563.
Gu, Z., Lee, C. W. J., & Rosett, J. G. (2005). What determines the variability of accounting accruals? Review of Quantitative Finance and Accounting, 24(3), 313–334.
Guidry, F., Leone, A. J., Rock, S., Simon, W. E., Beneish, D., Billings, B., … Stuart, N. (1999). Earnings-based bonus plans and earnings management by business-unit managers. Journal of Accounting and Economics, 26, 113–142.
Habib, A., Uddin, B. B., & Islam, A. (2013). Financial distress, earnings management and market pricing of accruals during the global financial crisis. Managerial Finance, 39(2), 155–180.
Harris, M., & Raviv, A. (1991). The Theory of Capital Structure. The Journal of Finance,
46(1), 297–355.
Healy, P. M. (1985). The effect of bonus schemes on accounting decisions. Journal of
Accounting and Economics, 7(1–3), 85–107.
Healy, P. M., & Wahlen, J. M. (1999). A review of the earnings management literature and its implications for standard setting. Accounting Horizons, 13(4), 365–383.
Holthausen, R. W., Larcker, D. F., & Sloan, R. G. (1995). Annual bonus schemes and the
manipulation of earnings. Journal of Accounting and Economics (Vol. 19).
Jelinek, K. (2007). The effect of leverage increases on real earnings management. The Journal
of Business and Economic Studies, 13(Fall), 24–46.
Jensen, M. C., & Meckling, W. H. (1976). Theory of the firm: Managerial behavior, agency costs and ownership structure. Journal of Financial Economics, 3(4), 305–360.
Jones, J. J. (1991). Earnings Management During Import Relief Investigations. Journal of
Accounting Research, 29(2), 193–228.
Jones, M. J. (2011). Creative accounting, fraud and international accounting scandals. John Wiley & Sons.
Kasznik, R. (1999). On the Association between Voluntary Disclosure and Earnings Management. Journal of Accounting Research, 37(1), 57–82.
Kothari, S. P., Leone, A. J., & Wasley, C. E. (2005). Performance matched discretionary accrual measures. Journal of Accounting and Economics, 39(1), 163–197.
Kousenidis, D. V., Ladas, A. C., & Negakis, C. I. (2013). The effects of the European debt crisis on earnings quality. International Review of Financial Analysis, 30, 351–362. Kraus, A. e Litzenberger, R. H. (1973). A State-Preference Model of Optimal Financial
Leverage. Journal of Finance, 28(1), 911–922.
1995 on Accounting Discretion of Client Managers of Big 6 and Non-Big 6 Auditors.
Auditing: A Journal of Practice & Theory, 22(1), 93–108.
Leland, H. E. (1994). Corporate Debt Value, Bond Covenants, and Optimal Capital Structure.
Journal of Finance, 49(4), 1213–1252.
Leland, H. E., & Pyle, D. H. (1977). Informational Asymmetries, Financial Structure, and Financial Intermediation. The Journal of Finance, 32(2), 371–387.
Leuz, C., Nanda, D., & Wysocki, P. D. (2003). Earnings management and investor protection: An international comparison. Journal of Financial Economics, 69(3), 505–527.
McNichols, M. F. (2000). Research design issues in earnings management studies. Journal of
Accounting and Public Policy, 19(4–5), 313–345.
Mendes, C. A., & Rodrigues, L. L. (2007). Determinantes da Manipulação Contabilística.
Revista de Estudos Politécnicos, IV(7), 189–210.
Minton, B. A., & Schrand, C. (1999). The impact of cash flow volatility on discretionary investment and the costs of debt and equity financing. Journal of Financial Economics,
54(3), 423–460.
Modigliani, F., & Miller, M. H. (1958). the Cost of Capital, Corporation Finance and the Theory of Investment, 48(3), 261–297.
Modigliani, F., & Miller, M. H. (1963). Corporate Income Taxes and the Cost of Capital: A Correction. The American Economic Review, 53(3), 433–443.
Mulford, C. W., & Comiskey, E. E. (2011). The Financial Numbers Game : Detecting
Creative Accounting Practices. John Wiley & Sons.
Myers, S. (2001). Capital Structure. Journal of Economic Perspectives, 15(2), 81–102.
Myers, S., & Majluf, N. (1984). Corporate financing and investment decisions when firms have information that investors do not have. Journal of Financial Economics, 13(2), 187–221.
Nardi, P. C. C., & Nakao, S. H. (2009). Gerenciamento de resultados e a relação com o custo da dívida das empresas brasileiras abertas. Revista Contabilidade & Finanças, 20(51), 77–100.
Othman, H. Ben, & Zeghal, D. (2006). A study of earnings-management motives in the Anglo-American and Euro-Continental accounting models: The Canadian and French cases. The International Journal of Accounting, 41(4), 406–435.
Rajan, R. G., & Zingales, L. (1995). What Do We Know about Capital Structure? Some Evidence from International Data. The Journal of Finance, 50(5), 1421–1460.
Rangan, S. (1998). Earnings management and the performance of seasoned equity offerings.
Journal of Financial Economics, 50(1), 101–122.
Ross, S. A. (1977). The Determination of Financial Structure: The Incentive Signalling Approach. Bell Journal of Economics, 8(1), 23–40.
Schipper, K. (1989). Commentary on Earnings Management. Accounting Horizons, 3, 91– 102.
Schipper, K., & Vincent, L. (2003). Earnings Quality. Accounting Horizons, 85, 97–110. Shivakumar, L. (2000). Do firms mislead investors by overstating earnings before seasoned
Skinner, D. J., & Sloan, R. G. (2002). Earnings Surprises, Growth Expectations, and Stock
Returns or Don’t Let an Earnings Torpedo Sink Your Portfolio. Review of Accounting Studies, 7(2/3), 289–312.
Subramanyam, K. R. (1996). The pricing of discretionary accruals. Journal of Accounting and
Economics, 22(1–3), 249–281.
Teoh, S. H., Welch, I., & Wong, T. J. (1998). Earnings management and the long‐run market performance of initial public offerings. The Journal of Finance, 53(6), 1935–1974. Teoh, S. H., Welch, I., & Wong, T. J. (1998). Earnings Management and the
Underperformance of Seasoned Equity Offerings. Journal of Financial Economics,
50(1), 63–99.
Titman, S., & Wessels, R. (1988). The Determinants of Capital Structure. The Journal of
Finance, 43(1), 1–19.
Tucker, J. W., & Zarowin, P. A. (2006). Does Income Smoothing Improve Earnings Informativeness? The Accounting Review, 81(1), 251–270.
Watrin, C., Ebert, N., & Thomsen, M. (2014). Book-Tax Conformity and Earnings Management: Insights from European One-and Two-Book Systems., 36(2 OP-Journal of the American Taxation Association. Fall2014, Vol. 36 Issue 2, p55-89. 35p.), 55.
Watts, R. L., & Zimmerman, J. L. (1978). Towards a Positive Theory of the Determination of Accounting Standards. The Accounting Review, 53(1), 112–134.
Watts, R. L., & Zimmerman, J. L. (1986). Positive Accounting Theory. Englewood Cliffs, New Jersey.: Prentice-Hall Inc.
Watts, R. L., & Zimmerman, J. L. (1990). Positive Accounting Theory: A Ten Year Perspective. The Accounting Review, 65(1), 131–156.
Welch, I. (2011). Two common problems in capital structure research: The financial-debt-to-asset ratio and issuing activity versus leverage changes. International Review of Finance,
11(1), 1–17.
White, H. (1980). A Heteroskedasticity-Consistent Covariance Matrix Estimator and a Direct Test for Heteroskedasticity. Econometrica.
Zimmerman, J. L. (1983). Taxes and firm size. Journal of Accounting and Economics, 5(C), 119–149.