Equity Valuation – The Navigator Company
Inês Cristina Borreicho Prates
Project submitted as partial requirement for the conferral of Master in Finance
Supervisor:
Prof. Paulo Viegas de Carvalho ISCTE Business School
Department of Finance
2
Abstract:
The Navigator Company is a paper and pulp company operating in an industry with no growth perspectives, but with few competitors. Despite this, the company does not want to be stagnated and it is trying to enter in other business areas. Based on this, the present valuation raises a high value, which is an important indicator to debt holders and investors.
The present project aims to perform a firm valuation analysis of The Navigator Company, using the Discounted Cash Flow method to reach the fair value for each
share on the December 30th of 2016. The main results show that the company’s shares
are priced below its fair value.
Keywords: Equity Valuation, Discounted Cash Flows
3
Índice
Tables’ list ... 5 Figures’ list ... 5 1. Introduction ... 6 2. Literature Review ... 82.1. Discounted Cash Flow Valuation ... 9
2.1.1. Firm valuation ... 9
2.1.2. Equity Valuation ... 11
2.2. Relative Valuation ... 13
2.3. Contingent Claim Valuation ... 15
3. Company presentation ... 16
3.1. Historical Review ... 16
3.2. Main Business Areas... 18
3.3. Products and Services ... 18
3.4. Markets ... 19
3.5. Competitors ... 19
3.6. Strategy ... 20
3.7. Stockholder Structure ... 21
3.8. Dividend payout policy ... 21
4. Industry Analysis ... 22 4.1. Paper Analysis ... 22 4.2. Pulp Analysis ... 24 4.3. Energy Analysis ... 26 4.4. Wood Analysis ... 28 5. SWOT Analysis ... 29 5.1. Strengths ... 29 5.2. Weaknesses ... 29 5.3. Opportunities ... 29 5.4. Threats... 30 6. Future Prospect ... 30
6.1. Income Statement Forecasts... 30
6.2. Balance Sheet Forecasts ... 31
6.2.1. Assets ... 31
6.2.2. Equity ... 32
6.2.3. Liabilities ... 33
4
7.1. WACC (Appendix 5) ... 34
7.2. The Firm Approach – Free Cash Flow for the Firm (Appendix 6) ... 35
7.3. Multiples Analysis ... 36
7.3.1. The Firm Approach (EV/EBITDA) ... 36
7.3.2. The Equity Approach (PER) ... 37
8. Conclusions ... 38
9. References ... 39
10. Appendix ... 41
10.1. Appendix 1 - Income statements ... 41
10.2. Appendix 2 – Balanced Sheets ... 42
10.3. Appendix 3 – Income Statements Forecasted... 43
10.4. Appendix 4 - Balance Sheets Forecasted ... 44
10.5. Appendix 5 – WACC ... 44
5
Tables’ list
Table 1: The Navigator Company’s capital……...………...………21
Table 2: The Navigator Company’s payed dividend…...………...….…...….………21
Table 3: Exports of UWF paper…….…….………...…………...….……….22
Table 4: CEPI pulp industry………….…….………...………...…………24
Table 5: CEPI Exports of Market Pulp to Other Regions…..……...………...…...24
Table 6: Production of renewable energy (GWh)…...………...27
Table 7: Forecasted WACC………...………...35
Table 8: FCFF Evolution…...………...35
Table 9: Multiples…...………..…………...36
Figures’ list
Figure 1: World Total Pulp Consumption by Region in 2014………...……….……….25Figure 2: Montlhy Evolution of PIX European Price – BHKP……….….……….……….26
6
1. Introduction
One of the key topics in finance is Equity Valuation. It is the foundation of many other subjects studied in the finance area. Equity Valuation is the process of estimating the intrinsic value of a security, with the purpose of supporting investors in the decision making process associated with the management of their financial asset portfolios.
This project presents an Equity Valuation of The Navigator Company, a Portuguese listed company. The company will be evaluated through major models for valuating, with the purpose of estimate a price target for each share and give a buy or sell recommendation. This decision will be based on the comparison between the market value and the price target of each share: If the price target is higher than the market value the recommendation will be buy, and if it is lower the recommendation will be sell.
The Navigator Company is one of the most relevant companies for the development of the Portuguese economy, representing 3% of the total exports of Portugal, and its turnover amounts to around 1% of GDP.
In 2015 the company initiated a strategic plan for internationalization and diversification, with the purpose of making the group a referenced multinational company, within 10 years. In 2016, the advancement of its strategic development plan was reflected in increased production capacity, production of a new range of “tissue” products, commencement of a facility construction in the US, and initiation of large-scale forest planting. In its communication to the market, the group also pointed to debt restructuring and the Net Debt / EBITDA debt ratio. In February 2016, the company announced a rebranding strategy, including a new name, “The Navigator Company”. This rebranding came to sustain the internationalization strategy.
This change in strategy of The Navigator Company was the main reason to develop a project about the company valuation. Although The Navigator Company has already been evaluated in other researches, the value of a company is non-static, and it is necessary to estimate its value in this phase of change.
The strategy of research methodology to develop this work will be based on the following organization: literature review, analysis of the company and industry, methodology, data analysis and conclusions.
7 The literature review will summarize the major models for company valuation, which will later be used in the methodology.
In order to define the assumptions that allow the projection of the company’s future results, we will analyze the external and internal context of The Navigator Company. This analysis will present the company, with a focus on its strategy, the stakeholder structure and its dividend policy. Besides, the analysis extends to the economic framework and the industries in which the company operates – pulp, paper and energy.
The methodology will be defined by choosing the most appropriate evaluation model regarding the characteristics of the company. After collected the data and set the assumptions, these will be introduced in the Microsoft Excel and used the model chosen to calculate the price target for each share.
In the project conclusions, the price target will be compared with the market value
of each share as of 30th December of 2016, and then made the recommendation of buy
8
2. Literature Review
To start, it is important to clarify that the value of a company is not the same as its price. Fernández (2002, pp.2) defines the price as a “quantity agreed between the seller and the buyer in the sale of a company”. On other hand, the value “is the defining dimension of measurement in a market economy”, as stated in Koller et al. (2010, pp.3).
Corporate valuation is the process of estimating the value of a company. It is an important tool in portfolio management, corporate finance and mergers and acquisitions process (Damodaran, 2002), and covers an extensive range of purposes. Fernández (2002) states that valuation of listed companies is used to: i) compare the intrinsic value with the market price and make a recommendation of buy, sell or hold de shares; ii) decide in which securities the portfolio should concentrate – the ones undervalued by the market; iii) compare companies.
However, the valuation is not an objective and static process. Despite the models used in valuation being quantitative, the inputs are based in assumptions, concerning the company characteristics and the environment. When there are changes in the company or in the environment, the value may change. Therefore, valuation is based in subjective inputs and, therefore, cannot be considered an exact science (Damodaran, 2002).
As company valuation is a subjective process which depends on the company and environment characteristics, there is no agreement on the existence of a single ideal model of valuation, and the valuation model is chosen based on its suitability in face of the characteristics and specificities of each company.
Even though there is no general agreement about the valuation methodology, there are three main methods used in the valuation of companies, which will be presented next: 1) Discounted Cash Flow, 2) Relative Valuation and 3) Contingent Claim Valuation.
9
(3) (1)
(2)
2.1. Discounted Cash Flow Valuation
The Discounted Cash Flow Valuation is based on the present value of expected future cash flows to be generated by the asset, discounted at a rate that reflects the risk of the estimated cash flows (Damodaran, 2002; Luehrman,1997). This value is computed through the following discounted cash flows formula:
where is the life of asset, the cash flow in period and is the discount rate, reflecting the riskiness of the estimated cash flows.
This valuation method emerged in the 1970’s (Luehrman, 1997), and is the most accepted and used in companies. It has been improved through the years, and nowadays there exist several discount cash flow methodologies.
Damodaran (2002) and Fernández (2007) categorize the discounted cash flow under two approaches: firm valuation and equity valuation. Damodaran (2002) considers that into firm valuation, there are two paths: Free Cash Flow to the Firm (FCFF) and Adjusted Present Value (APV). About equity valuation, the author considers the Free Cash Flow to Equity (FCFE) and the Dividend Discount Model (DDM).
2.1.1. Firm valuation
a) Free Cash Flow to the Firm (FCFF)
FCFF represents the cash flow that is available after expenses, taxes and changes in net working capital are deducted.
FCFF values the future expected cash flows to the firm, discounted at a Weighted
Average Cost of Capital (WACC) (Damodaran, 2002).
10 (4)
(5)
(6)
(7) where is the expected cash flow to firm in the period . It corresponds to the residual expected cash flows to the firm after deducting expenses, taxes and investments.
WACC is the minimum rate of return required by investors. It represents the cost of the different categories of financing used by the firm (including equity and debt), proportionately weighted.However, this is only suitable when there are a stable capital structure. The formula to compute WACC is the following:
where is the market value of firm’s debt, the market value of firm’s equity, the
cost of debt and is the cost of equity. b) Adjusted Present Value (APV)
APV values each claim of the company separately. In this valuation method, the firm is valued first as if it was just financed by equity. Then, the effect of debt is added by summing the Present Value (PV) of tax benefits and the expected bankruptcy costs (Damodaran, 2002).
Damodaran (2002) presents a three-step formula to compute the APV. It begins with a non-debt scenario and considers the value of the unleveraged enterprise. In this approach the expected free cash flow to the firm is discounted at the unlevered cost of equity, as in the following formula:
where is the free cash flow to the firm and is the unlevered cost of equity. It is possible to estimate the unlevered cost of equity by computing the unlevered beta of the firm:
11 (8) where is the unlevered beta of the firm, the levered equity beta of the firm, is the
tax rate for the firm and D/E the debt to equity ratio.
In the second step of this approach, the effect of debt will be added by summing the estimation of the expected tax benefit from a certain level of debt. The tax benefit depends on the tax rate of the firm and is discounted at the cost of debt.
The last step for APV model requires the calculation of the risk costs and the bankruptcy costs of the company, considering a certain level of debt. According to Damodaran, it is necessary to estimate the probability of bankruptcy and its indirect costs.
The main advantage of APV is that it allows to realize where the value is coming from, and it is useful, for example, to understand the impact of changing the capital structure of a company. However, its major flaw is that managers may ignore the expected bankruptcy costs leading to the conclusion that the value of the company increases as companies borrow money.
2.1.2. Equity Valuation
a) Dividend Discounted Model (DDM)
The DDM is a method of valuing a company's stock price based on the theory that its stock is worth the sum of all future dividend payments, discounted back to their present value. The idea is that if the value obtained from the DDM is higher than what the shares are currently trading at, then the stock is undervalued.
DDM is the oldest DCF valuation method. It was first developed by Williams (1983) and later improved by Gordon (1962), and is mostly known as the Gordon Model. This model considers that the value of equity corresponds to the discounted expected dividends, as expressed in the following formula:
12
(11) (9)
(10) Regarding the difficulty of predicting future dividends, the Gordon Model assumes
that the dividends grow at a constant rate. According to this author, the value of stock is computed by the following formula:
where is the constant growth rate.
The main limitation of this model is the volatility in the estimate process of future dividends. The dividends distribution is related with the company’s dividend payout policy and with its earnings, thus not in every case would be realistic assuming a constant growth. According to Damodaran (2002), this model is only suitable for mature companies with stable growth rates and well defined payout policies.
b) Free Cash Flow to Equity (FCFE)
Similarly to DDM, the FCFE values the company based on the dividends. However, the latter considers the potential dividends that could be paid, and not the actual paid dividends.
The FCFE represents the cash flow obtained after meeting the financial obligations and making the necessary investments with a view to continuation of the company's operating cycle:
The value of equity can be determinated by future expected cash flows to shareholders (after debt payments), discounted at a rate of return required by investors (Damodaran, 2002), as computed in the following formula:
where is the expected cash flow to equity in period and is the cost
13 (12) The discount rate used is the cost of equity, which represents the return on equity demanded by the shareholders.The most used model to estimate the cost of equity is the Capital Asset Pricing Model (CAPM):
Where is the risk-free rate, is the coefficient of systematic risk and is the expected return of the market.
2.2. Relative Valuation
A relative valuation is a method of estimating the value of an asset relative to a similar asset priced in the market. According Damodaran (2002, pp.18) “the value of an asset is derived from the pricing of comparable assets which are standardized through the use of common variable such as earnings, cash flow, book value, or revenues”.
In relative valuation, the value of the company is computed using multiples of comparable companies and of the industry. Comparable companies are companies whose operates in the same industry and with similar cash flow, risk and growth potential (Damodaran, 2002). Koller et al. (2005) states that comparable companies present similar growth potential and also Return On Invested Capital (ROIC), and that the selected multiples should be based on future events and not on historical performance.
Damodaran (2002) claims that this method is particularly useful when a large number of assets is being traded and the market has priced them properly. Simplicity is an advantage to take into account here, since this is an easy to calculate method of assessing value. However, the author warns that the comparable companies and the method are chosen by the evaluator, who can be manipulated and lead to biased results.
For Fernández (2002), a relative valuation should be used, but only in a second stage of the evaluation, to confirm the results of the valuation performed previously by another methodology.
There are two basic types of multiples, the ones using the enterprise approach and the ones using the equity approach. Within these two categories, there is a diversified range of multiples based in scaling variables, such as earnings, book value, revenues and industry specific variables.
14 (13)
(14) Fernández (2002) mentions a study by Morgan Stanley, which reports that the Price to Earnings Ratio (PER) and the Enterprise Value to Earnings Before Interest, Tax, Depreciation, and Amortization (EV / EBITDA) ratios are the most used to evaluate companies. These ratios will be presented next.
i) PER
This is a measure that relates a company’s stock price with its expected future earnings per-share. Due to its simplicity, it is one of the most used ratios to evaluate companies on relative valuation. This multiple is determined by:
where is the future expected growth rate.
As this ratio is directly related with the capital structure, a company that is fully financed by equity will present a higher PER than a company that is financed by debt. For that reason, it can be easily manipulated by managers, who can increase the ratio by replacing debt for equity (Koller et al., 2005).
ii) EV / EBITDA
This ratio is a measure which relates the total market value of the company with its earnings before interest, tax, depreciation, and amortization, and is expressed:
Koller et al. (2005) suggests that enterprise value multiples, as EV/EBITDA, can be more reliable than equity multiples as PER, since the change in capital structure does not affect the ratio, it is less vulnerable to changes and therefore less prompt to manipulation, unless a huge change in the capital structure affects the cost of capital.
Therefore, when used properly, multiples are robust tools that can provide useful information about relative value. This method will be used in the present work as a complement of Discounted Cash-Flow.
15
2.3.Contingent Claim Valuation
According Brennan (1979, pp.53), “Contingent Claim is an asset whose payoff depends upon the value of another underlying asset”. Damodaran (2002, pp.22) stated that “A contingent claim or option is a claim that pays off only under certain contingencies- if the value of the underlying asset exceeds a pre-specified value for a call option or is less than a specified value for a put option”.
A contingent claim (option), is basically a contract made between two parties that gives the buyer the right to buy (call option) or sell (put option) an underlying asset, at a previously agreed price (strike price), on or until a pre-determined date. So, for a call option, the underlying asset will only be traded when its value exceeds the strike price, and for a put option when the value of the underlying asset is lesser than the strike price.
The contingent claim valuation is a model based on the options pricing models. It is used to evaluate assets with options characteristics: whose value are contingent on another asset and the cash flows depends on the occurrence of a certain event (Damodaran, 2002).
This model originates from the Black Scholes Model, published in 1973 by Fischer Black and Myron Scholes, in "The Pricing of Options and Corporate Liabilities". The initial model assumes that options cannot be exercised before the pre-determinate date and ignore the payment of dividends.
In 1979, Cox et al proposed the Binomial Model to price options. This model uses a discrete-time variant of the price over time of the underlying asset.
The Contingent Claim Valuation is important to evaluate undeveloped assets in which the cash flow is uncertain, such as patents or natural reserves. However, it has two main limitations pointed by Damodaran (2002): i) When dealing with long-term options it is difficult to make assumptions about constant variance; and dividend yield and ii) When the underlying asset is not traded, the values cannot be directly extracted from the markets and the inputs have to be estimated.
Thus, when the underlying asset is not traded the value has more estimation error associated due to the assumptions made for many variables. It may lead to a highly complex process and to an unreliable final value, and for that reason this methodology will not be applied in the present work.
16
3. Company presentation
3.1.Historical ReviewThe Navigator Company is a Portuguese company listed in PSI20. Its main owner is Semapa, which acquired the company in 2004. The President is Francisco Mantero, while the CEO is Pedro Pereira.
The main core business of this company is the production and commercialization of paper and pulp (CAE 17110 and CAE 17120, what corresponds to the CAE 171), being a reference in this industry in Portugal and a huge competitor worldwide, and the leader in the segment of premium office paper with the Navigator brand.
The starting point was in 1957, when a team of technicians from Companhia Portuguesa e Celulose, made the Cacia factory, the first in the world to produce pulp from eucalyptus by the kraft process.
The Navigator Company has been growing since its establishment in 1975, when occurred an integration of several companies of pulp, paper and package.
In the beginning of the century there were two important steps which gave rise to The Navigator Company: the acquisitions of Papéis Inapa, in 2000, and Soporcel, in 2001.
In 2004, Semapa acquires the majority of The Navigator Company’s capital. With this new cycle, the company consolidates its leading position in international markets, reinforced in 2006 with the announcement of the construction of a new paper facility in the Setúbal Industrial Complex. In 2009, the second paper facility was inaugurated in the Setúbal Industrial Complex. With this investment, The Navigator Company has become the European leader in the production of uncoated printing and writing paper (UWF)
The company also made an investment in the production of renewable energy and a reduction in the consumption of fossil fuels. An example of this is the significant investments made in 2009 and 2010: two biomass thermoelectric facilities (Cacia and Setúbal), a combined cycle facility (Setúbal) and a steam turbogenerator (Figueira da Foz). This capability puts The Navigator Company as the largest national producer of electricity from forest biomass.
17 The beginning of 2015 was marked by the new strategic plan, called New Cycle, a project that defines the strategy for the next 10 years and that establishes the pillars of the new growth phase, in Portugal and in the World.
With this new strategy, the company aims to develop new businesses and geographies in order to become a multinational reference within 10 years. This strategy is also supported by a low level of debt, with the restructuring of the Net Debt / EBITDA ratio.
Therefore, with its new development strategy, The Navigator Company aims to grow based on two aspects: consolidation of projects currently in course and entry into new business areas.
About the projects currently in course, the company has the status of a world leader in the premium segment of office paper with the Navigator brand, producer world of fine print and non-print papers coated and still a world producer of bleached pulp f eucalyptus.
In turn, to entry into new business areas, investments were made. In August 2015, the company initiated the construction of a pellet plant in the United States, South Carolina, which was complete in the third quarter of 2016. This is the first industrial unit outside Portugal. In addition, and on a production basis based on Portugal, the company entered in the Tissue paper business, so in March 2015 the Group announced its Tissue segment through the acquisition of the Sector AMS-BR Star Paper, S.A. - located in Vila Velha de Ródão. Also in 2015, it inaugurated the Viveiro do Luá, in Mozambique, the largest nursery of clonal plants in Africa, which will allow the local creation of Eucalyptus to feed the development of an integrated forestry production project.
Actually the company has an important impact in the Portuguese economy, with a turnover of 1,6 billion euros, representing 1% of the Portuguese GDP and 3% of total exported goods (to 123 countries), and employing 2660 workers directly. Furthermore, The Navigator Company has contributed to the Portuguese energy sector with the production of 5% of its total consumption.
The Navigator Company is the European leader in the production of eucalyptus pulp (BEKP) and fifth worldwide, and also is European lead of UWF paper sixth worldwide.
18
3.2. Main Business Areas
The Navigator Company activity can be divided in three main areas:
a) Industrial: It includes the production and sale of paper, pulp and electricity (due renewable energy sources), with production facilities in Cacia, Figueira da Foz and Setúbal.
b) Nurseries: This area comprises the production and sale of ornamental plants through its subsidiary Viveiros Aliança, S.A., where 64% is sold to the market and 36% is used internally. The production is divided between three units: Espirra (Pegões), Caniceira (Tramagal) and Ferreiras (Penamacor). c) Investigation: It is done by the company’s research institute (RAIZ) which
helps the forestry and paper industries to be more competitive, through research, technological support and specialist training. This program is made in collaboration with three universities: the University of Coimbra, the University of Aveiro and the Higher Institute of Agronomy.
3.3. Products and Services
The Navigator Company is globally known by its paper premium, Navigator. However, the company has other products and services in other industries.
Firstly, the group is focused on its own brands, with a sales strategy that offers a portfolio of brands with distinctive value propositions, reaching out different consumer segments. The company’s brand portfolio divides into office paper brands and brands for the printing industry: Navigator is the world's best-selling premium paper, with consumers in more than 110 countries; Discovery combines high performance with a strong environmental concerning and is sold in more than 60 countries; Pioneer is a premium paper officer and is associated with the Portuguese institution “Laço”, in order to stabilize a strong relation with the business woman; Target, Inacopia, Soporset, and Explorer are other important brands of the company.
In the Tissue segment, the company operates in two market segments: Domestic (At Home), which represents 75% of the total market, and Away From Home. The sales
19 strategy focuses mainly on the Iberian market, but the company is emerging in other markets with high potential, especially in Europe and Africa.
This stake is a reflection of the company’s expansion plan, which now includes a business segment in strong growth and in which it will progressively introduce the business model that characterizes it.
Secondly, the pulp (BEKP from eucalypt- stand-alone) is an important manufacture to the printing and writing paper, décor, tissue and special papers segment. Indeed, the company’s pulp is an obvious choice to the leaders’ manufacturers, in result of the unique printing quality, particularly in terms of sheet formation, combined with high standards of dimensional stability, opacity and whiteness.
There are also other two important segments: the electric energy, which is produced in the Figueira da Foz and Setúbal complexes, it is used internally and sold to the National Power Grid; and the forest, which products are wood (used internally and sold to external clients) and cork (just sold).
3.4. Markets
In 2015 The Navigator Company had an annual turnover of over € 1.6 billion, where its main markets are Europe (74%), Middle East (10%) and America (13%), with North America in evidence (6%) and it is focused on premium products and own brands.
The Navigator Company exports more than 95% of its UWF paper production and
about 31% of its Tissue paper production. The company exports to 123 countries in the
5 continents, being one of the largest Portuguese exporters with 3% of the total exported goods in Portugal in 2015.
3.5. Competitors
According to the Bank of Portugal, in Portugal the industry in which The Navigator Company operates is constituted by 5 big companies in the paper production (CAE 1712), and a total of 30, in 2015. With the same trend, the CAE 171, which includes the paper and pulp production, has 11 big companies and a total of 38.
20 Even with some companies in the business, this industry is characterized by an oligopoly, since a small number of companies has the most of the market quote. The biggest Portuguese competitor is Altri, which was founded in 2005 and it is currently a European reference producer in the pulp industry and also a listed company in PSI20. The company has three pulp mills - Celbi, Caima and Celtejo - with a nominal annual capacity of 900 thousand tons. Altri exports more than 90% of its pulp to the European market, and in 2015 registered a turnover of 664,8 million euros.
Globally, the competition in paper and pulp markets has been increasing, which may have a significant impact in prices and, consequently, in the group profitability. The global markets are more competitive, with the countries from the south hemisphere, which have lower production costs, winning a lot of share in the markets. The most important competitors are UPM-Kymmene Corporation and Storaenso, both European companies, with market valuations of almost 10 billion euros and 8 billion, respectively. Both exported to all the world, and operated in the same business areas as The Navigator Company, namely pulp and paper, energy and forest.
3.6. Strategy
The Navigator Company operates in the bleached eucalyptus pulp production sector (BEKP) and uncoated fine paper printing and writing (UWF), taking the place as European leader in these segments. However, the company is also responsible for operating a vast forest area in Portugal (120 hundred hectares) and is the largest national producer of energy from forest biomass. This initiative is the result of a strategy with a high degree of vertical integration in the operational chain. The company adopts a strategy of vertical integration upstream as the progression of control occurs in a rearward direction of the production chain, allowing it to increase the quality of its outputs, and therefore, the company takes the place as European leader in high quality office paper production.
Relatively to its offer, the company has a diversification strategy, with four main areas: forest, energy, pulp, and paper and pulp integrated (UWF). With the negative perspectives of UWF growth, The Navigator Company recently entered in a new business: tissue paper, with the acquisition of the main tissue paper producer in the Iberian Peninsula. Within the main business area, The Navigator Company adopts a
21 product specialization strategy (UWF), since the company specializes in a high-quality product and has the ability to customize it to fit the specific needs of different segments, such as the office paper. This strategy allows the company to focus on its reputation for quality in brand development, being a leader in that segment.
3.7.Stockholder Structure
The Navigator Company is listed in the PSI20, the Portuguese stock market. On the 30th of December of 2016, the closing price of the company’s shares was 3.265 euros.
The company has share capital represented by 717,500,000 nominative shares.
As show in Table 1, the major stockholders are Semapa SGPS SA, and its subsidiary Seinpar Investments B.V., together with a share of 69.35% of capital.
Table 1: The Navigator Company’s capital
Source: The Navigator Company’s website (data from 17th
January of 2017)
3.8.Dividend payout policy
The Navigator Company’s dividend payout policy is based on its profit and reserves. The table below shows the dividends per share paid in the last three years until 2015.
Table 2: The Navigator Company’s payed dividend
Source: The Navigator Company’s annual reports
2013 2014 2015
Dividends 0.22 0.21 0.2985
Reserves Payment 0.058 0.223 0.1199
22
4. Industry Analysis
4.1.Paper Analysis
The main activity of The Navigator Company is the fine paper production uncoated printing and writing (UWF). According to the company, the consumption of this product is highly correlated with the pace of economic activity and employment levels.
Recent data from the European Association of Graphic Paper Producers point to the continuation of a downward trend in the European market, the main destination of exports of the group (70% of paper sales), which decreased 26,72% in last 10 years, in line with the low levels of European economic growth. As a result, European producers of UWF have directed their exports outside Europe, which resulted in a 67,45% increase in export volume recorded since 2007, as shown in the table below:
Table 3:Exports of UWF paper (1000 tonnes)
Period Deliveries to Europe Deliveries Outside Europe
2007 7950 725 2008 7623 743 2009 6548 785 2010 6893 956 2011 6616 1044 2012 no data no data 2013 6212 1129 2014 6265 1206 2015 6188 1268 2016 5826 1214 2007-2016 % -26,72% 67,45%
Source: European Association of Graphic Paper Producers
According to The Navigator Company’s 2016 annual report, the last year showed a decrease of 3.8% in the consumption of UWF in Europe. In addition, it is estimated a 18% increase in imports, with particular attention for the doubling of imports from Asia. Despite the increases in prices at the beginning of the year, the main reference index of the UWF price (PIX A4 - Copy B) practically did not change and registered a very slight increase of 0.3%. However, the price of economic products decreased significantly due to the increase in Asian imports.
In the USA, there was a decrease of 3.7% (in 2015 it was -0.4%) in the consumption of UWF papers, with a significant reduction of imports around 12%. Also, the main
23
price index of the sector (Risi 20lb A4) fell by 1.9% in relation to the same period of the
previous year. In spite of this context, in 2016 the company reached the maximum value
of paper sold, an increase of more than 2% compared to 2015. In addition to an increase of 2.4% in its sales in Europe, this growth was also supported by the continued geographical expansion of sales, particularly in the Middle East and Africa. This growth in countries outside Europe largely resulted in an increase in the volume of sales of standard products, which has changed the relative weight of these products in the overall volume of paper sales, with a negative impact on the average sales price. Despite the deterioration in the mix of markets and products sold, the Group maintains its position as a leader in the premium segment, with a share of more than 50% in the European market. As a result, the Group continues to operate, as usual, at 100% of installed capacity, recording the best year ever in order entry.
According to The Navigator Company’s 2015 annual report, the Tissue paper market represents around 6.4 million tons in Western Europe, with Germany and the United Kingdom leading the list of countries with the highest consumption per capita. The evolution of the European market over the last 10 years has been marked by sustained annual growth around 1.3%. The most representative product categories are toilet paper and kitchen rolls / towels, transverse across Western Europe, while napkins have higher usage rates in Southern Europe and facial tissues in Central-Northern Europe.
In terms of results, the Tissue business unit recorded sales of approximately 55.8 million euros, which represents an increase around 9% over the previous year (2014), with 52% of this value being generated by the Domestic channel. Recent data from
company’s report (2016) showed a positive evolution of consumption in west of Europe
during the year 2016 of about 2.2% over the same period last year.
Within this framework the group presented a 29.7% accumulated growth in the volume of Tissue sales. This growth occurred in particular in the Away from Home segment, in Portugal and Spain. The Portuguese market reached 4.5 million euros in sales, which represents 65% of the total volume. Spain, with an approximate value of 2,2 million euros, represents practically the remainder of sales. Total tissue sales in 2016 were 67.5 million euros, representing growth of about 21%.
24
4.2.Pulp Analysis
In 2015, the pulp sales represented 9% of the company’s business volume, of which 95% represents exports to European market.
As in the paper, the pulp consumption is also related to the global economic activity. The economic crisis that hit the European market, the major market, had a clear
impact on this industry. The table below from the Confederation of European Paper
Industries (CEPI) shows a significant decrease of 14.37% in the pulp consumption
between 2005 and 2014. In 2015 is observed a small increase of 0.3%, but the growth
is still very low and the macroeconomic outlook for the Eurozone is still cautious. Table 4: CEPI pulp industry
Source: CEPI
In relation to pulp exports, according to CEPI's Table 5, the market for which CEPI's most exports is the Asian market, with 65.8% of total pulp exports.
Table 5: CEPI Exports of Market Pulp to Other Regions
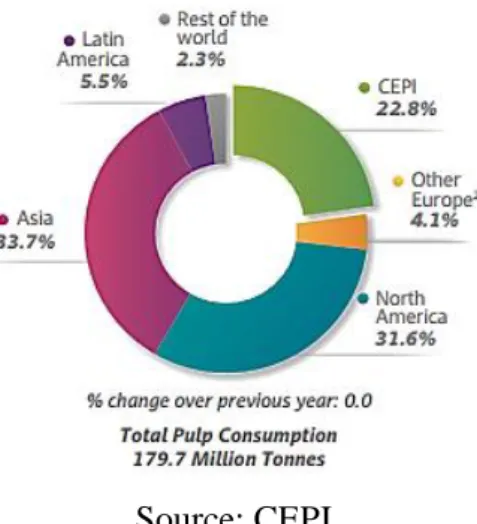
25 The figure belows show the distribution of total pulp consumption worldwide by region, in 2014. Globally, the markets with higher consumption are the Asian market (33.7%) and the North American (32.6%).
Figure 1: World Total Pulp Consumption by Region in 2014
Source: CEPI
According to the company, in 2015 the pulp market benefited from a number of factors, namely the slowdown in the launch of new capacities, the reduction of supply due to several production stops occurred throughout the year, and the strong demand of the Asian market.
According to data from the company's 2015 annual report, the BEKP pulp business maintained a positive performance with a significant improvement in prices compared to the same period of 2014. The dollar price index developed favourably, with an average value of USD 784 / ton, compared to USD 746 / ton in the same period, as is
represented in the graphic below. Due to the exchange rate effect, this trend represented
a sharp rise in the price in Euros, with the PIX BHKP benchmark reached an average of € 705 / ton, an increase of 25.6% over the same period last year. This evolution of pulp price allowed a 23.2% increase in sales value, despite a 1.7% decrease in the quantity sold.
26 Figure 2: Monthly Evolution of PIX European Price - BHKP
Source: The Navigator Company annual report (2015)
4.3.Energy Analysis
In the most recent years, the company has been investing in the energy sector. Currently, The Navigator Company has an installed capacity of 2.5 TWh per year, responsible for about 4.8% of the total national energy production and 50% of the energy created from biomass, being the country's largest producer of electricity from biomass. The current volume of energy production allows the group to be self-sufficient in its productive activities and sell the surplus production to the national electricity grid. In 2015, the energy segment already represented 12% of the total value of sales.
In Portugal there has been a growing commitment to renewable energy production. Between 2015 and 2008, the Entidade Reguladora dos Serviços Energéticos (regulator of energy services) had registered an increase of 74% in the quantity (GWh) of renewable energy produced (Table 6).
27
Table 6:Production of renewable energy (GWh)
Source: Entidade Reguladora dos Serviços Energéticos
In addition, the Memorandum of Understanding between the Portuguese Government, the IMF, the ECB and the EU, in May 2011, established a new tariff regime which contemplates a reduction in the selling price. This reduction in the tariff
regime poses a risk to the profitability of renewable energy producers, which includes
The Navigator Company, since, according to the table below from Entidade Reguladora
dos Serviços Energéticos, the new selling price does not have capacity to cover production costs.
The table below represents the annual evolution of the production price for renewable energy compared to the reference price in the regulated market.
Figure 3: Evolution of the price in special regime vs price in regulated market
Source: Entidade Reguladora dos Serviços Energéticos
Renewable Energy 2008-2015 % 2015 2014 2013 2012 2011 2010 2009 2008 Biogas 378% 282,4 265,2 238,3 202,3 152,3 92,2 70,6 59,1 Biomass 401% 732,7 712,6 683,9 741,8 687,8 611,9 304,9 146,2 Cogerneration 46% 4.389,6 4.739,9 5.269,2 4.847,2 4.768,4 4.480,4 3.590,4 3.010,8 Renewable Cogeneration 9% 1.662,1 1.847,0 1.861,4 1.788,9 1.810,8 1.733,9 1.542,6 1.519,4 Wind Energy 99% 11.333,4 11.809,8 11.708,8 10.014,5 9.128,1 9.031,9 7.480,1 5.690,8 Photovoltaic 1346% 482,9 361,7 256,4 221,1 188,7 167,0 139,5 33,4 Hydro Energy 23% 810,9 1.507,7 1.324,7 619,3 1.016,8 1.374,1 816,2 658,6 Urban Solid Waste 6% 467,2 381,0 470,5 394,6 485,6 454,3 457,6 441,4 TOTAL 74% 20.161,3 21.624,9 21.813,2 18.829,7 18.238,5 17.945,7 14.401,9 11.559,7
28
4.4.Wood Analysis
Relatively to the Wood, it is the main raw material consumed in the production of pulp and paper. Its huge production cannot meet the company's needs. For this reason, The Navigator Company currently imports wood from Spain, Africa and South America, which implies an increase in costs and greater exposure to the volatility of the price of wood in the international market.
The woodchips market in Europe, and in particular in the Iberian Peninsula, has experienced major developments in recent years, and the quantities handled worldwide have grown. Given the insufficient supply of wood in the Iberian market, the company resorted to importing woodchips from the South American market.
The self-supply of wood for the production of BEKP pulp is less than 20% of the company’s needs, according to The Navigator Company 2015 annual report. Therefore, the company needs to purchase timber from the Iberian and non-Iberian markets. The supply of wood, in particular eucalyptus, is subject to price and exchange variations and to difficulties in supplying raw materials which could have a significant impact on the production costs of BEKP pulp producers. In addition, the volatility of the prices of logistical transport of wood to the factories, which varies with oil prices and sea freight, is more important (in terms of imports).
Risk associated with increased demand for raw materials (wood), due to increased capacity on the part of competitors, lead to an increased wood purchase prices and a consequent increase in production costs.
29
5. SWOT Analysis
Based on the company presentation and industry analysis made before, it will be performed a SWOT analysis. This analysis aims to better understand the difficulties and advantages of The Navigator Company, and the economic environment.
5.1.Strengths
Vertically integrated industrial model that produces enough energy and folder to sustain production of paper and protect the company's volatility international price of pulp.
Competitive advantage in cost production by consumption energy at market prices and sale of energy production network national special regime subsidized.
Currently exporting to 123 countries, the company ensures a geographic diversification of sales.
Comfortable financial situation with high level of liquidity that allows the financing of new investments or possible increases in remuneration to shareholders.
5.2.Weaknesses
Dependence on the European market as main sales destination, in which fell in
paper consumption over the past years.
Lack of wood supply on the national market to cover the needs productive, forcing the importation of timber from other regions (eg. South America) subjecting the thus volatility of market prices and the higher logistics costs.
5.3.Opportunities
The new tariff rates implemented by the government over the plastic bags turns
the sellers more attracted to invest in paper bags;
An increasing trend in the renewable energy;
The global population growth, since they will consume more tissue paper, an essential good for everyone.
30
5.4.Threats
Growth of new technologies intended to replace the traditional use the role as a communication vehicle, which translates into the demand falls and price of this product.
Loss of return in the paper and pulp segment business over the past years due to changes in tariff rates of the sale of renewable energy.
An increasing trend in the recycled paper.
6. Future Prospect
6.1.Income Statement Forecasts
The Income Statement allows us to measure the company’s financial performance over the years 2013 to 2020. The first three years are based on The Navigator Company public data. The year 2016 is estimated, despite of the company having published already some of the main results. Between 2016 and 2020, the values are forecasted, based on some assumptions, which will be presented in the paragraphs below.
Since 2013, the Revenues were increasing, what is a good indicator for the company. The growth rate was 5.16% in 2015 and 2016, a value used for the next years. In spite of the expected growth of the paper/forest product industry being negative, it was chosen the higher observed growth in the last 3 years, since The Navigator Company is doing some strategic changes and investing in new business areas, for example with the AMS acquisition.
Naturally, the Variable Expenses will change in the same rate of revenues. The Fixed Expenses and Losses and Interest Income will vary with the respective year inflation, since it is assumed that the cash flow exceedances will support future investments and they will not be invested.
On other hand, the Depreciation and Amortization Charges will evolve assuming that its weigh on revenues will remain the same as of 2016.
31 The Interest Expense will be estimated by the product of the cost of capital (WACC) and the value of Interest-Bearing Liabilities (presented in Balance Sheet), while the Other Interest Income, which had irregular variations, will be assumed as zero.
The Income Taxes will be the income tax rate of 21% retrieved from the EBT. The Minority Interests will be -0.310% of the Net Income, the ratio verified in 2016.
The Legal Reverses will be 5% of the Group Net Income, since it do not reached 20% of the Common Stock , i.e., 143,500,000€. The remaining 95% goes to Retained Earnings, without the Dividends (the Dividend Pay-out is the difference between 1 and the Plow Back Ratio).
The Plow Back Ratio will decrease at the revenues growth rate, since it has been decreasing in the last years and it is not sustainable forever. The inflation rates for the forecasted years are those estimated by the International Monetary Fund.
6.2.Balance Sheet Forecasts
The balance sheet is known as the statement of financial condition and it is an important tool to observe the business health. Its forecast is one of the main statements for business financials plan and it is used, for example, to help to identify whether the working capital needs will grow and how those needs will be funded. The balance sheet forecast is used too by investors, to decide whether to invest or not and at what price, taking into account the capital structure, for example.
6.2.1. Assets
Non-current
Tangible Fixed Assets (TFA), Other Fixed Assets (OFA) and Biological Assets (BA) grow in the same growth rate of the revenues that is at 5.16%. The TFA represents 54.36% (in 2015) of the total assets and has increased in the last years, which is a good indicator since this is mainly a capital intensive business, where the assets are essential to support the maintenance or growth of sales/revenues. The OFA and BA, which
32 integrates all forests and biological elements (like trees), suffered small oscillations in the last years
The values of Goodwill, Financial Assets Available to Sell and Investments in Associated will remain the same value of 2016, since they are not directly related to the operating activity and they did not suffer any changes in, at least, two years between 2013 and 2016. Deferred Tax Assets decrease at the Compounded Annual Growth Rate between 2013 and 2016, which is 35.96%, since they correspond to taxes paid/carried that are being recognized.
Current
About the current assets, it is observable that inventories are an important part of the total (8.75%), affecting inclusively the working capital. This was expectable, because of the type of the industry. On other hand, the company exports for many countries what makes it need higher inventories. It is likely that sales terms allow some payment period for clients, which could present some risky in case of any client going into bankruptcy. Like some Non-Current Assets, Inventories, Operational Accounts Receivable and Cash and Other Equivalent (COE) will increase at the revenues growth rate too, since they are directly related to The Navigator Company activity. It is important to refer that to ensure the equality between the Total Assets and the sum of the Total Equity and Total Liabilities, by the end, the difference will be including in the COE. Since the item Deferrals and Other Operating Accounts Receivable had an insignificant variation in the last years and its impact on the total assets was minimum (approximately 2%), it is assumed that they will remain constant. It should be noted that The Navigator Company do not have Marketable Securities until 2016, so is assumed that this trend will continue in the future.
6.2.2. Equity
In 2016 the Common Stock at Par Value decreased from 767,500,000€ to 717,500,000€, and will remain the same until 2020, and the Own Stocks will stabilize in the value of 2016 (given by the company). Just Value Reserves and Exchange
33 Conversion Reserve are assumed value zero in the future, since both items have almost no meaning in the total equity and they have an irregular variation. The value of Legal Reserve will grow each year by 5% of Current Year Group Net Income (GNI) of the preceding year, up to reach 20% of the Common Stock, i.e., until 143,500,000€. The remained 95% of the GNI goes to Retained Earnings of the previous year, without the Dividends. Finally, the Minority Interests are calculated with the Minority Interest to the Total Group Equity ratio of 2016, as 0.18%.
6.2.3. Liabilities
Non-Current
As well as in Assets, Deferred Tax Assets decrease at the CAGR between 2013 and 2016, which is 15.07%. Since the Obligations with Pensions, Provisions and Other Liabilities are not significant to the Total Liabilities, it is assumed that they will remain constant in the future. The Non-Current Interest-Bearing Liabilities will vary with the investment in fixed assets, assuming that some part of invested capital in fixed assets is from debt capital providers.
Current
Accounts Payables and Government will grow in the same growth rate of the revenues, which is 5.16%, assuming that the agreed payments term will be similar to the past. The Current Interest-Bearing Liabilities will vary with the Working Capital Needs.
34 (15) (16) (17)
7. Valuation
7.1.WACC (Appendix 5)In order to calculate the weight average cost of capital (WACC), it is necessary to compute:
It is important to understand that the values of D (Debt – Interest-Bearing Liabilities) and E (Equity – Market Value of the Equity) used in WACC are the intentional target of capital structure that the company pretends to attain in the near future. To simplify the WACC calculation, it is assumed a constant ratio D/E, based on values of 2016. In reality, the assumptions used in the Income Statement and Balance Sheet result in small changes in the structure of capital. The value of debt is from the balance sheet and the equity value is the 2015 share price multiplied by the company number of shares.
Next, the cost of debt ( ) can be splited in two parts: . In this case, was considered that the risk-free interest rate corresponds to the AAA rated governments bonds from the Euro in 2016. It is assumed that the will increase until the average of the last 5 years (1.017%), in 2020.
The credit risk value was seen in Damodaran’s website. For companies with rating BB, taking into account long-term debt rating of The Navigator Company, this value is 3%.
About the taxes value, since 2015, and so far, until 2020, the tax rate used was the one given by Portugal government, i.e., 21%.
To estimate the cost of equity, it is used the Capital Asset Pricing Model (CAPM):
The Beta ( ) is a measure of systematic risk. It is levered and must be calculated for the estimated capital structure. Firstly, it is necessary to calculate the levered beta ( ) of
35
The Market Return ( ) is calculated through the risk premium of 6.81% (the average of the Western Europe) that is added to .
Table 7: WACC
7.2.The Firm Approach – Free Cash Flow for the Firm (Appendix 6)
Cash Flow to the Firm is the cash available to pay to the investors after the company pays its costs of doing the business.
Table 8: Forecasted FCFF
Across the previous table, it is possible to see that the FCFF is positive which means that the company has raised more than enough revenue to cover its costs. Indeed, the FCFF decreases approximately 38%, from 2016 to 2017. The main reason is the tax benefits that increases from -3.47% in 2015 to 21% in 2016, penalizing violently the FCFF, since less money will be retained by the company. However, in 2018 The Navigator Company reduces again the FCFF, which is mainly explained by the increase in fixed assets investment (this growth is preparing the growth of the company for the next years). After 2018, the Cash Flow will increase in a reasonable percentage taking account the assumptions expressed before. The invested capital will also stabilize, what contributes for stabilizing the growth of FCFF. Furthermore, the required cost of capital by providers is different from year to year, that changes the growth in enterprise value too.
2016 2017 2018 2019 2020
WACC 6,25% 6,07% 6,26% 6,44% 6,62%
2015 (Ano 0) 2016 2017 2018 2019 2020 2021
FCFF= Free Cash Flow for the Firm 268 558 122,10 € 165 902 349,60 € 148 266 144,38 € 160 694 705,51 € 173 842 760,90 € 214 864 860,53 €
Discount Rate = WACC 6,25% 6,07% 6,26% 6,44% 6,62% 6,62%
Perpetuity Growth Rate 3,00%
EV= Enterprise Value = PV of Future FCFF 5 124 586 242,52 € 5 176 115 376,53 € 5 341 103 549,13 € 5 526 912 271,04 € 5 721 829 924,70 € 5 926 406 548,97 € Non Operating Assets 72 657 585,00 €
Firm Value 5 197 243 827,52 €
Debt 831 334 836,00 €
Equity Value 4 365 908 991,52 € # shares 717 500 000,00 €
36 By discounting all the future expected FCFF to the WACC discount rate we obtained an enterprise value of more than 5 billion euros. By taking out the debt amount, this value (now equity value) is 4,365,908,992 euros, giving a 5.67 euros per share value (after the dividend distribution in this year).
As previously mentioned, the market price for the company’s shares was 3.265 euros, which is a below its fair value. Thus, we can conclude that the company is undervalued and the recommendation given to the shareholders is to buy The Navigator Company’s shares.
7.3.Multiples Analysis
The multiples valuation was used to support the Discounted Cash Flows method. For the comparison between The Navigator Company and its competitors, we selected European paper and pulp producers (Altri, UPM and Storaenso), and we followed the firm and equity approach.
Table 9: Multiples
Company P/E (PER) EV/EBITDA
Industry 15,68 8,17
Altri 10,30 7,47
The Navigator Company 11,01 7,52
Storaenso 16,74 9,17
UPM-Kimmene 13,56 7,07
7.3.1. The Firm Approach (EV/EBITDA)
When these multiples are under the average of the sector, it means that companies are undervalued, so they must defend a position with a quite possibility to growth, showing to the interested people that it is an excellent investment.
The sector EV/EBITDA is 8.17 in 2016. Comparing The Navigator Company multiple 7.52 with the sector, the conclusion is that the company is undervalued and it is possible an increase in EV, as well as in sales. Storaenso has a higher ratio, higher than the average of sector.
37 7.3.2. The Equity Approach (PER)
PER ratio is a measure of a company's stock price relative to its expected future earnings, which investors compare a firm's PER ratio with respect to its peers in the industry. A high P/E ratio implies that the stock is richly valued. This could be due to the market's expectation of higher earnings and/or higher earnings growth rate for the company. Analyzing The Navigator Company it had a lower PER than the average in the sector, which will be a good purchase, since investors consider buying on firms with a low PER ratio relative to its peers. Storaenso has the highest values for PER, which indicates that this is the company with more expected earnings growth.
As a main conclusion The Navigator Company is in line with its competitors when the methodology of multiples is applied. The Navigator Company reveals a good investment and is important to refer that Storaenso is a good consistent multiples for an investment too by multiples.
38
8. Conclusions
The Navigator Company is one of the strongest Portuguese brands in the world, with a leading position in the international pulp and paper market. In order to react to a stagnated industry, threatened by the new technologies, the company introduced a new strategic plan, which is based on the entrance into new businesses areas and geographies.
The main purpose of this project is to estimate the fair value of The Navigator Company, in order to give the shareholders a recommendation of buy or sell the company’s shares.
Different theoretical models were studied and it is clear that there is no agreement on the existence of a single ideal model of valuation, once it is chosen based on its suitability in face of the characteristics and specificities of each company. For this valuation was decided to use the Discounted Cash Flows model, for being the most appropriate and accepted model for academics and companies, complemented with the Multiples methodology.
Although that in the first years of the new strategic plan the FCFF decreases, due to the increase in fixed assets investment, after 2018 the invested capital will stabilize and the revenues will increase significantly, which contributes for stabilizing the growth of FCFF. Therefore we can conclude that the new strategies are increasing the value of the company.
According to the Discounted Cash Flows methodology, The Navigator Company’s shares are priced below its fair value, which means that the company is undervalued and leads to a buy recommendation. The multiples methodology shows that the company is in line with its competitors, which also leads to a buy recommendation.
39
9. References
Altri – Financial information, Available at:
http://www.altri.pt/pt/investors/reports-and-presentations/2016, accessed in 10th March
Black, F. & Scholes, M. (1973), The pricing of options and corporate liabilities, Journal of Financial Economics, Vol. 81, No. 3 (May - Jun., 1973), pp. 637-654
Brennan, M.J. (1979), The pricing of contingent claims in discrete time models, The Journal of Finance, Vol. 34, No. 1, pp. 53-68
CEPI (2015).Key statistics: European pulp and paper industry. Brussels, Confederation
of European Paper Industries, Available at:
http://www.cepi.org/system/files/public/documents/publications/statistics/2016/FI NALKeyStatistics2015web.pdf
Banco de Portugal – Quadros do sector, Available at:
www.bportugal.pt/ptPT/ServicosaoPublico/CentraldeBalancos/Paginas/Quadrosda EmpresaedoSetor.aspx
Cox, J.C., Ross, S.A. & Rubinstein, M., (1979), Option pricing: A simplified approach, Journal of Financial Economics, 7, pp. 229-263
Damodaran, A. (2002), Investment valuation: Tools and techniques for determining the value of any asset, 2nd Ed., New Jersey: John Wiley & Sons, Inc.
Damodaran, A. (2006), Valuation approaches and metrics: A survey of the theory and Evidence, Stern School of Business. Available at:
http://people.stern.nyu.edu/adamodar/pdfiles/papers/valuesurvey.pdf, accessed in 12th November
Damodaran, A. (2008), What is the risk-free rate? A search for the basic building block, Stern School of Business. Available at:
http://people.stern.nyu.edu/adamodar/pdfiles/papers/riskfreerate.pdf, accessed in 17th April
Entidade Reguladora dos Serviços Energéticos,
Information on production under special regime (PRE) Continental Portugal.
Available at:
http://www.erse.pt/pt/desempenhoambiental/prodregesp/2015/Paginas/2015.aspx, Accessed in 1st March
Fernández, P. (2002), Valuation Methods and Shareholder Value Creation, Academic Press
Fernández, P. (2007), Company valuation methods: The most common errors in valuations, IESE Working Paper Nº 449, IESE Business School
Google Finance – Stocks information. Available at:
40 WZnaCcyQswHH4arYDQ, accessed in 12th March
Gordon, M., (1962), The Investment, Financing, and Valuation of the Corporation, Irwin Series of Economics
Koller, T., Goedhart, M., & Wessels, D. (2005), The right role for multiples in valuation, The McKinsey Quarterly
Koller, T., Goedhart, M., & Wessels, D. (2010), Valuation: Measuring and managing the value of companies, 5th Ed., New Jersey: John Wiley & Sons, Inc
Luehrman, T.A., (1997). What’s it worth? A General manager’s guide to valuation, Harvard Business Review
Stora – Financial information, Available at: http://www.storaenso.com/, accessed in 10th March
The Navigator Company – Company information, Available at:
http://www.thenavigatorcompany.com, accessed in 20th Abril
The Navigator Company – Financial information, Available at:
http://www.thenavigatorcompany.com/Investidores/Informacao-Financeira, accessed in 25th April
UPM-Kymmene Corporation – Financial information, Available at;
http://www.upmpaper.com/en/Pages/default.aspx, accessed in 10th March
Williams, J., (1983), The Theory of Investment Value, Harvard Business Press, Cambridge