http://dx.doi.org/10.21707/gs.v11.n02a04
D
etermination anD application of Drought vulnerability inDexin the semi
-
ariD region ofb
razilEliamin Eldan QuEiroz rosEndo1*, Hamilcar José almEida FilguEira2, Tarciso cabralda silva2, barTolomEu israEldE souza3, marcElo HEnriQuEsda silva Júnior4
1Discente do Programa de Pós-Graduação em Engenharia Civil e Ambiental, Doutorado, Universidade Federal da Paraíba 2Docente do Departamento de Engenharia Civil e Ambiental, Centro de Tecnologia, Universidade Federal da Paraíba 3Docente do Departamento de Geociências, Centro de Ciências Exatas e da Natureza, Universidade Federal da Paraíba 4Discente do Programa de Pós-Graduação em Desenvolvimento e Meio Ambiente, Mestrado, Universidade Federal da Paraíba *Autor para correspondência: [email protected]
Recebido em 29 de novembro de 2016. Aceito em 22 de junho de 2017. Publicado em 29 de julho de 2017.
abstract - The Northeast of Brazil has been affected, since the beginning of its colonization, by the droughts. However,
most of the studies on drought phenomenon usually deal with physical aspects, such as its severity, extension, and periodicity, neglecting other aspects of the region such as its social, economic, cultural, and production characteristics. Considering how important it is to analyze these factors to gethering studies that investigate the vulnerabilities in the Brazilian semiarid region, this study aimed to evaluate the vulnerability to drought in the municipalities of Picuí, Sumé, and Sousa in Paraíba State, Northeast of Brazil. It was performedby adapting the vulnerability index proposed by Bhattacharya and Dass (2007), which calculates the exposure, sensitivity and adaptive capability factors based on data of the municipalities, mainly those from 2010. The results obtained in this study shows that the municipality of Picuí had the highest exposure (index of 0.390), and the worst performance in sensitivity (index of 0.251). Regarding the indicator of Adaptive Capability, Sumé stood out in a negative way, with an index of 0.315. In general terms, Picuí presented the highest Vulnerability Index (0.346), followed by Sumé (0.297) and Sousa (0.287). The Vulnerability Index proved to be an adequate instrument to develop a holistic study on risk management of social and environmental disasters, and it could be used by managers and decision makers to develop public policies and to create preparation and coexistence local plans to mitigate the problems caused by the drought.
KeyworDs: Risk ManageMent; DRought; inDicatoRs.
DeterminaçãoeaplicaçãoDeínDicesDevulnerabiliDaDeàsecanaregiãosemi-áriDaDo brasil
resumo - O Nordeste Brasileiro tem sido afetado, desde a sua colonização, pelos efeitos da seca. Entretanto, a maioria dos
estudos sobre a seca normalmente analisam somente os aspectos físicos, como severidade, extensão e periodicidade, porém negligenciam outros aspectos da região, como o social, econômico, cultural e caraterísticas produtivas. Considerando a importância de se analisar estes fatores em conjunto em estudos que investiguem as vulnerabilidades na região semiárida brasileira, este estudo visou avaliar a vulnerabilidade à seca nos municípios de Picuí, Sousa e Sumé no estado da Paraíba. Isso foi feito por meio de uma adaptação do índice de vulnerabilidade de Bhattacharya e Dass (2007), que calcula os fatores de exposição, sensibilidade e capacidade adaptativa com base nos dados dos municípios, principalmente do ano de 2010. Os resultados obtidos mostraram que o município de Picuí teve a maior exposição, com índice de 0,390 e o pior desempenho em sensibilidade, com índice de 0,251. Quanto ao indicador de Capacidade Adaptativa, Sumé se destacou de forma negativa, com índice de 0,315. Em termos gerais, Picuí apresentou o maior Índice de Vulnerabilidade (0,346), seguido por Sumé (0,297) e Sousa (0,287). O Índice de Vulnerabilidade demonstrou ser um bom instrumento
para desenvolver um estudo holístico sobre o gerenciamento de riscos de desastres sociais e ambientaise que poderia ser utilizado por gestores e tomadores de decisão para desenvolver políticas públicas e criar planos locais de preparação e coexistência para mitigação dos problemas causados pela seca.
palavras-chave: gestãoDe Risco; seca; inDicaDoRes.
DeterminaciónyaplicaciónDelosínDicesDevulnerabiliDaDalasequíaenlaregiónsemiáriDaDe brasil
resumen - El nordeste de Brasil ha sido afectado desde su colonización por los efectos de la sequía. Sin embargo,
la mayoría de los estudios sobre la sequía normalmente investigan solamente los aspectos físicos como la gravedad, la extensión y la frecuencia, ignorando otros aspectos de la región, tales como las características sociales, económicas, culturales y productivas. Teniendo encuenta la importancia de analizar estos factores en conjunto en los estudios acerca de la vulnerabilidad en la región semiárida de Brasil, el objetivo de este estudio fue evaluar la vulnerabilidad a la sequía en los municipios de Picuí, Sousa y Sumé en el estado de Paraíba, Brasil. Esto se hizo a través de una adaptación del índice de vulnerabilidad de Bhattacharya y Dass (2007), el cual calcula los factores de exposición, sensibilidad y capacidad de adaptación basado en los datos de los municipios, principalmente los de 2010. Los resultados mostraron la ciudad de Picuí presentó la mayor exposición (índice de 0,390), y el peor desempeño en la sensibilidad (índice de 0.251) índice. Encuanto al indicador de la capacidad de adaptación, Sumé se destacó negativamente, con índice de 0.315. En general, Picuí presentó el mayor índice de vulnerabilidad (0.346), seguido de Sumé (0.297) y Sousa (0.287). El índice de vulnerabilidad ha demostrado ser unbuen instrumento para el desarrollo de unestudio integral sobre la gestión de riesgos de desastres sociales y ambientales, y podría ser utilizado por los gestores y tomadores de decisiones para el desarrollo de políticas públicas y crear planes locales de preparación y convivencia para la mitigación de los problemas causados por la sequía.
palabrasclave: gestiónDe Riesgos; sequía; inDicaDoRes.
i
ntroDuctionThe history of occupation, colonization and permanence of men in the semi-arid region of the Brazilian northeast is intrinsically related to the occurrence of periodic droughts. According to Feitosa (2010), the lack of infrastructure to coexist with the dry weather has been the main source of risks in this part of the country.
The prolonged droughts, associated with ENSO events (El Niño-Southern Oscillation) and the insufficient prevention and preparation by the government during the last three decades, negatively affected a large portion of the inhabitants of that region.
Many studies have aimed to quantify and qualify the drought focusing in physical and climatic aspects. However, only few studies have discussed such phenomena as social-environmental events, and even fewer studies have attempted to quantify and qualify all these aspects together. An efficient quantification and qualification of both physical-climatic and social-environmental aspects must be based in reliable indicators and parameters. An index must be understood as a parameter or value derived from parameters that represent and provide information about the state of a phenomenon (Organization for Economic Cooperation and Development, 1993; 1994).
For vulnerability assessment, indicator approach is the most commonly adopted method for quantifying as it combines socio-economic and biophysical factors contributing to vulnerability to climate change (Hebb and Mortsch, 2007). Vulnerability index can facilitate decision making and can be useful for setting targets and priorities as it provides a single-value, easy to comprehend estimate, and facilitates easy and meaningful
monitoring and evaluation of progress (Briguglio, 2003).
Therefore, indicators are being increasingly recognized as useful tools for policy making and public communication in conveying information on performance in diverse fields such as environment, economy, society or technological development (KEI, 2005).
This study used an approach based on social-environmental indicators as a solution for the information neglected when environmental problems are studied only under the physical focus. Therefore, the definition of vulnerability adopted was the one proposed by the IPCC (Mccarthy et al., 2001), which states that the vulnerability of an entity is characterized by a combination of the exposure, sensitivity, and capability of adaptation. The exposure represents the amplitude and the frequency of the event experimented by the entities; sensitivity is configured as the probable result of the impact of the event over the entities, which might have as consequence the reduction of social well-being, due to the incapacity to absorb the energy emanated from the event by the area and individuals living in the region; and the adaptive capacity represents the extension that the entity may have in modifying the impacts of the event, reducing its vulnerability.
Kumar et al. (2015) uses the same combination of the exposure, sensitivity, and capability of adaptationtodeterminethescore of vulnerability index, and thereby the level of vulnerability of a particular districtin India.
The present work brings as contribution: the development of indicators and the study of the current condition of social-environmental vulnerability of three municipalities in the state of Paraíba, all situated in the Brazilian semi-arid zone.This was possible through the use of drought vulnerability indicators whichare able to cover the threecharacterizingaspects of the vulnerability. These indicators are divided into three groups: Indicators of Exposure (droughts characteristics, population exposed to the phenomenon and exposure of activities), Indicators of Sensitivity (social-economic sensitivity, technologies sensitivity and activities sensitivity), and Indicators of Adaptive Capacities (human capacity, governance and means of life), whose combination allows the identification of weaknesses and strengths of each studied area.
The three municipalities chosen for this study were Picuí, Sousa, and Sumé, which are inserted in the delimitation of the Brazilian semi-arid, according to the Ministry of National Integration (BRASIL, 2005). Another important factor for the choice of these three municipalities was that they present distinct characteristics in the microclimatic, social, cultural and economic contexts. This study also aimed at obtaininga general panorama of the regions that suffer the most with drought and use them as pilot-areas for studying, and characterizing the vulnerabilities of these regions.
The indicators adopted in the present study will allow the investigation to identify which areas of risk management are more deficient, and give subsidies for a more effective management. Moreover, this study has the potential to encourage projects and/or programs of management, which may be compatible with the local specificities, including the culture of each population, enabling the improvement of methods for coexisting with the drought and its adversities.
The aspects of the social vulnerabilities are essential for an effective management of the risk related to the threats originated from the drought phenomenon, since it highlights the importance of the social-environmental investigations of municipalities that are exposed to this phenomenon.
Recently, some authors have been addressing to this fact. For instance, Babaei (2012) conducted a study to evaluate drought vulnerability in the central zone of Iran, which used a series of indicators and attributes of
decision making as a method to develop an evaluative framework of priorities related to the drought, based in a set of preferences, criteria and indicators.Salvati et al. (2009) developed an index of drought vulnerability and desertification in part of Italy that takes into account information such as climate change, land use, vegetable coverage, soil and population characteristics.
Figure 1 -Location of the study area, Paraíba, Brazil
A more complex strategy was adopted by Antwi-Agyei (2012), who used scale models and multi-method indicators to assess drought vulnerability of agricultural production in national and regional scope. This was done through comparative methodology among 10 regions of Ghana, sub-Saharan Africa. The study illustrated a quantitative and qualitative analyses of national and regional data to evaluate differences in the sensitivity to drought in food production systems, allowing the formulation of several target-districts, exploring vulnerability systems and climate change in local scope.
The results from Antwi-Agyei (2012) showed that drought vulnerability of agricultural production in Ghana have distinguishable geographic and social-economic patterns, where the districts located at North, West and high regions of Eastarethemost vulnerable. In part, this happened because these regions have lower adaptation capacity due to low social-economic development and economies based in rainfed agriculture.
Another interesting approach was developedin the State of Nevada, United States. Safi (2012) investigated the influence of the vulnerability in climate changes according to physical vulnerability, sensitivity and farmers’ adaptation capacity. Additional contribution was made studying the relations among climate changes, local beliefs, risk perception, political orientations, and socio-economic characteristics.
A similar approach to Safi’s (2012) was used by Bhattacharya and Dass (2007) as a part of alargestudy developed and sponsored by the European Union, known as Project BASIC. They evaluated the drought vulnerability of the states in India and the types of actions which were takento minimize vulnerabilities of this population.
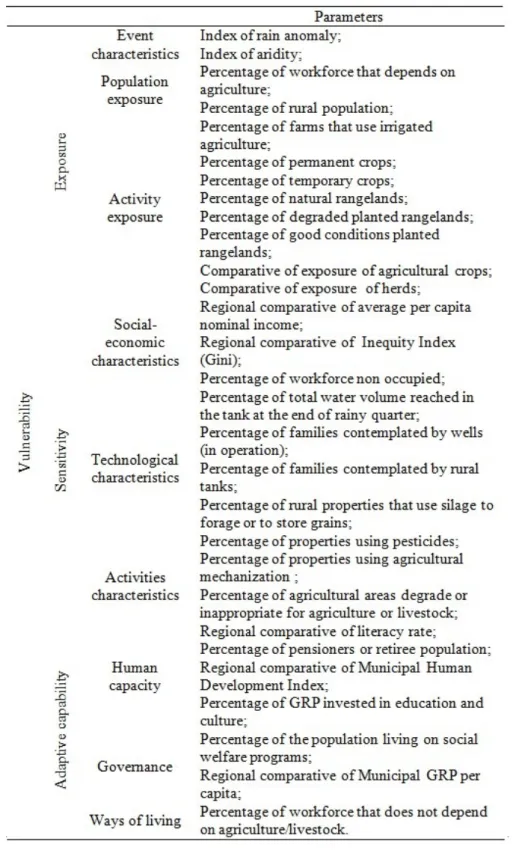
This study was based in the work of Bhattacharya and Dass (2007) in 16 states of India in a comparative study between the biennium of 1990-1991 and of 1999-2000. Considering the existent differences in ethnography, culture and public management between Brazil and India, an adaptation of the original methodology was used. In Table 1 is possible to observe the proposed adaptation for the Brazilian semi-arid, based on the methodology from Bhattacharya and Dass (2007).
Table 1- Indicators of vulnerability to drought
Use of means and normalization of data
The study of Bhattacharya and Dass (2007) adopted the procedure of simple aggregation of normalized indicators between zero and one, using geometric and/or arithmetic means, with the aim of analysing the different normalized indicators, thus seeking as final product, an index of drought vulnerability which can be compared to other areas of study.
The process of simple aggregation of values is widely used in the development of several indices of human development of the United Nations Programme for Development (UNPD) and is a tool of great importance for the evaluation of several types of management.
Differently from the original methodology of Bhattacharya and Dass (2007), besides the simple arithmetic and geometric means, weighted means were also used for some indicators in this study. Considering the complexity of the analysed data, the weighted means provided more reliability for the accounted data.
Geometric means and arithmetic weighted means were used in the computation of the indicators of Exposure, Sensitivity and Adaptive Capacity. In order to compute the Vulnerability Index, a simple arithmetic mean of the three indicators (Exposure, Sensitivity and Adaptive Capacity) was used.
The weighted means were based on weights developed through bibliographic research, which indicated the specific need of water to the maintenance of herd or a specific type of crop practiced in the area of study.
Normalization of indicators
Drawing on literature appropriate indicators were chosen keeping in view of their relevance to the study area and availability of data. Since indicators are measured in different units, theytherefore were subjected to normalization so as to bring their values within the comparable range between 0 and 1.
Regarding the normalization of the indicators, expressed in percentage, were divided by 100, turning them into normalized values ranging between 0 and 1.
For dimensionless data, such as the Index of Rain Anomaly, Index of Aridity and Income Index, it was necessary to establish a threshold that allowed to define what was represented as 0 (zero), being this the lowest possible score, and what was represented as 1 (one), the highest score possible. The equation 1 was applied to normalize the data from the three studied municipalities.
(Equation 1) Where:
Norm Ind = normalized indicator X Ind = indicator raw result Xmin = raw indicator lowest value Xmax = raw indicator highest value
Exposure
Considering the characteristics of the drought event, the city of Sumé was the most exposed due to its elevated Index of Aridity and Index of Rain Anomaly. It also obtained the highest index of dependence on agriculture, what reflects the great exposure of its economy to the drought, since more than one third (35.34%) of its Economically Active Population depends directly or indirectly on agriculture.
The economy of Picuí also showed a great dependence on agriculture (33.35%), characterizing Picuí as the city with the largest rural population among the three studied cities, which is a preoccupying situation.
Regarding the exposure of agricultural activities in the three municipalities, the data provided by the Brazilian Institute of Geography and Statistics (IBGE) referring to the Agricultural Census seems to underestimate the percentage data of the degraded planted pasture, because through field work carried out in the three municipalities it was observed in locus that this type of pasture areas, located in agriculture establishments, are more expressive than the reported numbers of the IBGE data.
Another item that raised suspicion concerning the data from the mentioned institute was the Area of Irrigated Agriculture of the Establishments, since Sousa is a large producer of food input, fact that was also underestimated in the census.
In relation to the exposure of temporary crops in the municipalities, which weight attributions were taken based on the work of Hoekstra and Hung (2002), it was observed thatSumé, once again, had the worst performance, being the area with the largest exposure.
However, all the three municipalities had similar results at the exposure of the type of herd. Sumé was the least exposed, certainly due to a greater number of goats and sheep since these animals can survive with less food and water than cattle, and are more resistant to the occurrence of droughts.
Sensitivity
In relation to social-economic characteristics, Sousa stood out with the best average nominal monthly income per capita, but had the worst result in the Inequity Index (Gini), which implies that Sousa has an elevated raw income, but it is not well distributed among the population, factor that increases sensitivity of the poorer population to the droughts.
Concerning the percentage of unemployment among the economically active population (EAP), the municipality with the highest index was Picuí, with about 40% of its EAP unemployed.
In the topic relative to the technological characteristics of the rural environment, Picuí had the worst result concerningthe index of percentage of the reservoirs whose volume reached, at the end of the rainy quarter of 2010, more than half of its capacity filled (53%). However, the percentage of families assisted by rural cisterns in the same municipality was the one with the highest rate and the only municipality that presented an updated list oftheproperties which are assistedby this service, showing the location and the person in charge for each cistern. This instrument has been used for a better management of the needs, through the operationalization of the municipality in management areas.
It was observed through this research that the three municipalities did not have a regular management of the large scale reservoirs and cisterns, neither information about how and where underground water is being
extracted.
With the aim ofaddressingthis issue, the choice was to use the references from the Municipal Diagnosis of CPRM (2005a, 2005b, 2005c) as data source regarding the amount of wells in operation. Picuí had the lowest number of operating wells as a function of the number of families living in the municipality. A possible explanation for that is its geological (mostly crystalline rocks, with little permeability) and pedological formation (shallow soils, with little capacity of retaining water).
Still in the matter of cisterns management (maintenance and installation of new ones), it was observed some inconsistency and absence of data provided from agents of these programmes (Programme One Million Cisterns – P1MC and Programme One Land Two Waters – P1+2, from the Federal Government), because until data collection it was not possible to find any institution that unified all the information about the programmes, confirming the fact that only theoneresponsible to manage each program would have access to the complete set of information.
Regarding the percentage of areas that are degraded or inappropriate for agriculture and livestock, it was used data provided by the IBGE census of 2006. In this case, the municipality that presented the largest area was Picuí, with 8.57%.
Nevertheless, it is important to point out that the data referring to degraded or inappropriate areas in the municipalities are being underestimated by IBGE, especially considering the observations from fieldwork during the execution of this study. Therefore, we believe that the data provided does not reflect the reality experienced in these three municipalities, and the figures should be more expressive than those presented in the Agriculture Census of 2006, although we did not carry out calculations for this scenario.
Adaptive capacity
Regarding the literacy rate, the municipality with the lowest rate was Sumé, with 69.73% of its population being literate. When comparing the three municipalities or its micro-region, the best HDI was found in Sousa. Sousa also had the highest rate of pensioners and retirees among its population.
However, regarding the investment of the GRP in education and culture, Sousa had the lowest rate of all the studied municipalities. In 2010, the municipality invested only 2.07% in education, while Picuí invested 8.3% and Sumé 4.72%.
In the topic of social welfare programmes sponsored by the Ministry of Social Development (PBF + BPC + RMV), 19.63% of Sousa’s population was assisted by some type of social welfare benefit, which is the highest value among the three municipalities. Picuí only presented 16.16% rate of its population being assisted by any of these programmes.
Regarding the municipal GRP per capita, once again Sousa presented the highest value (R$1 8,910.38)
either in comparison with the three municipalities or with its micro-region. This municipality had almost twice as much as the GRP per capita of Picuí, which was R$ 4,638.84, while Sumé had the value of R$ 4,907.23.
Another factor that contributed forthe best adaptive capacity presented by the municipality of Sousa, when in comparison with the other municipalities,is that 84.59% of its population do not depend directly from agriculture and livestock,therefore, its economy is also based in other areas, such as services and industry.Sumé had the highest rate of dependency on agriculture and/or livestock, figuring with 35.24% of its population. 1 R$ is the Brazilian national currency named Real.
Vulnerability
Concerning the results of the Index of Vulnerability to Drought, it is convenient to mention that they were obtained by computing a simple arithmetic mean of the indices of Exposure, Sensitivity and Adaptive Capacity of each municipalities, as mentioned previously.
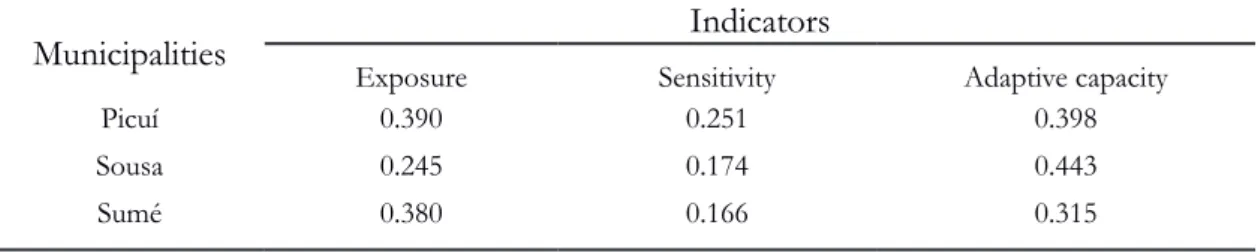
It is also important to highlight that higher scores in the indices of Exposure and Sensitivity indicate that the municipalities are respectively more exposed and sensitive to a drought event, thus, it is a negative factor. On the other hand, a high score in the Adaptive Capacity index indicates that the municipalities might go through less suffering in the event of a drought, or, even in case of damages, they are prone to be less severe than in the municipalities with lower Adaptive Capacity.The following values were obtained as final scores of the indicators.
Analysing Table 2 it is possible to observe that the municipalities of Picuí and Sumé had a similar exposure index, putting both of them in a situation of eminent risk of disaster. Sousa obtained the best index because of its largereconomy and agriculture development, but it was still not satisfactory.
Table 2 - Indicators of Exposure, Sensitivity and Adaptive Capacity of the municipalities
Municipalities Indicators
Exposure Sensitivity Adaptive capacity
Picuí 0.390 0.251 0.398
Sousa 0.245 0.174 0.443
Sumé 0.380 0.166 0.315
Regarding the Sensitivity indices obtained, Sumé was considered the least sensitive, mainly due to its lower percentage of unemployed workforce during the year considered for this study (2010) and to the underestimation of degraded or inappropriate areas for agriculture and livestock provided by the IBGE. Picuí, once again, was the municipality with the worst results, being considered the most sensitive of all three municipalities.
In contrast with the good results from the Sensitivity Index, the municipality of Sumé presented the worst result of Adaptive Capacity as a consequence of its low literacy rate and Municipal HDI. Sousa stood out in this dimension as a result of its economic power, which polarizes the whole micro-region and other municipalities in neighbouring states such as Ceará and Pernambuco. The mentioned results are illustrated through Figure 2.
c
onclusionsThe adapted methodology of Bhattacharya and Dass (2007) applied in this research can be used in any region susceptible to drought, regardless of its geographic extension, as itwas evidenced through the present study.
In short terms, based on the data collected and the results of the Exposure Index, the municipality under the greatest exposure was Picuí.
The use of the Exposure Indicators highlighted the fact that populations which are mostly dependent of agriculture and exploration of the natural resources are more exposed to prolonged droughts, what might lead to greater social and environmental damages suffered by this portion of the population.
In this case, the failure of agriculture in drought seasons increases the probability to overuse natural resources by the farmers, in order to obtain their livelihood, implicating even more their sustainability. As an example of this issue, there is the extraction of woody material from the caatinga vegetation, in these and in other municipalities of Brazilian semi-arid, for personal use or for selling purposes, and, in many cases, it results in a scenario vulnerable to desertification.
The results obtained by the use of the Sensitivity Index demonstrated once again that the most sensitive municipality to the climate event of drought was Picuí. Considering the collected data, this area stood out negatively as the one with the highest unemployment rates, the lowest volume of the reservoirs at the end of the rainy quarter of 2010, and as the region with the largest degraded or inappropriate areas for agriculture and livestock.
The Indicator of Sensitivity seemed to be an useful tool, capable to easily analyze characteristics from the population and its activitieswhenfacing the eminence of drought; allowing to infer from these results whether the way of production is adequate or not for the semi-arid climate and if such practices are adapted to the region.
Concerning the Indicators of Adaptive Capacity, it was concluded that the city with the largest and best infrastructure and material goods should be the least affected by the event of drought and the one that would suffer the least from the difficulties caused by the drought. However, an important factor that must be taken into consideration is how the income is distributed and how it may directly influence the social catastrophe and the social problems caused bythedrought. Therefore, Sousa stood out in its adaptive capacity, especially due to its higher GRP (Gross Regional Product) per capita, larger capital generated, and commercial flow. On the other hand, the municipality with the worst performance was Sumé.
As a final result, the Vulnerability Index was computedputting the municipality of Picuí as the most vulnerable, followed closely by Sumé, and the least vulnerable being the municipality of Sousa.
Finally, we point out that the Index of Vulnerability with its three facets of study (Exposure, Sensitivity and Adaptive Capacity), showed itself as a valuable alternative in the study of risk management of social-environmental disasters related to drought, allowing to analyse different thematic areas, geographic spaces and populations being affected, becoming a holistic and objective tool in the study of social-environmental vulnerabilities.
r
eferencesAntwi-Agyei P, et al., 2012. Mapping the vulnerability of crop production to drought in Ghana using rainfall, yield and socioeconomic data. Applied Geography Volume 32, Issue 2, Pages 324–334.
Babaei H, Araghinejad S, Hoorfar, A. 2012. Developing a new method for spatial assessment of drought vulnerability (case study: Zayandeh-Rood river basin in Iran). IN: Water and Environment Journal. doi: 10.1111/j.1747-6593.2012.00326.
Bhattacharya S, e Dass A. 2007. Vulnerability to drought, cyclones and floods in India. Winrock International, India.
BRASIL. 2005. Nova delimitação do Semi-árido brasileiro. Brasília, DF.
Briguglio L. 2003. The vulnerability index and small island developing states: areview of conceptual
and methodological issues. In: AIMS Regional Preparatory Meeting on the Ten Year Review of the Barbados
ProgrammeofAction, Praia, Cape Verde.
CPRM. 2005a. Serviço Geológico do Brasil - Projeto cadastro de fontes de abastecimento por água subterrânea.
Diagnóstico do município de Picuí, estado da Paraíba. Recife: CPRM/PRODEEM, 2005a.
CPRM. 2005b. Serviço Geológico do Brasil - Projeto cadastro de fontes de abastecimento por água subterrânea.
Diagnóstico do município de Sousa, estado da Paraíba. Recife: CPRM/PRODEEM,
CPRM. 2005c. Serviço Geológico do Brasil - Projeto cadastro de fontes de abastecimento por água subterrânea.
Diagnóstico do município de Sumé, estado da Paraíba. Recife: CPRM/PRODEEM.
Feitosa P H C. et al. 2010.Estudo comparativo das vulnerabilidades no cenário seca/desertificação em municípios do semiárido brasileiro e norte de Portugal. IN:Revista verde de agroecologia e desenvolvimento
sustentável. Mossoró – RN – Brasil, V.5, N.3, P. 01 – 09.
Hebb A, Mortsch L, 2007. Floods: Mapping Vulnerability in the Upper Thames Watershed Under a
Changing Climate. Project Report XI. University ofWaterloo1–53.
Hoekstra AY, Hung PQ. 2002.Virtual Water Trade: A quantification of virtual water flows between nations
in relation to international crop trade. Value of water research report series, Netherland: UNESCO/IHE,
n. 11, p. 25-47.
Kei. 2005. State of the Art Report on Simulation and Indicators, Knowledge Economy Indicators, Work
Package 7, https://www.uni-trier.de/fileadmin/fb4/projekte/SurveyStatisticsNet/KEI-WP7-D7.1.pdf. Kumara S, Raizada A, Biswas H, Srinivas S, Mondal B. 2016. Application of indicators for identifying climate change vulnerableareas in semi-arid regions of India. Ecological Indicators,70, 507–517.
and Vulnerability. Contribution of Working Group II to the Third Assessment Report of the Intergovernmental Panel on Climate Change, Cambridge University Press, Cambridge, UK, x+1032 pp.
OECD. 1993. Draft Synthesis Report, Group on State of the environment Workshops on Indicators for
Use in Environmental Performance Reviews. Doc ENV/EPOC/SE. Organisation for Economic
Co-operation and Development, Paris,.
OECD. 1994. Environmental indicators: OECD. Core Set. Organisation for Economic Co-operation and Development, Paris.
Rosendo, EEQ. 2014. Desenvolvimento de indicadores de vulnerabilidade à seca na região semiárida
brasileira. Dissertação (Mestrado), UFPB/CT. João Pessoa, Paraíba, Brasil.
Safi AS, Smith WJ, Liu Z. 2012. Rural Nevada and climate change: vulnerability, beliefs, and risk perception.
Risk Analysis, Vol. 32, No. 6, 2012. DOI: 10.1111/j.1539-6924.2012.01836.x
Salvati L, Zitti M, Ceccarelli T, Perini L. 2009. Developing a synthetic index of land vulnerability to drought and desertification. Geographical Research, volume 47, Issue3, pages 280–291, September 2009, DOI: 10.1111/j.1745-5871.2009.00590.x.
Silva RMA. 2006. Entre o combate a seca e a convivência com o semi-árido: transições paradigmáticas
e sustentabilidade do desenvolvimento. (Tese de Doutorado). Brasília: UNB, 298p.