Analysis of the Private Equity performance in Brazil
Ricardo Jorge Vitorino Soares
Dissertation submitted as requirement for the Degree of Master in Finance
Supervisor:
Prof. Rui Pedro Ferreira, ISCTE Business School, Department of Finance
i
Acknowledgements
This project could not have been accomplished without the support and encouragement of several persons, to whom I am truly indebted. Therefore, I would like to express my deepest gratitude.
To my mother, father, sister and grandpas who have always supported me, even when I didn‘t passed the time I wished with them;
To Alexandra Ribeiro, for being an inspiration and for supported me every time I needed, without you it would be impossible;
To all my friends that were patient whenever I couldn‘t be with them;
To Capital Criativo for given me the opportunity to work in this area.
Finally I would like to express my gratitude to my supervisor Prof. Rui Ferreira, a true mentor within this project that always was available to help.
―The best way to predict the future is to create it‖
ii
Abstract
The goal of this paper is to evaluate the performance of private equity activity in Brazil, taking into account the difficult times that the worldwide activity is being through.
Considering that Brazil is currently one of the major emerging economies in the world (Enert&Young, 2011) and the fact of private equity‘s activity in this country registered a positive evolution, this study allowed to evaluate not only the evolution of the funds that are implemented in the Brazilian market, but also permitted to understand the main factors that had lead it to this growth. Through this work was also possible to compare the returns of private equity funds with the evolution of the principal stock exchange in Brazil (IBOVESPA), in order to determine the level of implicit risk in both alternatives.
The results suggest that private equity performance was slightly higher than IBOVESPA, and even more important the results also showed that private equity funds, in average, were less risky than the stock exchange.
Therefore, according to the results, the analysis undertaken proved to be an important tool to unveil the new reality of private equity in the Brazil, so it could be used by any investor who has this market as a target.
Keywords: Private Equity, Performance, IPO, IBOVESPA JEL: G24, G32
iii
Sumário
O presente trabalho teve como objectivo avaliar o desempenho da actividade de capital de risco no Brasil num período bastante conturbado da actividade a nível mundial.
Visto que o Brasil é actualmente uma das principais economias emergentes no mundo, e que a actividade de capital de risco neste país tem evoluído de uma forma bastante positiva (Enest&Young, 2011) o estudo desenvolvido permitiu avaliar não só a evolução dos fundos que estão implementados no mercado Brasileiro, mas também entender os principais factores que conduziram a este crescimento. Através deste trabalho foi também possível comparar o crescimento do capital de risco com a evolução do principal índice bolsista no Brasil (IBOVESPA) com o intuito de se poder parametrizar o nível de risco face às duas alternativas estudadas.
Os resultados obtidos sugerem que a actividade de capital de risco no Brasil apresentou um comportamento ligeiramente superior ao do IBOVESPA, sendo que a principal nota de destaque prende-se com o facto de os fundos de capital de risco, em média, terem apresentado um risco bastante inferior ao do mercado bolsista.
Assim sendo o presente estudo revela-se importante para que esta nova realidade do capital de risco no mercado Brasileiro possa ser conhecida em toda a sua plenitude por todos os investidores que tenham interesse no mercado Brasileiro.
Palavras-Chave: Capital de Risco, Performance, IPO, IBOVESPA JEL: G24, G32
iv
Executive Summary
The history of private equity in Brazil only began in the past few years, due to a past marked by high interest rates that drove away the investor‘s interest for private equity investments (Central Bank of Brazil, 2011). Until 2005 the activity in Brazil was residual, and it could have remained like that if the policies that draw the world‘s attention to Brazil won‘t take the desired effect. Hopefully for Brazil and for every investor targeting this country, these policies make Brazil one of the most promising economies in the world and after 2005 private equity activity started to rise and it seems, according to the report of private equity‘s activity done by Ernest&Young (2011) that it will not stop so soon.
The improvement of the economic conditions in Brazil attracted a lot of foreign investors to the country and private equity played, and is still playing, a very important role since it was the target of these investors, through the constitution of large number of private equity funds.
When the financial crisis arrived in 2008, every single economy in the world was affected, as well as the global private equity activity. The Brazilian industry was no exception but almost two years late and when the majority of the world‘s private equity industry is facing problems to recover, in which the European industry is registering a very soft recover (EVCA, newsletter 2011) Brazil is demonstrating to be one of the most stable industries in the world by achieving in 2010 values far above the registered in 2009.
Due to the increasing interest for investments in Brazil, this thesis tried to understand the evolution of private equity by analyzing the returns achieved for the industry between 2007 and 2010. Since in private equity the real returns can only be calculate when the funds are totally disinvested (Cendrowski, Martin, Petro and Wadecki, 2008), it was used the variation of the net asset values as an indicator for the fund‘s performance.
The returns presented by the Brazilian private equity‘s industry were better than it could be expected and comparing them to the evolution of the main stock exchange in Brazil (IBOVESPA) was a crucial key in this analysis. Through that it was possible to
v conclude that in average private equity funds did better than the stock exchange, but this comparison also showed that private equity funds have mainly presented better results than IBOVESPA when it was deeply submerged in negative returns.
The analysis to the PE industry in Brazil also demonstrated that the 10 biggest funds (represent 36% of the total assets under management according to the data provided by CVM) are a very restrict group and also very different from the rest which the average net asset value is 64 Millions of r$. The top 10 funds in terms of returns in 2010 are composed mainly by funds bellow 310 Millions of r$, which represents that not only the biggest funds are growing, but also that the Brazilian industry in whole is growing.
The rise of private equity in Brazil was driven by many factors, but there are some that took a vital importance. First the fragmented industry that was the incentive for private equity funds, since this is a huge opportunity of acting in the capitalization and expansion of a market that is composed for so many SME (Sousa, 2010). According to the Enert&Young (2011) not less important is the low level of infrastructure that the country has, it‘s necessary to improve it a lot and another opportunity appears. The organization of the 2014 World Cup and the Olympic Games in 2016 is the guarantee that Brazil will continue to invest in order to improve it.
After a decade of reforms Brazil was able to growth and became a stable economy, which was the most important factor in the boom of PE. This economic growth of Brazil permitted the harmonization of the inflation and interest rates to similar values of the main world economies. Obviously the decrease of interest and inflation rates drove the investors‘ attention to other alternatives, and then private equity emerged as one of the most promising alternatives.
Index
1. Introduction ... 1
2. Theoretical Framework ... 3
Private Equity Definition ... 3
Investment Stages ... 4
Investment types ... 6
Exit Options ... 9
Fund Structure ... 11
3. Historical Overview ... 15
4. Private Equity – Global retrospective ... 19
Fundraising ... 22
Investments ... 24
Disinvestment ... 27
5. Private equity in Brazil – Empirical Analysis ... 31
Methodology ... 31
Brazilian Private Equity funds ... 33
Funds performance ... 34
Private equity returns Vs IBOVESPA ... 36
Funds ranking ... 38
Main reasons behind Private Equity boom in Brazil ... 40
Successful cases of Private Equity deals in Brazil ... 42
6. Conclusion ... 45
7. Bibliography ... 48
List of abbreviations used
ABVCAP – Associação Brazileira de Venture Capital e Private Equity BVCA – British Venture Capital Association
CMVM – Comissão do Mercado de Valores Mobiliários CVM – Comissão de Valores Mobiliários
IPO – Initial Public Offering
EMPEA - Emerging Markets Private Equity Association GP – General Partner
LP – Limited Partner PE – Private Equity VC – Venture Capital NAV – Net Asset Value
IOSCO - International Organization of Securities Commissions EVCA – European Venture Capital Association
SME –Small and Medium Enterprises GDP – Gross Domestic Product
FMIEE – Fundos Mútuos de Investimento em Empresas Emergentes FIP – Fundo de Investimento em Participações
CAGR – Compounded Annual Growth Rate
GVcepe - Centro de Estudos em Private Equity e Venture Capital PIPE – Private Investment in Public Equity
1
1. Introduction
In the beginning of this century, the economist Jim O‘Neill identified four countries that were poised to emerge as significant powers in the global economy: Brazil, Russia, India and China — the ―BRIC‖ countries. At the time, BRIC countries were collectively contributing about 16% of the world‘s gross domestic product growth. Since then, their aggregate importance has exploded. Between 2000 and 2008, BRIC economies represented approximately 30% of global growth; since the onset of the financial crisis, that figure has increased to an astounding 45%.
Brazil in particular is growing even more than Jim O‘Neill anticipated and after many years of false starts, the country has worked diligently to transform itself into a stable platform for future economic growth. With vast natural resources in a time of increasing global demand, a surging young population with an emerging middle class and maturing capital markets inspiring confidence in investors at home and abroad, the country is ready to transition to a more developed economy.
According to BVCA & PricewaterhouseCoopers (2003), Private Equity (PE) is an important funding source to the economy by acting through participations in companies with high potential of growth and focusing efforts in order to support their expansion. Due to the economic conditions and by problems faced by the bank system across the world, capital is more than ever a scarce resource and PE could play an important role in terms of stimulating the economy.
For these reasons and more, Brazil is the subject of significant interest by PE investors worldwide. Activity in the region is up significantly by seasoned investors and new entrants alike. Global PE firms, many of which have long had sporadic dealings in Brazil, are now looking more closely at establishing a permanent presence to capitalize on future opportunities (ABVCAP, 2010).
Through the analysis of the PE‗s evolution in Brazil, this project has the purpose of studding the expansion of PE in this economy in order to understand the true reality of PE in Brazil and also to indentify the main factors that contributed to this growth.
2 In the next chapters I will make a retrospective to the PE activity In Brazil, starting with a theoretical framework in which I will present the main theoretical definitions focusing them to fully contextualize the Brazilian case. After that I will make retrospective to the industry of PE in the world, in Europe, in Portugal and in Brazil. In this case, Portugal was chosen because it is the country where the analysis is being made and also because it becomes easiest to Portuguese investors, funds or any interested people to understand the reality in Brazil taking Portugal as a comparison. At last I will make an empirical analysis to the evolution of PE returns in Brazil and identify the main factors that had a vital impact in the rise of PE.
3
2. Theoretical Framework
Private Equity Definition
According to EVCA “Private equity provides equity capital to enterprises not quoted
on a stock market. Private equity can be used to develop new products and technologies (also called venture capital), to expand working capital, to make acquisitions, or to strengthen a company’s balance sheet. It can also resolve ownership and management issues. A succession in family-owned companies, or the buyout and buyin of a business by experienced managers may be achieved by using private equity funding.”
By the other hand, the expressions of Private Equity and Venture Capital come always together and it‘s important to distinguish them:
“Venture Capital is a professional equity co-invested with the entrepreneur to fund an early-stage (seed and start-up) or expansion venture. Offsetting the high risk the investor takes is the expectation of higher than average return on the investment. Venture capital is a subset of private equity.”
According to Fraser-Sampson (2007) Venture Capital (VC) funds often specialize in different stages of the company life cycle. A VC fund can also lead a young company through the different phases depending on the performance and potentials. Usually VC funds hold minor equity interests.
VC funds are considered to be the riskiest investments in the private equity industry since the target companies are small and not well diversified. The value created by VC funds is based on finding the best potential revenue generating ideas and companies. By accumulating a portfolio of these companies, the probability that one or more of the portfolio companies will grow exponentially increases and the few successful companies will be the value generators for VC funds.
4
Investment Stages
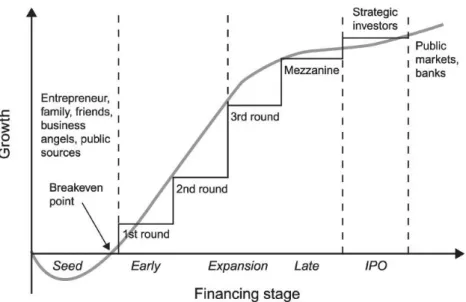
Figure 1: Private equity investment stages
Source: Cendrowski, Martin, Petro and Wadecki (2008)
According to Cendrowski, Martin, Petro and Wadecki (2008) there are 4 main stages of investment in PE:
Seed stage: Investments in the seed stage are meant for research & development and
prototype development. This phase is the predecessor of the early stage phase.
Early stage: In this phase marketing and product development are the important activities that need financing. Sales and thus profit are not generated yet.
Late stage: This phase requires financing for expansion and growth. The company is
breaking even and needs financing for production capacity or working capital.
Expansion capital and other later stages: The Company reaches maturity and other
investors purchase a minority of shares. The majority of shares are still owned by the company founder.
PE provides long-term, committed share capital, to help unquoted companies grow and succeed. Obtaining private equity is very different from raising debt or a loan from a lender, such as a bank. Lenders have a legal right to interest on a loan and repayment of the capital, irrespective of your success or failure. PE is invested in exchange for a stake
5 in your company and, as shareholders; the investors‘ returns are dependent on the growth and profitability of your business (Cendrowski, Martin, Petro and Wadecki, 2008).
Brazil
Figure 2: Private equity investment stages in Brazil
Source: ABVCAP
The Brazilian industry of PE it‘s divided as the U.S.A. standards, separating the terms of PE and VC in order to distinguish these different stages (ABVCAP, 2009). Besides this division, investments in mezzanine and PIPE (Private Investment in Public Equity) are also very common in this industry.
Venture Capital
Seed capital - Small contribution made in pre-operational phases to develop an idea for
a project, for market testing and also for patents registration;
Startup - Inflow of capital to companies in structuring phases, usually during the first
year of its operation, even when it isn‘t yet active in the market;
Early Stage – Financing companies that have products or services already in the market,
usually up to 4 years of operation and bellow $ 9 million of revenues.
Private Equity
Expansion or growth - Capital contribution to the expansion of a company that already
sells its products or services. The investment is also intended to expand the company by the improvement of his local capability, the company‘s internationalization or even a financial restructuring.
6
Later Stage and Buyout - At this stage the company has achieved a growth rate
relatively stable and a positive cash flow. This sort of investment has less risk, but it is generally less profitable.
Mezzanine
It‘s a later stage investment provided to a company that is already producing and selling a product or service, for the purpose of helping the company achieve a critical objective that, in many cases, will enable it to go public. This type of investment is made through subordinated debt or hybrid instruments of financing, including various forms of debentures and subscription rights.
PIPE
Acquisition of equity capital for companies already listed on the stock market that have low liquidity and in which the organization can play an active role in managing strategic management.
Investment types
Usually PE funds use debt to finance their acquisitions. So for successful investing, PE funds rely in this phase on favorable market conditions to purchase debt and to acquire a company. Short-term and intermediate-term interest rates for low-grade bonds are the most important factor in this phase.
The terms that most PE firms use to define the ―stage‖ of a company‘s development are determined by the purpose for which the financing is required (Cendrowski, Martin, Petro and Wadecki 2008).
Seed
To allow a business concept to be developed, perhaps involving the production of a business plan, prototypes and additional research, prior to bringing a product to market and commencing large-scale manufacturing. Only a few seed financings are undertaken each year by PE firms. Many seed financings are too small and require too much hands-on support from the PE firm to make them echands-onomically viable as investments. There
7 are, however, some specialist PE firms which are worth approaching, subject to the company meeting their other investment preferences.
Business angel capital should also be considered, as with a business angel on a company‘s board, it may be more attractive to PE firms when later stage funds are required.
Start-up
The target here is to develop the company‘s products and fund their initial marketing. Companies may be in the process of being set up or may have been trading for a short time, but not have sold their product commercially. Although many start-ups are typically ―smaller‖ companies, there are an increasing number of multi-million pound start-ups.
Expansion
Expansion capital investments are focused to mature companies that are looking for capital to expand or restructure operations, enter new markets or finance a significant acquisition without a change of control of the business. Companies that seek expansion capital will often do so in order to finance a transformational event in their lifecycle. According to the report of BVCA & PricewaterhouseCoopers (2008) these companies are likely to be more mature than VC funded companies, able to generate revenue and operating profits but unable to generate sufficient cash to fund major expansions, acquisitions or other investments. Expansion capital can also be used to transform a company's balance sheet, particularly to reduce the amount of leverage (or debt) that the company has.
Leveraged Buyouts
A leverage buyout can be described as a transaction in which a group of private investors, typically including management, acquire a company quoted on an exchange by taking on large debts with the target firm‘s assets and/or cash flow as security. This process can be transformational, value-added, or active-investment strategic and it calls for highly special skills by the investment managers. The investment cycle can be categorized into five different stages and each stage requires different skills as they focus on different stages of the company life cycle.
8
Management buy-out (MBO)
Is a corporate action that enables the current operating management and investors to acquire or to purchase a significant shareholding in the product line or in the business that they manage. MBOs range from the acquisition of relatively small formerly family owned businesses to £100 million plus buy-outs. The amounts concerned tend to be larger than other types of financing, as they involve the acquisition of an entire business.
Management buy-in (MBI)
A corporate action in which an outside manager or a management team purchases an ownership stake in the first company and replaces the existing management team.
Buy-in management buy-out (BIMBO)
Is a form of a buyout that incorporates characteristics of both a management buyout and a management buy-in. A BIMBO occurs when existing management - along with outside managers - decides to buyout a company. The existing management represents the buyout portion while the outside managers represent the buy-in portion.
Institutional buy-out (IBO)
To enable a PE firm to acquire a company, following which the incumbent and/or incoming management will be given or acquire a stake in the business.
This is a relatively new term and is an increasingly used method of buy-out. It is a method often preferred by vendors, as it reduces the number of parties with whom they have to negotiate.
Secondary purchase
This happens when a PE firm acquires existing shares in a company from another PE firm or from another shareholder or shareholders.
Bridge financing
9 Private equity and Venture capital stages in the Brazilian industry
In the Brazilian market the most common operations in the past few years, after the boom of PE and VC industry, has been operations involving companies in expansion and in the early stage (GVcepe, 2008). Besides that, projects at seed or start up stages are as well very common, representing approximately 20% of the total operations. According GVcepe (2008) PE operations involving companies listed on the stock market (PIPE) are frequent mainly because of the high relevance of PE in relation with IPO operations in Brazilian market. By the other hand, buyout operations are not very common deals in this market, never less they are the most significant in terms of value, as it was expected.
Exit Options
Many business owners and shareholder management teams are looking at some point to sell their investment or seek a stock market listing in order to realize a capital gain. PE firms usually also require an exit route in order to realize a return on their investments.
The time frame from investment to exit can be as little as two years or as much as ten or more years. At the time of exit, the PE firm may not sell all the shares it holds. In the case of a flotation, PE firms are likely to continue to hold the newly quoted shares for a year or more (EVCA, 2007).
The options:
Trade sale
The sale of your company‘s shares to another company, perhaps in the same industry sector.
The majority of exits are achieved through a trade sale(Fraser-Sampson 2007), and this often brings a higher valuation to the company being sold than a full stock market quotation, because the acquirer actually needs the company to supplement its own business area, unlike a public shareholder.
Repurchase
10
Refinancing
Purchase of the PE investor‘s shareholdings by another investment institution. This type of exit may be most suitable for a company that is not yet willing or ready for flotation or trade sale, but whose PE investors may need an exit.
Flotation
To obtain a quotation or IPO on a stock exchange, such as the Official List of the London Stock Exchange, AIM, NASDAQ (USA) or IBOVESPA (Brazil).
Involuntary exit
This happens when the company enters in a liquidation process.
Brazil
The impact of Private Equity in the stock market
The IPO (Initial Public Offering) is a natural way for the exit of investment in PE in the world, but for many years were not a viable alternative in Brazil due to the volatile macroeconomic environment and high interest rates that watch over the country in 80's and 90's (GVcepe, 2008).
However, with the improved macroeconomic environment and increased global liquidity, concomitant reduction of interest rates, the stock market gained prominence as alternative long-term investment. In fact, since 2004 the Brazilian stock market took a new momentum with the wave of IPOs triggered by the divestments of businesses some organizations managing portfolios of PE (GVcepe 2008).
PE industry plays a very important role in relation with IPO deals, or in other words PE is one of the main booster of the new entries in the Brazilian stock market. IPO operation is actually, in terms of quantity and value, the main exit option for the PE entities (GVcepe, 2008), between 2004 and June 2008 were conducted 110 IPOs that raised R$ 88.5 billion, of which 39 companies had received investment from PE prior to public offering.
11 According with the same report GVcepe of besides the IPO option, which represented more than 50% of the operations made in the past few years, trade sale and buyback are the only other options used in this market, each one representing approximately 20% of the total transactions.
Fund Structure
According to Fraser-Sampson (2008) a PE fund is a financial vehicle, Limited Partnership that invests in companies during a limited time period of in general 10-12 years. After a fund raising period, the PE fund closes and new entrants are not allowed. It is also not allowed to leave the fund once you are in. After this initial period, the PE fund starts investing in companies.
If the general partner (GP) finds investment opportunities, he will give a capital call to each of the limited partners (LP), the investors. At that moment the LP‘s are obliged to submit a portion of their commitment. If a portfolio company is sold the revenues are distributed to the limited partners. The vintage year of a fund marks the start of the funds investing activities.
The general partner usually earns management fees and a performance incentive, also known as a carried interest. The carried interest is based on value growth beyond a certain level, the hurdle rate. The mandate of the limited partnership arranges aspects of the investment scope, commitment features and financial agreements. Typical aspects are: the geographical investment scope, the frequency and magnitude of capital calls, the specific sector focus, type of deals, type of exit strategy etc. The fund is usually structured to benefit the investor in terms of tax regulations and legal jurisdictions. To prevent an additional tax layer the fund is based on a transparent limited partnership.
Brazil
The Brazilian industry of PE is supervised by the Brazilian Securities Market Commission (CVM) that have created specific requirements for VC funds (FMIEE - Fundos Mútuos de Investimento em Empresas Emergentes ) in 1994 and for PE funds (FIP – Fundos de Investimento em Participações) in 2003 (GVcepe, 2008).
12
Private equity funds (FIP)
Increasingly popular in Brazil, the FIP Fund (Private Equity) is mainly characterized by active participation in companies or businesses in which it invests. According to the instruction 391 of 2003 dated the CVM, the FIP is constituted as private and the assets under its management are intended to "acquisition of shares, debentures, warrants or other securities exchangeable for shares of companies that are public or private, participating in the decision making process of the invested company.
In other words, this means that the fund has real influence in setting the strategic policy and management, through appointment of members to the Board of Directors of the companies in their portfolio.
Venture Capital funds (FMIEE)
The FMIEE is a private fund with the purpose of sharing resources for the implementation of a diversified securities portfolio composed by emerging companies. It is understood by emerging companies, companies that have an annual turnover bellow R$ 100 million and with a consolidated net worth not higher than R$ 200 million.
The FMIEE represents an excellent mechanism to leverage companies that need resources, but does not have sufficient scale to be of interest to capital markets and therefore unable to break this barrier. The FMIEE can concentrate a large number of medium-sized businesses, these are likely to be as large as the market wants, and yet be able to leverage economic growth. The instruction n 209 by CVM establishes that 75% of the investment should be in shares, convertible debentures, or warrants and 25%, must be invested in shares of fixed income or fixed income securities.
13 Fund lifecycle
According to Cendrowski, Martin, Petro and Wadecki (2008) for each fund under management, PE firms cycle through a multi-staged process of:
Fund Raising
Most private equity firms raise capital for a fund through investments made by limited partners - typically pensions, endowments, institutional funds, and high net worth individuals, with the firm serving as the general partner.
Prior to a capital raise, PE firms normally establish a target fund size. Depending on the firm's track record and the general economic climate, fund raising efforts may either be under- or over-subscribed. New funds for historically successful firms are commonly over-subscribed and may therefore close with capital in excess of the target fund size.
Portfolio acquisition search
Once fund raising is complete, firms begin scouting for potential portfolio investments. While firms enjoy meeting directly with companies interested in selling, often the introduction between a company and a firm is made through an investment banker.
Investment
As PE firms identify potential portfolio companies in which to invest, they go through a merger & acquisition transaction process to acquire these new portfolio companies.
Corporate Growth
PE firms will often have a fairly aggressive growth strategy - for both organic and growth by add-on acquisitions - as a means to create value and therefore enhance the valuation of their portfolio.
14
Divestment
Liquidity Event
Because limited partners do not have an infinite investment horizon, PE firms must eventually convert equity value back to cash by liquidating portfolio holdings. A divestment could occur in the form of a buyout, initial public offering (IPO), strategic acquisition, or another firm buying the portfolio investment. Regardless of how it transpires, the divestment of a portfolio company creates a liquidity event for the firm, essentially converting equity into cash or more cash-like equivalents.
Capital Gains
PE firms make money both from the cash flow that a portfolio company produces while it is owned by the firm as well as from the capital gains realized upon exit. The liquidity event at exit produces and finalizes a capital gain (or loss) for the partnership for that particular investment.
Dispersal of funds back to limited partners
The dispersal of the capital gain (or loss) from the fund to the limited partners provides the limited partners with a definitive return on investment for the life of the fund.
15
3. Historical Overview
The history of PE is almost as old as history itself; however, the PE as we know today had it beginning in the United States (Cendrowski, Martin, Petro and Wadecki 2008). More specifically at the World War II when the Congress gave a boost to small businesses when it created the Smaller War Plants Corporation (SWPC) in 1942. Although many large businesses deployed enormous amounts of capital to increase production and efficiency for the wartime effort, smaller businesses, lacking such resources, could not compete with their larger competitors. In an effort to eliminate this issue, the SWPC became the first governmental body focused on loaning money expressly to private entrepreneurs (Esperança e Matias, 2005).
In the 1960s, PE firms organized into the structure that is common today, limited partnerships, in which investment professionals serve as general partners and the investors, as passive limited partners, provide the capital. Firms began using the now familiar ―2 and 20″ compensation structure, with limited partners paying an annual management fee of up to 2 % and 20 % of profits to the general partners (Cendrowski, Martin, Petro and Wadecki 2008). In the late 1970s and 1980s, the industry experienced the first of three boom cycles. Financier Michael Milken popularized the use of high yield debt, also known as junk bonds, in corporate finance and mergers and acquisitions (Sorkin 2008). This fueled a boom in leverage buyouts and hostile takeovers. Milken‘s network of high-yield bond buyers enabled him to raise large sums of money which provided the fuel for entrepreneurs such as John Malone‘s Tele-Communications Inc., Ted Turner‘s budding 24-hour TV network, Turner Broadcasting, cell phone pioneer Craig McCaw, and casino entrepreneur Steve Wynn.
Other well-known corporate raiders during the 1980s included Carl Icahn, Victor Posner, Nelson Peltz, Robert M. Bass, T. Boone Pickens, Harold Clark Simmons, Kirk Kerkorian, Sir James Goldsmith, Saul Steinberg and Asher Edelman. Milken‘s money-raising ability also facilitated the activities of leveraged buyout firms such as Kohlberg Kravis Roberts. Led by three former Bear Stearns executives, KKR targeted successful family-owned businesses founded after World War II that were facing succession challenges. Many of these buyouts would sell off pieces of the company to pay off the debt load. Thus, leveraged buyouts came to symbolize ―ruthless capitalism‖ prompting
16
a backlash in the media and Oliver Stone‘s famous movie, Wall Street. The era culminated in the massive $31.1 billion dollar takeover of RJR Nabisco by KKR.
The junk bond industry collapsed later in the decade in part due to Milken‘s 1989 indictment and 1990 guilty plea to multiple charges that he violated US securities laws. The industry enjoyed another boom cycle from 1992 to 2000 with the emergence of more institutionalized PE firms and the high tech frenzy among telecommunications and Internet companies. This cycle ended with the Dot-com crash of 2002. When the dust settled from that crisis, historically low interest rates geared to jump-starting the economy spawned a wave of leveraged buyouts from 2003 through 2007. It led to the completion of 13 of the 15 largest leveraged buyouts in history, a major expansion in PE activity, and the growth of massive, institutional-sized PE firms such as The Blackstone Group and the Carlyle Group (Burrough and Helyar 1990). Sarbanes Oxley legislation, passed in the wake of the corporate accounting scandals at Enron, WorldCom, Tyco, Global Crossing and other companies also added an extra layer of cost and complexity to publicly-traded companies. Thus, many top executives saw PE ownership as more attractive than remaining public. Leveraged buyouts were back, only this time PE executives rebranded themselves as pursuers of corporate efficiency and of ―adding value‖ to underperforming companies. Major buyouts were once again common from 2004 through 2006 due to widely available credit at unprecedented levels of leverage. By 2007, however, the crisis that affected the mortgage market spilled over into the world of leveraged finance. By midyear, there was a clear slowdown in high yield and leverage loan markets with far fewer issuers. Uncertain market conditions continued to put a damper on investment, with many firms withdrew from or renegotiated deals completed at the top of the market. The credit crunch has prompted PE firms to either sit tight on their investments or pursue other ways of deploying their funds. This includes Private Investments in Public Equity transactions. In addition, several of the largest PE firms have pursued opportunities through the public markets. In 2006, Kohlberg Kravis Roberts raised $5 billion in an initial public offering for a new permanent investment vehicle (KKR Private Equity Investors). The Blackstone Group completed its first major IPO of a PE firm in June 2007. These public offerings allow investors who would otherwise be unable to invest in a traditional PE limited partnership to gain exposure to a portfolio of PE investments. According to the Wharton School of Business and their 2009 Wharton Private Equity & Venture Capital
17
Conference, PE firms will face unprecedented challenges in the next few years. Deals that once required only 15% in equity will require upwards of 35 to 40 % or more. In addition, many PE firms face a ―wall‖ of refinancing that are due in 2012 which may challenge the survival of both the portfolio companies and many established PE firms.
Brazil
The initial steps taken by the Brazilian Government to encourage the development of VC activities date back to 1974, through programs run by the National Social and Economic Development Bank, and 1976, through the Studies and Projects Financing Agency. With the opportunities opened up by the real Economic Stabilization Plan in the early 1990s, PE activities became more institutionalized in Brazil, with the issue of the initial regulations for this sector. This economic context grew into a business environment that attracted PE investors that selected this channel as appropriate for investing in privatization (ABVCAP, 2009).
According to data taken from the Brazilian Private Equity and Venture Capital Census, there were eight fund managers in 1994. By 2000, this figure had risen to 45, reaching 132 in 2008 and more recently, in 2010, it reached 370.
According to information from this Census, by December 2009 the private equity industry encompassed 180 management entities, with 1,747 professionals involved in this field, 236 investment channels and 554 companies in portfolios. In 2003, Brazil‘s PE investments options expanded (due to implementation of new regulations), which until then lacked their own control system established by law. Added to this was corporate law reform, together with confirmation by the judiciary branch of arbitration as a lawful way of settling corporate disputes, while underlying macro-economic conditions remained stable.
The PE and VC segment set a new record when bringing in US$ 34 billion capital in 2009, earmarked for investments in Brazil. In 2008, this figure reached US$ 27.1 billion, up from US$ 5.6 billion in 2004. In just half a decade, this amount expanded more than fivefold, according to data taken from the census of this sector. It is also important to stress that the inflow of PE foreign capital to Brazil reached a record level of around US$ 4 billion in 2007(GVcepe, 2008). Out of the total amount of capital
18 allocated to PE investments, some 58% comes from foreign investors. By mid-2008, they channeled some US$ 1.11 billion to Brazil, equivalent to 43% of the funds brought in last year. As the 1997-2004 investment cycle tapered off, it became quite clear that the PE sector is endowed with ample growth potential, reaffirming its importance for the development of the capitals market in Brazil, which is clearly apparent through countless case studies of successful enterprises in this sector. Untiring efforts by the market, the government and the regulators, striving to fine-tune the channels through which funding is brokered, are focused on offering entrepreneurs easier access to capital, while helping generate more jobs and higher incomes, in parallel to fostering sustainable economic growth for Brazil.
19
4. Private Equity – Global retrospective
In order to understand the magnitude of PE development in Brazil, it is important to make a retrospective to this industry in a worldwide scale.
Global market
The PE industry has over the past two years seen the biggest downturn in activity in more than a decade. Investments, funds raised and exit levels were all well down on levels seen prior to the economic slowdown. The industry nevertheless remains an important source of funds for startup and young firms, firms in financial distress and those seeking buyout financing (Bain&company, 2011).
PE emerged in 2010 from the steep decline that followed the global financial meltdown and economic recession, looking very much like the kind of recovery that characterized rebounds from the industries past cyclical downturns. According to data provider Dealogic and Hodkinson(2011), announced buyout deal value totaled $180 billion for the year worldwide, with big gains in deal activity in all major markets.
Europe
Two years after the collapse of Lehman Brothers, which triggered the worst global economic crisis since the Great Depression, Europe has not yet emerged from the economic doldrums. Most European financial institutions have, however, managed to regain investors‘ confidence and while GDP growth is now positive, both public deficit and sovereign debt levels in certain countries worry financial markets (EVCA, 2010). In this context, the overall European economic recovery looks fragile and the general financial environment remains uncertain.
Nevertheless, PE activity has shown signs of a modest recovery in 2010. Preliminary data for the first nine months of the year points to an increase in investment and exit levels on full-year 2009 (by 13% and 9% respectively). Fundraising, however, remains challenging with the total amount raised during the first three quarters of 2010 similar to 2009 levels.
20 Portugal
Portugal's economy, like that of other countries in Southern Europe, does not have a history of PE investing. In countries like the US and the UK, PE emerged in the post-war period and has developed since, with the inevitable ups and downs. In Portugal, the industry started gaining more weight after 2000 (Domingos, 2010). At the time, a number of Portuguese and international investors were seeking alternative use for funds and aiming for geographic diversification.
According with Domingos (2010) a possible explanation for the late emergence of PE funds in Portugal is that countries in Northern Europe and the UK have mandatory pension regimes and pension funds are willing to invest into PE (an asset class which is reputed to yield higher returns compared to investments in quoted equity). Countries in Southern Europe rely mostly on Government sponsored provision of retirement income. Governments tend to follow conservative strategies and are not significant contributors to PE. Moreover, most Portuguese companies are SMEs, many of which family owned. In fact, SMEs account for 86% of employment in Portugal (against 50% in the US). The usual way to finance companies in Portugal consists in a mix of equity (provided by family and a network of business associates) and bank loans.
Portugal doesn‘t have a long history in PE as the numbers show us by telling that 64% of PE companies were created after 2001 and only 9% of PE entities have more than 30 years of activity (APCRI, 2008).
At the end of 2009, there were 52 active PE funds registered with CMVM (Comissão do Mercado de Valores Mobiliários). These funds are managed by 28 GPs and the sum of all funds was above 3000 Millions of Euros.
Brazil
Over the last 10 years, partly as a result of government policies designed to stimulate employment, maintain low inflation and better distribute the country‘s growing wealth, nearly 30 million Brazilians have entered the middle class and they are beginning to consume nearly as much as their counterparts in more economically developed nations (Ernest&Young, 2011). The country is rapidly growing into one of the world‘s largest
21 consumer markets for everything from shampoo to automobiles. The trend is expected to gather steam as prosperity becomes a self-perpetuating cycle, giving more consumers more dollars for goods and services further up the value chain, driving new opportunities for even more of the country‘s citizens to share in Brazil‘s growth story.
In the last two years, PE firms have taken notice of Brazil‘s growth and have been increasing their activity in the country. For local PE firms already active in the market, this means a time of unprecedented deal flow and new opportunities. For mega-firms with the interest and the resources but not necessarily significant experience investing in Brazil, it means opening new offices, raising new funds, adding new professionals who are familiar with the local market and putting assets to work in a handful of initial deals.
As activity has increased, so too has an understanding of PE‘s prerogatives and methodologies by Brazil‘s business community. Entrepreneurs and family business owners that were once wary of working with PE firms are now more accepting. In many instances, business owners have seen firsthand how a competitor or supplier benefitted from PE involvement (GVcepe, 2010).
22
Fundraising
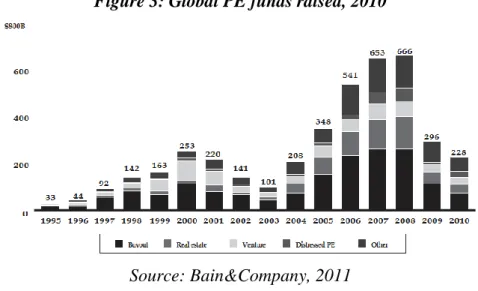
Figure 3: Global PE funds raised, 2010
Source: Bain&Company, 2011
PE fund-raising conditions continued to deteriorate throughout 2010. Worldwide, PE firms managed to raise just $228 billion last year, according to Bain&Company (2011). That was 23% less than they took in during 2009, itself a depressed year. Perhaps befitting economic conditions, only funds that invest in distressed assets saw a small fund-raising pickup during this otherwise bleak time.
Funds raised fell by two-thirds in 2009 to $296bn, the lowest annual amount raised since 2004. Many factors weighed against new fund-raising efforts in 2010. On the demand side, LP budgets for new PE commitments in 2010 were conservative. Most drew up their 2010 budgets in 2009 when the market conditions they faced were grim. At the time, most LPs were pushed to the limit of their PE target allocations by the so-called denominator effect, as write-downs in the valuation of their PE holdings lagged those of their portfolio as a whole. Also, with PE exit activity blocked and little in the way of cash distributions they could count on, they were caught in a liquidity squeeze. Finally, they faced a huge overhang of obligations to meet capital calls on $1 trillion of commitments they had previously made.
23
Figure 4: Europe PE Funds raised, 2010
Source: EVCA, 2010
One of the biggest issues faced by the industry during the crisis has been the extremely challenging fundraising environment. In 2009, due to a number of factors, commitments to PE funds fell dramatically (EVCA, 2010).
From €81bn in 2008, the amount raised went down to only €16bn in 2009, and remained at subdued levels in 2010 with €13bn raised during the first three quarters of the year. Although the extent of the drop in the recent crisis was much larger than the drop in fundraising after the dot.com bust, the market seems to experience a similar trend: fundraising does not rebound as fast as investments and remains at lower levels for a longer period.
Figure 5: Portugal PE Funds raised, 2010
Source: APCRI, 2010
The year of 2009 was the best in the last 5 years, the values raised by PE funds was above 900 Million Euros. There was a huge different comparing with the same situation in 2008, this happened mainly because there was a transformation of a holding company
- € 200 € 400 € 600 € 800 € 1.000 € 2005 2006 2007 2008 2009 2010f Mill io n s
24 into a PE fund (CMVM, 2009). According with APCRI (2011), PE fundraising reached in 2010 99.5 M€ which represents a decrease of approximately 90% comparing with 2009.
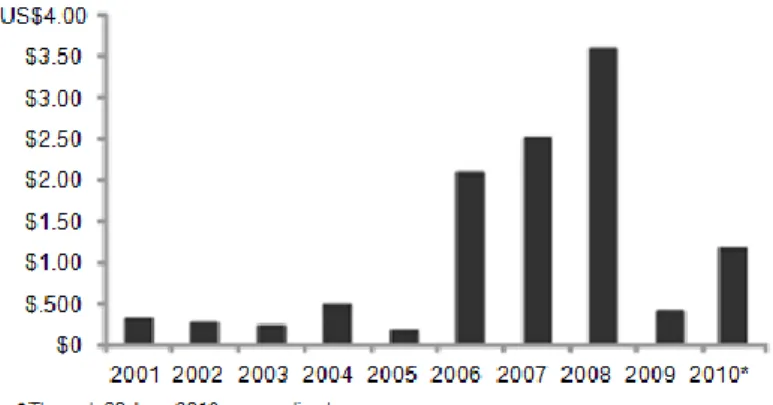
Figure 6: Brazil - PE Funds raised, 2010
Source: Ernerst&Young, 2010
Fund-raising for Brazil-targeted funds in particular increased significantly in 2006, jumping to US$2.1 billion from levels of approximately US$200 to 400 million in the years prior. As the buyout boom gained steam, so too did commitments earmarked for the country, topping out at US$3.6 billion before declining in 2009, consistent with broader industry trends.
As the global fund-raising environment recovers, it is expected that a greater number of assets will be invested in vehicles targeting Latin America. A recent survey by Coller Capital (2011) found that emerging markets‘ share of new LP commitments will increase significantly as investors diversify their PE portfolios globally. Investors with existing exposure to emerging markets plan to grow their exposure from 6% to 10% of new PE allocations to 11% to 15% over the next two years. What‘s more, Brazil is expected to be a prime benefactor of their interest. Many LPs that have made initial emerging market investments in China and India are now looking to Brazil. Almost 20% of investors with exposure to emerging markets other than Brazil said they would be putting money to work in Brazil over the next two years.
25
Figure 7: Global Private equity investments, 2010
Source: Bain&Company (2011)
PE emerged in 2010 from the steep decline that followed the global financial meltdown and economic recession, looking very much like the kind of recovery that characterized rebounds from the industry past cyclical downturns. According to Bain&Company (2011), announced buyout deal value totaled $180 billion for the year worldwide, with big gains in deal activity in all major markets. In North America and Europe, the epicenter of the global credit crisis, deal values were up 192 percent and 160 percent, respectively, from the cyclical trough. Deal making in the Asia-Pacific region, too, resumed its strong growth as PE firms and their investors continued to lavish attention on that hot growth market.
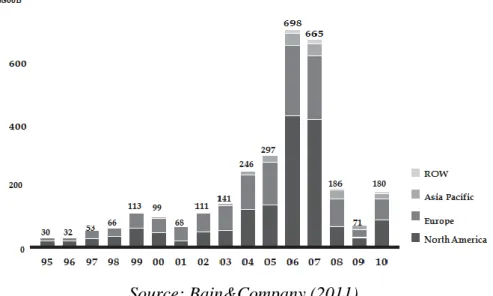
Figure 8: Europe - Private equity investments, 2010
Source: EVCA, 2010
Investment by European PE funds registered a modest recovery in 2010, with €26bn invested in the period January-September 2010, up from the 2009 trough of €23bn
(full-26 year data). The recovery was mainly driven by buyouts which went up by one-third on full-year 2009, to €17bn, with large and mega deals doubling on the full-year 2009 levels. In the first three quarters of 2010, growth capital reached the same level as in the full-year 2009, with €4.7bn invested, while VC investment reached only 60% of the 2009 level, at €2.5bn.
The number of companies financed decreased slightly (-17%) to 5,046 companies in 2009. This indicates smaller average sizes of investment per company, decreasing from €9m in 2008 to €5m in 2009. Buyouts represented 53% of the total amount invested, although the number of companies financed through a buyout represented just 12% of all companies financed. Companies in the venture stages, mainly early-stage, attracted most of the investments (EVCA, 2010).
Figure 9: Portugal - Private equity investments, 2010
Source: APCRI, 2011
The Portuguese industry of PE has registered in 2009 a positive growth, against the world tendency in this industry, but this doesn‘t mean that the sector wasn‘t in crisis; actually it only means that in Portugal the impact of the global downturn in PE activity would only occur in 2010. The total deal flow decreased almost 50% in 2010, comparing with the values registered in 2009, and due to the actual economic and political situation of Portugal it isn‘t expected that 2011 will be a better year than 2010.
0 € 50 € 100 € 150 € 200 € 250 € 300 € 350 € 2007 2008 2009 2010 M illio ns
27
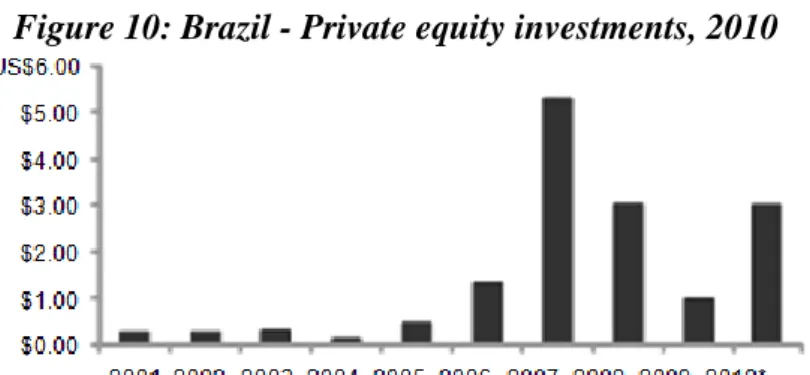
Figure 10: Brazil - Private equity investments, 2010
Source: Ernest&Young, 2010
After stagnating for many years at levels of US$200 to US$300 million per year, PE activity in Brazil picked up significantly in 2005, when nearly US$500 million in new deals were announced. Activity increased dramatically between 2005 and 2007, peaking at US$5.3 billion. Between 2008 and 2009, activity declined consistent with global merger and acquisition trends. On a year-over-year basis, transactions dropped 43% in 2008 and another 67% in 2009. While such declines are discouraging, activity nonetheless remains much higher than in the pre-boom years.
Disinvestment
Figure 11: Global Disinvestment activity
Source: Bain&company, 2011
As with deal making, exit activity rebounded strongly from depressed 2009 levels. Both in terms of the number of sales completed and the total value realized worldwide, exits in 2010 showed signs of a solid recovery. Even better, GPs saw opportunities to sell their previous investments improve markedly throughout the year. As concerns over a
28 double-dip recession or a collapse of the European banking system ebbed, buyers of PE assets (corporations, public market investors and other PE firms) grew more confident and found common ground with PE sellers‘ price expectations.
Certainly, GPs were highly motivated to close out their ripe portfolio holdings and burn through their large unrealized portfolios. Many felt pressure to score some ―wins‖ and bank returns before taking to the road with their next fund-raising effort. They also needed to provide liquidity to their distribution-starved LPs, enabling them to meet capital calls and reignite the fund-raising cycle (Bain&Company, 2011). Some felt obliged to get money back into the hands of the more junior investment professionals within their firms, many of whom joined at the height of the PE boom and have yet to earn any carry throughout the exit drought that followed the boom. Further, with expectations high throughout most of the year that taxes on dividends and capital gains in the US would be raised, PE firms were eager to lock in returns at the lower rates. Finally, and perhaps most important, market valuations on high-quality assets were robust.
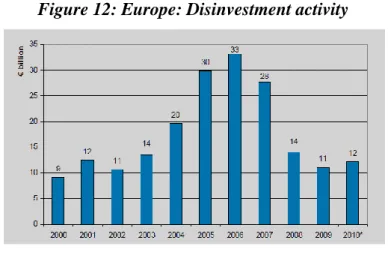
Figure 12: Europe: Disinvestment activity
Source: EVCA, 2010
In recent years the European exit market went through an unprecedented crisis, during which divestment levels were divided by three (from 2006 to 2009). Taking into account the high investment levels in the period 2005-2008 it follows that PE firms are left with a substantial number of investments which will need to be divested in the coming years. Therefore a rebound in divestment activity is highly expected and in fact
29 0 € 20 € 40 € 60 € 80 € 100 € 120 € 140 € 2007 2008 2009 2010 M illio ns
a modest recovery is already taking place. Preliminary data for 2010 shows that €12bn at cost was divested in the first three quarters of 2010, 9% more than in the full-year 2009 (€11bn).
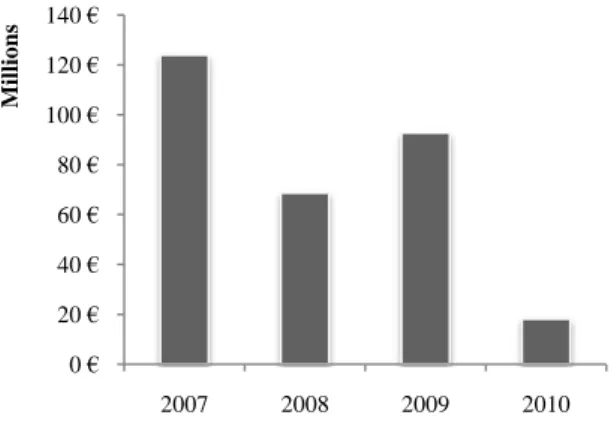
Figure 13: Portugal: Disinvestment activity
Source: APCRI, 2011
Portugal registered in 2010 a total disinvestment of 18 Millions, which represents a decrease of 80% comparing with 2009. The Portuguese industry of PE showed a high development in the recent years but it was not so efficient to improve the main problem for this industry in Portugal, the stock market. Portuguese market has a real problem when it comes to disinvest, due to the limitations of options mainly because the stock market doesn‘t have the sufficient liquidity to be a viable exit option. This problem restrains the growth of PE in Portugal and also it limits the return to the PE entities due to the limited exit options.
30
Figure 14: IPOs in Brazil from 2000 through 2010
Source: Ernest&Young, 2011
The maturation of Brazil‘s capital markets has been a key factor in the increased focus on the country by PE investors. Until recently, most PE exits were characterized by trade sales to large multinational firms, and this remains a very important exit strategy for PE-backed companies. Indeed, two of the country‘s largest PE exits last year were sales to multinational firms.
While trade sales to foreign firms still present the surest exit route for many investors, other options available to PE investors as they ponder their exit plans have been increasing as well. Cash-rich domestic acquirers are increasingly pursuing growth- through-acquisition strategies.
The most important development in recent years from a PE perspective is the emergence of Brazil‘s stock exchange as an venue for initial public offerings. While still small relative to other stock exchanges throughout the world, listings on Brazil‘s primary stock exchange, increased from just a handful in the early part of the decade to a peak of 65 companies in 2007 that raised a collective US$32 billion in gross proceeds.
31
5. Private equity in Brazil – Empirical Analysis
Methodology
Figure 15: J-curve
According with Mathonet and Meyer (2007) PE investment is different from just about any other asset class, and one of the main differences is that annual returns cannot be used as a guide to PE performance. The reason that annual returns are not a valid measure of PE performance is because an investment in a PE fund represents an investment in a stream of cash flows. When an investment is made in a PE fund, it will have a whole series of cash out-flows as money is drawn down by the GP, but both the timing and the amount of these outflows is totally uncertain. Similarly there will be a number of cash inflows as the GP distributes the proceeds of investments as they are realized, but it is completely impossible to predict in advance how much each one of these will amount to, or when it will occur. The calculation in respect of a PE fund can only be made once the very last cash flow has occurred; in other words, the true return will only be known retrospectively.
The J-curve is produced by looking at the cumulative return of a fund to each year of its life. In other words, the first entry will represent the IRR of the fund for the first year of its life. The second entry will represent the IRR of the fund for the first two years of its life, the third the IRR for the first three years, and so on.
32 down, if only through the effect of management fees. However, as distributions start to flow back to the investor then the downward march of the IRR will be reversed and there will come a day when the amount of inflows precisely matches the amount of outflows, thus creating a cumulative IRR of zero. This is the point where the J-curve crosses back over the horizontal axis and subsequent IRRs start to become positive.
A particular problem which arises with this diagram is that investors are so used to look at annual returns that they find it very difficult to evaluate a fund that cannot give them an annual profit.
In order to evaluate the annual returns of PE funds in Brazil, I will replicate the methodology that CVM applies, in order to evaluate (in annual terms) the development of each PE Fund. This methodology evaluates the return of each fund as the variation of its net asset value (NAV) (1).
This method is largely used all over the world, because it‘s a tool that allows investors to compare the evolution of PE funds, even that they knew that this inst the real return for them but, it‘s the better approximation possible to do in order to get some sort of evaluation on PE funds before the disinvestment phases (Lahr and Kaserer, 2010).
33
Brazilian Private Equity funds
Figure 16: Total active PE funds, 2011
*1st Quarter 2011
Source: CVM
According to the data provided by CVM, there were 370 PE funds registered at the end of 2010, representing a compounded annual growth rate (CAGR) of 51% since 2007. In relation with 2011, only in the 1st quarter of the year, were registered 38 new funds, which indicate that the recent tendency of growth in Brazil is not stopping. The most important indicator for the recent evolution of PE in Brazil is that 70% of the active PE funds at the end of the 1st quarter of 2011 were constituted since the beginning of 2010.
Figure 16: Net Asset Value, 2011
Source: CVM
In order to construct a data basis, I have collected the information for the net asset value for each PE fund per quarter since 2007, available at CVM‘s site. After that I
12.816 15.954 17.594 21.438 20.213 25.728 22.832 23.409 22.912 27.253 31.583 43.858 44.243 48.218 52.335 60.737 0,00 € 10.000,00 € 20.000,00 € 30.000,00 € 40.000,00 € 50.000,00 € 60.000,00 € 70.000,00 € 2007 1st Q. 2007 2nd Q. 2007 3rd Q. 2007 4th Q. 2008 1st Q. 2008 2nd Q. 2008 3rd Q. 2008 4th Q. 2009 1st Q. 2009 2nd Q. 2009 3rd Q. 2009 4th Q. 2010 1st Q. 2010 2nd Q. 2010 3rd Q. 2010 4th Q. M il li o ns 108 174 241 370 408 0 50 100 150 200 250 300 350 400 450 2007 2008 2009 2010 2011*
34 compiled the numbers and I was able to make an overview of the net assets value evolution between 2007 and 2010. The evolution of the net asset values represented a CAGR of 63% in the referred period, where the main boost occurred after the 2º semester of 2009.
Figure 17: Total participation units, 2011
Source: CVM
Observing the evolution of the total number of participation units we can conclude that investment activity has been very high since the 2nd semester of 2007, as referred in the previous chapter. The total number of participation units has achieved 7,620 million at the end of 2010, representing a CAGR of 78% between 2007 and 2010.
Funds performance
Figure 18: PE Funds average returns, 2007- 2010
768 771 774 1.964 2.064 2.091 2.249 2.630 2.638 2.695 3.202 3.415 4.862 4.988 5.629 7.620 0 1.000 2.000 3.000 4.000 5.000 6.000 7.000 8.000 9.000 2007 1st Q. 2007 2nd Q. 2007 3rd Q. 2007 4th Q. 2008 1st Q. 2008 2nd Q. 2008 3rd Q. 2008 4th Q. 2009 1st Q. 2009 2nd Q. 2009 3rd Q. 2009 4th Q. 2010 1st Q. 2010 2nd Q. 2010 3rd Q. 2010 4th Q. M il li o ns 0% 20% 40% 60% 80% 100% 120% -5% 0% 5% 10% 15% 20% 25% 30% 2007 1st Q. 2007 2nd Q. 2007 3rd Q. 2007 4th Q. 2008 1st Q. 2008 2nd Q. 2008 3rd Q. 2008 4th Q. 2009 1st Q. 2009 2nd Q. 2009 3rd Q. 2009 4th Q. 2010 1st Q. 2010 2nd Q. 2010 3rd Q. 2010 4th Q.
35 Through the variation of the NAV of a PE fund we can reach the return that it had in the observed period. By doing this to every PE funds registered in CVM, I was able to construct an average returns for the PE industry between 2007 and 2010. As we can see in the figure 18, the average returns were always positive, with the exception of the last quarter of 2008 and the first of 2009.
Never less these positive results, it‘s also important to take a look to the standard deviation evolution, since we are emerging from a financial crisis that deeply affected the global economy. In fact if we observe the period where the crisis started, at the end of 2007, it was the period where the variation of returns registered the highest values, reaching in the 3rd quarter of 2008 almost 100%.
Table 1 – Descriptive statistics for the PE funds average returns, 2007-2010
Analyzing the descriptive statistics for the average returns computed for the active PE funds between 2007 and 2010, we can see that, as I have said before, the period when the financial crisis started resulted in a period of very high variance in the PE funds returns.
This distribution is characterized also for being Leptokurtic, or in other words, to have its values very concentrated around the mean. In terms of asymmetry of this distribution is always positive, with the exception of the 4th quarter of 2009, which means that in this period the division between values that where over the mean and above the mean was very uniform(due to the low levels of asymmetry). Once again we can see that, the higher returns were achieved in the period where the economy was more depressed, but also the worst returns were registered in this period.
1st 2nd 3rd 4th 1st 2nd 3rd 4th 1st 2nd 3rd 4th 1st 2nd 3rd 4th Average returns 28% 10% 4% 7% 2% 12% 5% -1% -1% 9% 4% 1% 2% 0% 2% 10% Standard deviation 98% 51% 13% 83% 53% 76% 92% 55% 28% 68% 32% 18% 44% 24% 29% 46% Kurtosis 21.4 34.6 12.2 65.6 24.4 73.2 86.3 60.3 14.4 106.2 26.5 9.5 88.8 51.4 39.1 40.5 Asymmetry 4.5 5.5 3.4 7.9 4.4 8.1 8.8 6.8 1.3 9.5 3.6 -0.2 8.1 6.3 4.1 5.6 Minimum -14% -66% -13% -78% -89% -77% -88% -97% -99% -96% -99% -91% -100% -45% -99% -95% Maximum 511% 326% 61% 687% 339% 706% 908% 505% 164% 768% 225% 79% 493% 215% 260% 438% Nº observations 30 46 58 71 87 97 113 125 141 148 151 164 182 195 215 227 2010 2009 2008 2007 Descriptive Statistics
36
Private equity returns Vs IBOVESPA
To fully understand the behavior of the PE funds, we should compare the returns achieved by them with the Brazilian stock index, IBOVESPA. For that I have considered the quarterly returns of IBOVESPA between 2007 and 2010.
Figure 18: PE Funds average returns, 2007- 2010
Source: BM&FBovespa
Comparing the two distributions we can see that, when IBOVESPA is in positive returns, PE funds seem to be almost always bellowing them. By the other hand, when IBOVESPA is registering neutral or negative returns, PE funds showed always better results.
Table 2 –Descriptive statistics – IBOVESPA vs. PE funds, 2007-2010
Considering the descriptive statistics for the evolution of IBOVESPA and for the average returns of PE funds, IBOVESPA has been more risky in this period than PE funds (in average) since it have a standard deviation double higher than PE funds. Never less the similar average returns that these distributions have, their behavior has been very different, and it is showed not only by the values of standard deviation, but also by the maximum and minimum returns achieved.
Descriptive statistics IBOVESPA PE funds
Average returns 4% 6% Standard deviation 14% 7% Kurtosis -0.50 5.78 Asymmetry -0.43 2.11 Minimum -21% -1% Maximum 23% 28% -30% -20% -10% 0% 10% 20% 30% 40% -30% -20% -10% 0% 10% 20% 30% 40% 2007 1st Q. 2007 2nd Q. 2007 3rd Q. 2007 4th Q. 2008 1st Q. 2008 2nd Q. 2008 3rd Q. 2008 4th Q. 2009 1st Q. 2009 2nd Q. 2009 3rd Q. 2009 4th Q. 2010 1st Q. 2010 2nd Q. 2010 3rd Q. 2010 4th Q.