Departamento de Ciências e Tecnologias de Informação
Animation of BPMN Business Processes Models
Marco André Marques Roque
A dissertation presented in partial fulfillment of the requirements for the degree of
Master in Computer Science and Business Management
Supervisor:
Fernando Brito e Abreu, Associate Professor,
ISCTE-IUL
ii Marco Roque – July, 2014
iii Marco Roque – July, 2014
Agradecimentos
À minha família, em especial aos meus pais Ana Roque e António Roque, pela força e apoio incondicional que sempre prestaram durante a minha vida.
À minha namorada Vanessa Matos, pela paciência, força e ajuda.
A todos os meus amigos que me incentivaram a concluir este desafio, especialmente ao André Tomás pelo seu apoio durante a elaboração da dissertação.
Ao Professor Doutor Fernando Brito e Abreu, pelos ensinamentos na arte de fazer Ciência, pelo seu tempo e dedicação que me permitiram alcançar os meus objetivos académicos.
iv Marco Roque – July, 2014
v Marco Roque – July, 2014
Abstract
BPM in the business world is currently supported by tools that facilitate the design, implementation, execution, monitoring and optimization of business processes. These so called Business Process Management Suites usually have animation capabilities associated to process simulation. However, animation capabilities vary depending on the tool and the better these are, the higher is the animation preparation effort. This problem is more evident when generic simulation tools are compared with BPM specific ones, which use BPMN (Business Process Modeling Notation) as the modeling notation and have more limited animation capabilities.
This dissertation presents a proposal to endow the BPMN with animation capabilities which respects all the elements presentation rules established in the notation specification. This proposal was designed based upon the data collected through the application of the animation capabilities evaluation taxonomy also proposed here in this dissertation. A prototype was built on top of an open-source tool in order to implement our animation proposal and was used to animate the service request process model using real execution data from an IT Service management tool used at ISCTE-IUL.
Keywords:
vi Marco Roque – July, 2014
vii Marco Roque – July, 2014
Resumo
A gestão de processos de negócio no mundo empresarial é actualmente suportada por ferramentas computacionais, que facilitam o seu desenho, implementação, execução, monitorização e optimização. Essas ferramentas, vulgarmente designadas de Business Process Management Suites, possuem usualmente mecanismos de animação aliados à simulação de processos. Contudo, as capacidades de animação diferem consoante a ferramenta, sendo que quanto melhores são estas capacidades, maior é o tempo investido na preparação da animação. Este problema torna-se mais evidente quando são comparadas ferramentas de simulação mais genéricas com ferramentas dedicadas à gestão de processos de negócio, que usam BPMN (Business Process Modeling Notation) como notação de modelação, em que as animações se tornam mais limitadas.
Esta dissertação apresenta uma proposta de animação para a notação BPMN que respeita as regras de apresentação dos elementos da notação estabelecidas na especificação da mesma. Esta proposta foi desenhada com base nos resultados recolhidos através da aplicação de uma taxonomia também aqui proposta para a avaliação das capacidades de animação de ferramentas de simulação de processos de negócio, onde se reflecte o estado da arte no campo da animação de processos. A proposta de animação foi implementada num protótipo, que assenta sobre uma ferramenta open-source seleccionada a partir de requisitos definidos e apresentados na dissertação. Por fim, o protótipo foi usado para animar um modelo do processo de requisição de serviços usando, para isso, dados de execução reais recolhidos da ferramenta de gestão de serviços de TI utilizado no ISCTE-IUL.
Palavras – chave:
Animação de modelos BPMN; reprodução de processos; animação de modelos de processos de negócio.
viii Marco Roque – July, 2014
ix Marco Roque – July, 2014
Table of Contents
1. Introduction ... 2 1.1. Motivation ... 2 1.2. Research problem ... 2 1.2.1. Problem statement ... 2 1.2.2. Research questions ... 21.3. Expected contributions and objectives ... 3
1.4. Research methodology ... 4
1.5. Business process models animation ... 9
1.6. BPMN – Business Process Modeling Notation ... 10
1.7. Document structure ... 11
2. A taxonomy on tool support for process animation ... 14
2.1. Business Process Simulation ... 14
2.1.1. BPS benefits ... 14
2.1.2. BPS limitations ... 15
2.2. The taxonomy categories ... 16
2.2.1. Model component animation ... 16
2.2.2. Animation customization... 17 2.2.3. Interactivity controls ... 18 2.3. Summary ... 19 3. Tools survey ... 22 3.1. Tool sample ... 22 3.2. Arena ... 22 3.3. Simul8 ... 24
3.4. IBM WebSphere business modeler advanced 7.0 ... 25
3.5. Progress savvion process modeler 8.0 ... 26
3.6. Tibco business studio community edition ... 28
x Marco Roque – July, 2014
3.8. Results summary ... 30
3.9. Related work... 32
3.10. Summary ... 32
4. OSS tool selection ... 34
4.1. Introduction ... 34
4.2. OSS tools evaluation framework ... 34
4.3. Tools search and selection ... 36
4.3.1. Search criteria ... 36
4.3.2. Search results ... 37
4.4. Description of the selected OSS projects ... 38
4.4.1. Activiti ... 38
4.4.2. Bonita open solution: Open source BPM ... 38
4.4.3. BPMN2 Modeler ... 38
4.4.4. jBPM ... 39
4.4.5. Modelio – Modeling environment (UML) ... 39
4.4.6. Yaoqiang BPMN editor ... 39
4.5. Collected data from the OSS projects ... 40
4.6. BPMN 2 elements coverage ... 41
4.7. Fit for purpose evaluation criteria ... 42
4.7.1. Source code access ... 42
4.7.2. API flexibility ... 42
4.7.3. Source code understandability ... 43
4.7.4. Source code complexity ... 44
4.8. Applying fit for purpose evaluation criteria ... 45
4.8.1. Source code access results ... 45
4.8.2. API flexibility ... 45
4.8.3. Source code understandability ... 46
xi Marco Roque – July, 2014
4.9. Results summary ... 54
4.10. Summary ... 55
5. BPMN 2.0 elements animation... 58
5.1. Introduction ... 58
5.2. BPMN 2.0 elements ... 58
5.3. BPMN 2.0 proposed new elements ... 59
5.3.1. Resources... 59
5.3.2. Queues ... 60
5.3.3. Process instances ... 62
5.4. Animation for BPMN 2.0 and proposed elements ... 63
5.4.1. Fill color and border line color animation ... 63
5.4.2. Border line thickness animation ... 64
5.4.3. Events animation ... 64
5.4.4. Activities animation ... 65
5.4.5. Gateways animation ... 65
5.4.6. Sequence flows animation ... 66
5.4.7. Resources animation ... 66
5.4.8. Queues animation ... 67
5.4.9. Process instances animation ... 67
5.5. Animation views... 67
5.5.1. Dynamic behavior view ... 67
5.5.2. Path load analysis view ... 68
5.5.3. Performance analysis view ... 68
5.6. BPMN 2.0 elements graphical rules ... 69
5.7. Summary ... 70
6. Bpmn2Animator ... 72
6.1. Introduction ... 72
xii Marco Roque – July, 2014
6.3. Plug-in development ... 76
6.3.1. Plug-in dependencies ... 77
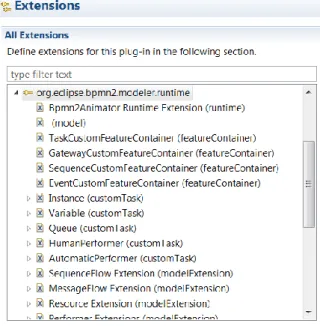
6.3.2. Plug-in Extensions ... 79
6.3.3. Bpmn2 Modeler runtime extension ... 81
6.4. Bpmn2Animator package analysis ... 84
6.4.1. Bpmn2Animator animation engines ... 86
6.4.2. Bpmn2Animator model ... 95
6.4.3. Bpmn2Animator user controls ... 96
6.4.4. Bpmn2Animator event generators ... 101
6.5. Summary ... 103
7. Validation ... 106
7.1. Introduction ... 106
7.2. Business process – Request fulfillment ... 106
7.2.1. ISCTE-IUL request fulfillment process ... 107
7.2.2. Process roles ... 108
7.2.3. Process activities ... 109
7.3. Data preparation ... 110
7.3.1. Data collection ... 110
7.3.2. Data preparation ... 113
7.4. Process execution data replay ... 115
7.4.1. Service request fulfilment process replay ... 115
7.4.2. 11th of September, 2013... 116
7.4.3. 19th of September, 2013... 120
7.4.4. 26th of September, 2013... 124
7.5. Summary ... 128
8. Conclusions and future work ... 130
8.1. Conclusions ... 130
xiii Marco Roque – July, 2014
Bibliography ... 133
Annexes ... 137
A. OSS Projects web addresses ... 137
B. Bpmn2Animator development ... 138
B.1 Bpmn2Animator extension elements of Bpmn2 Modeler ... 138
C. Service request fulfillment process data preparation ... 140
C.1 CSV Analyzer internals ... 140
C.2 Sort helper list ... 144
C.3 IT service management system actions description ... 145
C.4 Actions to ignore list content ... 146
C.5 Service request process groups ... 146
D. Service request process model parameterization ... 147
E. Service request fulfillment process replay results ... 150
E.1 11th of September of 2013 ... 151
E.2 19th of September of 2013 ... 153
xiv Marco Roque – July, 2014
xv Marco Roque – July, 2014
List of Figures
Figure 1 – Research activities and contributions ... 8
Figure 2 - Arena animation example ... 23
Figure 3 - Simul8 animation example ... 24
Figure 4 - Websphere animation example ... 26
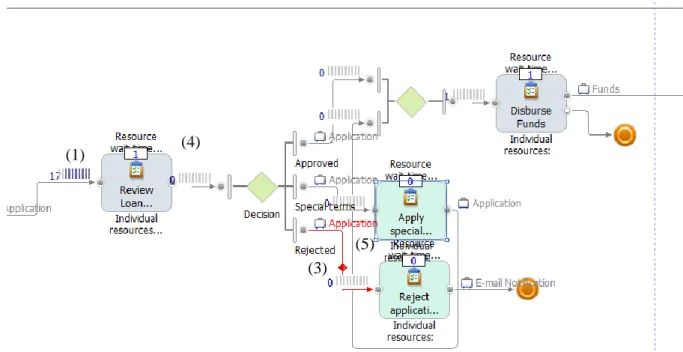
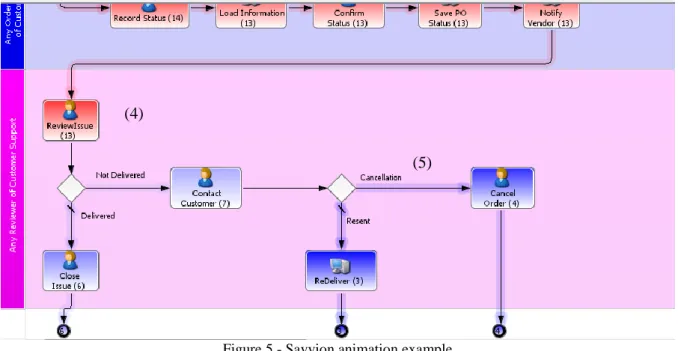
Figure 5 - Savvion animation example ... 27
Figure 6 - Tibco animation example ... 28
Figure 7 - ProM UITopia animation example (source: (Aalst, Leoni and Hofstede 2012))... 29
Figure 8 - Tool scores comparison histogram ... 31
Figure 9 - BPMN2 Modeler size analysis treemap view ... 47
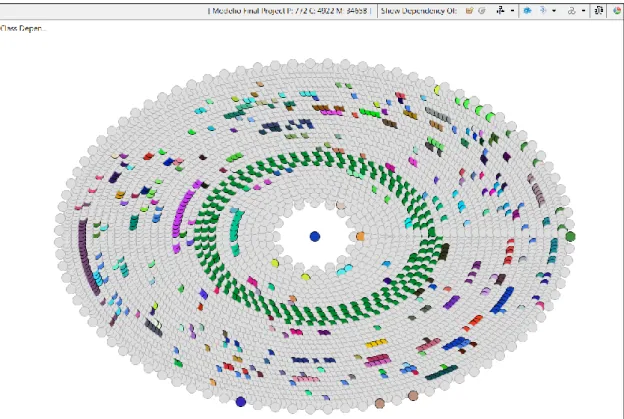
Figure 10 - Modelio size analysis treemap view ... 48
Figure 11 - Yaoqiang size analysis treemap view ... 48
Figure 12 - BPMN2 Modeler complexity analysis view ... 49
Figure 13 - Modelio complexity analysis view ... 50
Figure 14 - Yaoqiang complexity analysis view ... 50
Figure 15 - BPMN2 Modeler CA analysis with dependency view ... 51
Figure 16 - Modelio CA analysis with dependency view ... 52
Figure 17 - Yaoqiang CA analysis with dependency view ... 52
Figure 18 - BPMN2 CE analysis with dependency view ... 53
Figure 19 - Modelio CE analysis with dependency view ... 53
Figure 20 - Yaoqiang CE analysis with dependency view ... 54
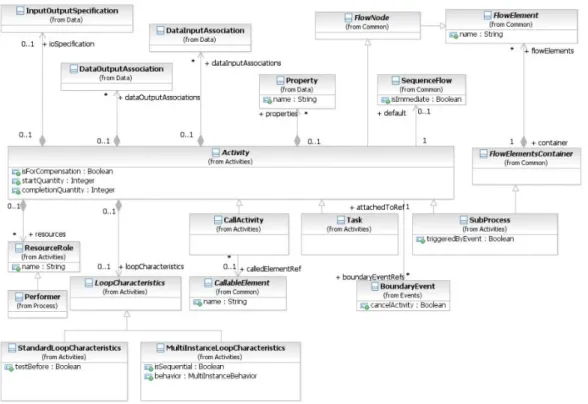
Figure 21 - BPMN metamodel extract related with resource assignment (source: (OMG 2011)). ... 59
Figure 22 - Graphical notation proposed for human resource roles ... 60
Figure 23 - Graphical notation proposed for automated resource roles ... 60
Figure 24 - BPMN metamodel extract related to activities (source: (OMG 2011)). ... 61
Figure 25 - Propose extension to the BPMN metamodel ... 61
Figure 26 - Proposed graphical notation for a Queue. ... 62
Figure 27 - Instance metaclass ... 62
Figure 28 - Icon for human process instances. ... 62
Figure 29 - Icon for document process instances. ... 63
Figure 30 - Icon for default process instances. ... 63
Figure 31 - Border line thickness and border line color change example ... 63
Figure 32 – Fill color change example ... 63
Figure 33 – Color spectrum example ... 64
xvi Marco Roque – July, 2014
Figure 35 - End Event border line color and fill color animation example ... 65
Figure 36 - Intermediate Event border line color, and fill color animation ... 65
Figure 37 - Examples of activity animation (in the left: only border line thickness and border line color. In the middle: only fill color. On the right: combination of the three animation types) ... 65
Figure 38 - Gateway border line thickness, border line color and fill color animation ... 66
Figure 39 - Sequence flow line thickness and line color animation example ... 66
Figure 40 - Resource color animation type figure. ... 66
Figure 41 - Resource states icons (From left to right: “Idle”, “Busy” and “Fail”). ... 66
Figure 42 - Example of resource presentation with its status. ... 67
Figure 43 - Queue color animation example ... 67
Figure 44 - Bpmn2Animator use case diagram ... 72
Figure 45- Animation execution controls ... 73
Figure 46 - Start animation dialog ... 73
Figure 47 - Event Manager dialog ... 73
Figure 48 - Bpmn2Animator preferences window ... 74
Figure 49 - Bpmn2Animator animation display control view ... 75
Figure 50 - Task animation attributes property tab ... 75
Figure 51 - Bpmn2 Modeler dependencies ... 76
Figure 52 - Bpmn2Animator Eclipse contributions demonstration... 77
Figure 53 - Bpmn2Animator preferences page ... 77
Figure 54 - Bpmn2Animator plug-ins dependencies ... 79
Figure 55 - Extension points used by Bpmn2Animator ... 80
Figure 56 - Bpmn2 Modeler preferences window with Target Runtime ... 81
Figure 57 - Extension elements from Bpmn2 Modeler used by Bpmn2Animator. ... 82
Figure 58 - HumanPerformer CustomTask extension details ... 83
Figure 59 - Bpmn2 Modeler palette with the “Animator” category ... 83
Figure 60 - HumanPerformer usage example. ... 84
Figure 61 - Bpmn2Animator package diagram (all packages) ... 86
Figure 62 - Package dependencies diagram centered on the engines package. ... 86
Figure 63 - Engines package class diagram. ... 88
Figure 64 - AnimationEngine interaction diagram ... 88
Figure 65 - Sequence diagram of the AnimationEngine updateElement method. ... 89
Figure 66 - diagramAnimation package class diagram. ... 89
Figure 67 - Sequence diagram for updatePictogram. ... 90
xvii Marco Roque – July, 2014
Figure 69 - DiagramAnimationEngine interaction diagram ... 91
Figure 70 - Process instance animation class diagram ... 92
Figure 71 - Process instance animation interaction diagram ... 93
Figure 72 - Instance animation sequence diagram ... 93
Figure 73 - ModelMetrics package class diagram ... 94
Figure 74 - ModelAnimationEngine interaction diagram ... 95
Figure 75 - EMF model editor ... 96
Figure 76 - Bpmn2AnimatorModel package diagram ... 96
Figure 77 - User controls centered package view ... 97
Figure 78 - Preferences package class diagram. ... 99
Figure 79 - Handlers package class diagram. ... 99
Figure 80 - Views package class diagram ... 100
Figure 81 - EventGenerators package dependencies diagram. ... 101
Figure 82 - EventGenerators package class diagram. ... 102
Figure 83 - EventGenerator interaction diagram ... 103
Figure 84 - BPMN model of the request fulfillment process ... 108
Figure 85 - IT Management System data export web page (Operation -> Actions -> All Actions) ... 111
Figure 86 - IT Service Management System - Filter web interface ... 112
Figure 87 - Sorting criteria to prepare the file for CSV Analyzer plug-in ... 113
Figure 88 - CSV Analyzer options window ... 114
Figure 89 - Service requests fulfilment process activity graphic ... 115
Figure 90 - Process status 11th September (presented metrics: Activities - num. of proc. instances; Performers - num. of proc. instances; Queues - num. instances that waited in the queue) ... 118
Figure 91 - Process status 11th September (presented metrics: Activities - num. of SLA violations; Performers - total of proc. time; Queues - wait time) ... 119
Figure 92 - Process status 11th September (presented metrics: Activities - num. of SLA violations; Performers - total of proc. time; Queues - Avg. wait time per instance) ... 120
Figure 93 - Process status 19th September (presented metrics: Activities - num. of proc. instances; Performers - num. of proc. instances; Queues - num. of instances that waited in the queue) ... 122
Figure 94 - Process status 19th September (presented metrics: Activities - num. of SLA violations; Performers - total of proc. time; Queues - total of wait time) ... 123
Figure 95 - Process status 19th September (presented metrics: Activities - num. of SLA violations; Performers - total of proc. time; Queues - Avg. wait time per instance) ... 124
Figure 96 - Process status 26th September (presented metrics: Activities - num. of proc. instances; Performers - num. of proc. instances; Queues - num. of instances that waited in the queue) ... 126
xviii Marco Roque – July, 2014
Figure 97 - Process status 26th September (presented metrics: Activities - num. of SLA violations;
Performers - total of proc. time; Queues - total of wait time) ... 127
Figure 98 - Process status 26th September (presented metrics: Activities – num. of SLA violations; Performers – total of proc. time; Queues – Avg. wait time per instance) ... 128
Figure 99 - CSV Analyzer main method UML sequence diagram ... 141
Figure 100 - applyRulesToEvents UML sequence diagram ... 142
xix Marco Roque – July, 2014
List of tables
Table 1 - Design science research guidelines. Source: (Hevner, March, Park and Ram 2004). ... 5
Table 2 – Research contributions by artifact type ... 6
Table 3 - Research contributions grouped by contribution type ... 7
Table 4 - Queue, Resource and Activity animation ... 16
Table 5 - Process instance animation ... 17
Table 6 - Sequence flow animation ... 17
Table 7 - Attributes and global variables animation ... 17
Table 8 - Queue and Activity customization ... 17
Table 9 - Resource customization ... 18
Table 10 - Process instance customization ... 18
Table 11 - Sequence flow customization... 18
Table 12 - Attributes and global variables customization ... 18
Table 13 - Animation speed controls... 19
Table 14 - Animation interaction controls... 19
Table 15 - Animation visualization controls ... 19
Table 16 - Tool sample ... 22
Table 17 - ARENA evaluation scores ... 24
Table 18 - Simul8 evaluation scores ... 25
Table 19 - Websphere evaluation score... 26
Table 20 - Savvion evaluation score ... 27
Table 21 - Tibco evaluation score ... 28
Table 22 - ProM UITopia evaluation score ... 30
Table 23 - Summary of scores for component animation ... 30
Table 24 - Summary of scores for animation customization ... 30
Table 25 - Summary of scores for animation interactivity ... 31
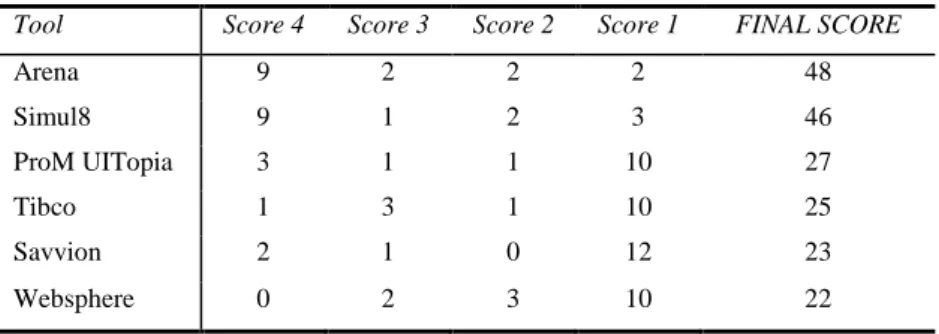
Table 26 - Final rank of surveyed tools regarding animation features ... 31
Table 27 - OSS projects success evaluation criteria ... 34
Table 28 - Number of results by open source projects repository ... 37
Table 29 - OSS projects found in the search process ... 38
Table 30 - Selected OSS projects data ... 40
Table 31 - BPMN 2 coverage results ... 41
Table 32- Source code access easiness ... 42
Table 33 - API flexibility classification criteria ... 43
xx Marco Roque – July, 2014
Table 35 - Source code access results ... 45
Table 36 - API requirements list ... 45
Table 37 - API flexibility results ... 46
Table 38 - Number of source code languages results ... 46
Table 39 - Javadoc coverage results ... 47
Table 40 - OSS tools analysis summary ... 55
Table 41 - BPMN 2.0 Basic elements notation (source: (OMG 2011)) ... 58
Table 42 - Resource graphical notation used by BPMN task type ... 60
Table 43 - Text, color, size and lines rules for BPMN ... 69
Table 44 - Bpmn2 Modeler plug-ins ... 78
Table 45 - Graphiti plug-ins ... 78
Table 46 - EMF plug-ins ... 78
Table 47 - Eclipse IDE plug-ins ... 78
Table 48 - Bpmn2Animator used Extension points and their description ... 80
Table 49 - org.eclipse.bpmn2.modeler.runtime extension elements description. ... 82
Table 50 - Bpmn2Animator package descriptions ... 84
Table 51 - Preferences package classes’ description ... 99
Table 52 - Handlers package classes description ... 100
Table 53 - Classes descriptions ... 100
Table 54 - Request Fulfillment process activities ... 107
Table 55 – Request fulfillment process roles ... 108
Table 56 - Columns selected in the view... 112
Table 57 - Columns added in the first stage of the data preparation ... 113
Table 58 - Bpmn2Animator evaluation results ... 131
Table 59 - Bpmn2Animator score ... 131
Table 60 - OSS projects web addresses ... 137
Table 61 – Bpmn2Animator extension elements ... 138
Table 62 - Appling data preparation rules methods description ... 142
Table 63 - SortHelper content ... 145
Table 64 - IT service management system actions descriptions ... 145
Table 65 - Actions to ignore ... 146
Table 66 - Groups defined in the IT service management system ... 147
Table 67 – Group levels mapping with process model lanes ... 148
Table 68 - Gateway 1 (“to 1st line?”) conditions ... 148
xxi Marco Roque – July, 2014
Table 70 - Gateway 3 (“to 1st line?”) conditions ... 150
Table 71 - Gateway 4 (“to proceed?”) conditions ... 150
Table 72 - Gateway 5 (“is validated?”) conditions ... 150
Table 73 - Queues results ... 151
Table 74 - Performers results ... 151
Table 75 - Gateways results Table 76 - Boundary events results ... 151
Table 77 - Gateways results ... 152
Table 78 - Boundary events results ... 152
Table 79 - Sequence flows results ... 152
Table 80 - Activities results ... 153
Table 81 - Queues result ... 153
Table 82 - Performers results ... 153
Table 83 - Gateways results ... 154
Table 84 - Boundary events results ... 154
Table 85 - Sequence flows results ... 154
Table 86 - Activities results ... 155
Table 87 - Queues results ... 155
Table 88 - Performers results ... 155
Table 89 - Gateways results ... 156
Table 90 - Boundary events results ... 156
xxii Marco Roque – July, 2014
1 Marco Roque – July, 2014
Chapter 1
Introduction
Contents
1. Introduction ... 2 1.1. Motivation ... 2 1.2. Research problem ... 2 1.2.1. Problem statement ... 2 1.2.2. Research questions ... 2 1.3. Expected contributions and objectives ... 3 1.4. Research methodology ... 4 1.5. Business process models animation ... 9 1.6. BPMN – Business Process Modeling Notation ... 10 1.7. Document structure ... 112 Marco Roque – July, 2014
1. Introduction
1.1. Motivation
Animation can be defined as a dynamic presentation of objects that change position, form or color on top of a static background (Pegden et al. 1995). In the case of process model animation, the static background is the process model itself. Basically, an animated layer is added on top of the static process model in order to show information about its execution. Using animation one can understand the process dynamic behavior while watching a movie presenting the process execution events. The movie may present, for example, the resources usage, the process instances travelling through the process paths or simply the activities usage. Process models animation can be used for designing/redesigning business processes or for monitoring the processes execution performance. The usage of animation to illustrate processes performance appeared first in general purpose simulation tools like arena (Automation 2014). Animation has gained importance since then, and nowadays it can be found in many general purpose simulation tools, as well as in Business Process Management dedicated tools. The problem with process models animation is that it varies much from tool to tool. This can be understandable in the case of general purpose simulation tools since many of them have its own modeling language and therefore its own way of animating the processes. However this becomes less understandable and desirable in the case of Business Process Management dedicated tools, since most of them use the Business Process Model and Notation (BPMN) in order to model the business processes. We believe that a scientific effort should be made in order to present a BPMN extension that can be used to animate business processes and give one step forward towards a BPMN animation standard.
1.2. Research problem
1.2.1.
Problem statement
How to animate BPMN models to present business processes execution information?
The problem addressed in this work has to do with the BPMN notation and in which way the notation can be extended in order to support the animation of business process models.
1.2.2.
Research questions
Following the problem formulation there were some research question that were used to guide our work:
How is the animation supported by the commercial tools?
3 Marco Roque – July, 2014
Which Open Source Software tool should we use as basis for the development of our prototype?
How to manipulate the BPMN elements without violating the notation rules?
1.3. Expected contributions and objectives
In the end of our work we expect to have the following contributions:
- Propose and apply a taxonomy for tool animation support assessment.
In order to assess the state of the art of business process models animation, we intend to gather a sample of commercial tools that present state of the art animation features. In order to ensure comparability of the commercial tools we searched for a research work that presented a taxonomy that we could use. However, because we were not able to find one, we intend to develop one and apply it to the sample of tools in order to draw conclusions about the state of the art of business process models animation. The taxonomy should be able to evaluate the animation support of each element as well as the animation customization and the tool animation interaction capabilities.
- Application of the developed taxonomy in order to understand the state of the art.
After developing our taxonomy we intend to apply it to a sample of animation supporting tools in order to understand the state of the art of process model animation.
- Propose a BPMN extension that endows the notation with process model animation features.
We intend to develop a BPMN extension that shows how the notation elements may be animated in order to present process execution details.
- Develop an Open Source Software prototype that implements the BPMN extension. We also intend to develop a software prototype that is able to read process execution events from a log and animate the process model at same time using our BPMN extension.
- Propose a framework for Open Source Software tools selection
Our developed prototype will be developed upon other Open Source Software (OSS) tool that supports business processes modeling in BPMN, and also fits our development requirements. Since we were not able to find one framework that could facilitate the choice of such tool, we intend to propose one and apply it in a sample of OSS tools.
4 Marco Roque – July, 2014
1.4. Research methodology
Our research follows the design science research methodology. According to Hevner et al. (2004), design science is a problem solving paradigm. It seeks to extend the boundaries of human and organizational capabilities through the creation of new and innovative artifacts. In this paradigm the knowledge and understanding of a problem domain, as well as its solution are achieved in the building and application of the designed artifact. Hevner et al. (2004) state that IT artifacts are broadly defined as constructs (vocabulary and symbols), models (abstractions and representations), methods (algorithms and practices) and instantiations (implemented and prototype systems).
Constructs: provide the language in which problems and solutions are defined and communicated (Shön 1983).
Models: use constructs to represent a real world situation – the design problem and its solution space (Simon 1996).
Methods: define processes and provide guidance on how to solve problems, that is, how to search the solution space (Hevner, March, Park and Ram 2004).
Instantiations: show that constructs, models, or methods can be implemented in a working system. They enable researchers to learn about the real world, how the artifact affects it, and how users appropriate it (Hevner, March, Park and Ram 2004).
Guidelines for design science in information systems research
In order to understand, execute and evaluate our research we followed the guidelines for Information systems research, presented in (Hevner, March, Park and Ram 2004). Here we describe the seven guidelines, presented in Table 1, and show how each guideline applies to our research.
5 Marco Roque – July, 2014
Table 1 - Design science research guidelines. Source: (Hevner, March, Park and Ram 2004).
Guideline Description
Guideline 1: Design as an artifact
Design-science research must produce a viable artifact in the form of a construct, a model, a method, or an instantiation.
Guideline 2: Problem relevance
The objective of design-science research is to develop technology-based solutions to important and relevant business problems.
Guideline 3: Design evaluation
The utility, quality, and efficacy of a design artifact must be rigorously demonstrated via well-executed evaluation methods.
Guideline 4: Research contributions
Effective design-science research must provide clear and verifiable contributions in the areas of the design artifact, design foundations, and/or design methodologies.
Guideline 5: Research rigor
Design-science research relies upon the application of rigorous methods in both the construction and evaluation of the design artifact.
Guideline 6: Design as a search process
The search for an effective artifact requires utilizing available means to reach desired ends while satisfying laws in the problem environment. Guideline 7:
Communication of Research
Design-science research must be presented effectively both to technology-oriented as well as management-technology-oriented audiences.
Guideline 1
Hevner et al. (2004) state, regarding this guideline, that “the result of design-science research in IS is, by definition, a purposeful IT artifact created to address an important organizational problem”. The authors also indicate, in the same work, that the artifacts constructed in design science research are not required to be a full-grown information system and that the artifact instantiation demonstrates feasibility of the designed product.
Our research work main contribution is an Open Source Software prototype that implements our proposed BPMN extension, which endows the notation with animation capabilities. According to the definitions of artifact presented before, our prototype fits in the instantiation artifact, meaning that the guideline is respected in our research. Besides the instantiation artifact, our research contributes with two methods. First, the taxonomy on tool support for process animation, which can be used to assess the animation features of a modeling tool. The second method is an Open Source Software tools
6 Marco Roque – July, 2014
selection framework that can be used to facilitate the process of choosing an OSS to extend with new functionalities in order to make the prototype development faster, since there is no need to develop everything from zero. All research contributions are presented in Table 2.
Table 2 – Research contributions by artifact type
Artifact type Contribution
Constructs BPMN Extension to endow the notation with animation features.
Models Business process model of the request fulfillment process as is implemented in ISCTE-IUL.
Methods Taxonomy on tool support for process animation. Open Source Software tools selection framework. Instantiations Bpmn2Animator prototype.
Guideline 2
As mentioned in (Hevner, March, Park and Ram 2004), “the objective of research in information systems is to acquire knowledge and understanding that enable the development and implementation of technology-based solutions to heretofore unsolved and important business problems”. In order to accomplish this objective, design science proposes the construction of innovative artifacts with the goal of changing the phenomena that occur.
Our problem has to do with the extension of BPMN notation, so it can support business process models animation. Nowadays, the tools that are focused in BPMN and support animation do not show animation capabilities as sophisticated as other general purpose simulation tools with proprietary process modeling language. On the other hand, each BPMN focused tool shows different animation capabilities, as well as different ways of animating the notation elements. Our goal is to propose an extension to the notation that can be implemented in a prototype. The extension should enable a BPMN focused tool to present animation capabilities that are more similar to the ones presented by general purpose simulation tools.
7 Marco Roque – July, 2014
Guideline 3
Evaluation includes the integration of the artifact within the technical infrastructure of the business environment. One of the evaluation methods presented in (Hevner, March, Park and Ram 2004) is the case study method that we used to evaluate our research work. Using this evaluation method we intend to verify the utility, quality and efficacy of our developed prototype.
The case study evaluation method was used in our research to validate the prototype, and thus, our proposed BPMN extension. In order to validate the proposed taxonomy on tool support for process animation we used it to evaluate a sample of tools. Also, the taxonomy was submitted and presented in the International Conference on Exploring Services Sciences 1.3 (IESS) international conference. The OSS tools selection framework was also used to evaluate a sample of tools to validate its usefulness. All of the presented research contributions were presented in an annual workshop that is promoted by the Quantitative Approaches on Software Engineering And Reengineering (QUASAR) research group, where they were evaluated and criticized by a panel of experienced researchers.
Guideline 4
“Effective design-science research must provide clear contributions in the areas of the design artifact, design construction knowledge (i.e., foundations), and/or design evaluation knowledge (i.e., methodologies)”. Three types of research contributions are identified: The design artifact, foundations and methodologies. The first one is the design artifact itself. Foundations are evaluated constructs, models, methods, or instantiations that extend the existing foundations in the design science, for example a modeling formalism. Methodologies represent the creative development and use of evaluation methods (Hevner, March, Park and Ram 2004).
Our expected contributions are presented in Table 3 grouped by research contribution type. These contributions are described in more depth in section 1.3.
Table 3 - Research contributions grouped by contribution type
Contribution type Contribution description
Foundations - BPMN extension that endows the notation with process model animation features.
Methodologies - Taxonomy for tool animation support assessment. - Framework for Open Source Software tools selection.
8 Marco Roque – July, 2014
Design artifact - Open Source Software prototype that implements the BPMN extension. Guideline 5
“Design-science research requires the application of rigorous methods in both the construction and evaluation of the designed artifact” (Hevner, March, Park and Ram 2004).
To ensure the rigor in our research work, we submitted our taxonomy on tool support for process animation to be evaluated by the reviewers of the IESS1.3 conference in order to get an experts validation and get inputs for our work. An evaluation and validation by peers was also done on three annual workshops organized by the Quasar research group, where we presented our research contributions. The inputs gathered on these workshops contributed positively to our research rigor.
Guideline 6
“Design is essentially a search process to discover an effective solution to a problem” (Hevner, March, Park and Ram 2004).
To develop our BPMN extension proposal we started by studying the notation elements, analyzing which elements should, and how they could be animated. We used all knowledge acquired from our tool survey, and respected all presentation rules of the notation elements in the conception of our extension. It was then implemented in a software prototype and finally several examples of an animated process model were presented in the case study. A model representation of our research work activities and their main contributions is presented in Figure 1.
Figure 1 – Research activities and contributions Guideline 7
“Design science research must be presented both to technology-oriented as well as management-oriented audiences” (Hevner, March, Park and Ram 2004).
9 Marco Roque – July, 2014
Our research work tries to address the problem of process models animation for both identified audiences. We tackle the problem from a management point of view, afterwards, when introducing the audience to business process models animation. Next, tools that support process models animation are surveyed and their animation features evaluated with an effort to keep understandable for both audiences. The next chapters are more focused on the technical part of our research, making those chapters more directed to a technical-oriented audience. Finally, we present our research evaluation through a case study that is aimed for both audiences. Our research work was presented in three annual workshops promoted by the QUASAR research group, and our proposed taxonomy on tool support for process animation and its application on a sample of tools were presented in the IESS 1.3 international conference. In both QUASAR workshops and IESS 1.3 conference the audience was composed by technology-oriented researchers as well as management-oriented researchers.
1.5. Business process models animation
Business process models can be animated to show process execution events information. The process execution events can have different sources, for instance, they can be provided by a simulation tool or by a business process execution engine. The events from an execution engine can be used to animate the process model in real time, so the viewer can monitor the process. On the other hand, its events can be exported from the engine and be used to replay the business process execution through process model animation. The model animation presents a movie of the model execution in which it is possible to watch the model components interacting, like for example the model instances waiting in the activities queues or the resources working and processing the instances. This animation can help to better understand the dynamic behavior of the model. In (Pegden, Shannon and Sadowski 1995) animation is defined as a dynamic presentation of objects that change position, shape or color on top of a static background. As mentioned before, animation can be useful for models verification and validation (Sargent 1998), however other usages for animation are referred in the literature. In (Rohrer 2000) animation is referred as being useful for the communication of large amounts of information and in (Agarwal 2011) is mentioned that animation can deliver complex messages that would be difficult to deliver through simulation. The animation capability to facilitate communication is also pointed in (Agarwal 2011; de Vreede and Verbraeck 1996; Janssen et al. 2009; Rohrer 2000). In (de Vreede and Verbraeck 1996) the authors conclude that “animation together with statistical sound data can make the dynamic nature of a problem situation explicit in such a way that the problem owners or decision makers will draw valid conclusions or rightfully demand further research“. Other benefit of animation is the fact that it facilitates the sharing of complex ideas and helps the creative process of developing new solutions for the problems (de Vreede and Verbraeck 1996; Rohrer 2000). In (Janssen,
10 Marco Roque – July, 2014
Joha and Zuurmond 2009) is presented a case study where simulation was used together with animation to understand how the adoption of shared services by the Dutch public agencies could improve their efficiency and service levels. The goal for the use of animation was to make the communication easier between the stakeholders, so they could better understand the process and evaluate it qualitatively. In the conclusions section, the authors claim that “for some workshop participants, the main benefits were related to the facilitation of ideas, creating understanding, and discussing the results by viewing the animation, instead of using simulations for a detailed quantitative analysis”.
1.6. BPMN – Business Process Modeling Notation
The BPMN notation was created in 2001 by BPMI.org (Business Process Management Initiative), which had the goal of creating a XML language for business process execution. In the creation process BPMI.org ended discovering the need for a graphical representation for the business processes. Several commercial companies with interest in business process modeling participated in the notation development process. They shared the same goal of creating an unique standard notation that could be adopted by several tools (White and Miers 2008). Meanwhile, BPMI.org became part of OMG (Object Management Group),which was responsible for the development of the UML (Unified Modeling Language) (Allweyer 2010).
The last version made available was the 2.0 in 2010. The objective for the notation is still the same, to create a notation that is easily understood by every business user, as well by the technical developers responsible for the development of the process execution tools. The second objective is to assure that languages developed for business process execution, like for example BPEL (Business Process Execution Language) can be visualized through a notation that is business oriented (Silver 2009). The main benefits of using the BPMN notation are the following.
- BPMN is a standard with a public specification including a metamodel that can be extended in order to enhance the notation with more specific capabilities, like for instance animation ones (Silver 2009); - BPMN does not have ambiguity in its notation components. This means that each graphical element has a specific meaning, as well as specific modeling rules, which makes the communication of process details easier, since we only have to know the notation and we will easily understand the modeled processes without further explanation;
11 Marco Roque – July, 2014
In (Correia 2014) an assessment of business process modelling languages based on a proposed taxonomy is presented and it is concluded that BPMN is nowadays the most well equipped process modelling language.
1.7. Document structure
This document contains a brief introduction on process models animation and BPMN notation. Next follows a chapter where the taxonomy for animation tool support is presented together with its application to study a sample of commercial tools. Next, a framework for Open Source Software tools is presented and applied to a sample of Open Source Software tools. After this chapter, an extension of BPMN notation is presented followed by a chapter where our prototype is presented. A case study is then presented followed by conclusions, future work and bibliographical references.
12 Marco Roque – July, 2014
13 Marco Roque – July, 2014
Chapter 2
A taxonomy on tool support for process animation
Contents
2. A taxonomy on tool support for process animation ... 14 2.1. Business Process Simulation ... 14 2.2. The taxonomy categories ... 16 2.3. Summary ... 19
In this chapter the benefits and limitations of Business Process Simulation are introduced. Also, a taxonomy to assess the animation support of each element as well as the animation customization and the tool animation interaction capabilities is proposed.
14 Marco Roque – July, 2014
2. A taxonomy on tool support for process animation
2.1. Business Process Simulation
Business Process Simulation is a technique that allows the representation of processes, people and technology in a dynamic computer model (Harrington 1991). BPS (Business Process Simulation) is also referred as “discrete event simulation” and has its roots in the manufacturing systems analysis. Later this technique was used to assist in the management of change of manufacturing and services settings (Greasley 2000). BPS is addressed in Business Process Management, which is identified as being an integrated system to manage the business performance through the management of end-to-end business processes (Hammer 2010). A business process is a logically related group of activities that use organization resources to produce results which support the organization objectives (Harrington 1991). There are reports of BPS usage in business processes reengineering projects like, for example, (Greasley 2000) and (Dennis et al. 2000). In these two particular cases, simulation is used in the design phase of the BPM lifecycle where the to-be process model is conceived. Tumay (1995) stated that business processes are too complex and too dynamic to be analyzed and understood through the use of techniques like flowcharting or spreadsheets. For that reason, organizations should use simulation in business process reengineering, because it provides analysis with precision, providing also the visualization of alternatives. With the information of probabilities at decision points and probability distributions defining activity durations Business Process Simulation allows predicting process performance along a number of measures such as lead-time1, resource utilization and cost
(Greasley 2000).
2.1.1.
BPS benefits
Business process simulation presents several benefits which help justifying the interest and applicability in business process management. Greasley (2000) presents the following three benefits: Risk Reduction – “The use of scenarios and sensitivity analysis helps reducing the unknown risk.” Proves Concept – “The model of the proposed process can help sell and ‘unfreeze’ current ways of doing. The use of animation can help understanding and the use of data collection of performance measurement can help management by ‘facts’.”
Identifies change strategies – “The simulation can assess process change from the perspectives of a change in demand on the process, a change in resource availability on the process and a change in the design of the process.”
15 Marco Roque – July, 2014
More benefits are presented in (Indihar-Stemberger et al. 2003), where the authors state that the main benefit of simulation modeling is the fact that it combines analysis and assessment in qualitative or quantitative terms. The following benefits are also presented in the same work:
What-if scenarios – Through simulation it is possible to experiment several what-if scenarios, where each one can go from a different combination of resources to a different process design with a different statistical distribution used for the decision points, which result in different performance, times and cost outputs. It is through the comparison of several scenarios that is possible to find the scenario with the best output performance. In (Hlupic and Robinson 1998) it is mentioned that alternative process designs can significantly improve the chance of a successful business process reengineering project, which can then result in capital cost reduction, better efficiency of processes, better service provided to customers and/or lead time reduction.
Dynamic behavior modeling and presentation – Nowadays simulation tools are able to model the process dynamic component and present it visually. This type of presentation is facilitated by graphical interfaces that are able to animate and display graphically the simulation results. In (Hlupic and Robinson 1998) the authors state that visual interactive simulation models, together with a variety of graphical output reports, can demonstrate the benefits of redesigned processes.
Experimenting before implementation – Experimenting with a simulation model, rather than implementing directly in real process, reduces the risk of making wrong decisions (Hlupic and Robinson 1998).
2.1.2.
BPS limitations
Although Business Process Simulation has many benefits it also has some drawbacks to be explored. One of the drawbacks is the fact that the human resources are too simplified, since it is not possible to model correctly, and in a real way, the human behavior (Aalst 2010). This problem derives from the fact that people (1) are usually involved in several processes; (2) do not work in a constant rhythm and (3) tend to work in part-time, dedicated to one function at a time, and do not follow a predicted order of work (Aalst 2010). Besides these points, it is hard to model the work priorities and the changes that the process suffers under determined contexts (Aalst 2010).
Other limitation of common simulation tools is that simulation parameters like activity execution times, waiting times, or resource availability are configured manually depending on data gathered before (Indihar-Stemberger, Popovic and Bosilj-Vuksic 2003). However, there are scientific works that go in the direction of searching a solution for this problem through the usage of data gathered from information systems which are the base for the existing processes in an organization, like Enterprise Resource Planning (ERP) systems or others transactional information systems. The idea is
16 Marco Roque – July, 2014
to use event logs as the source of information for the simulation parameterization and then apply variability through the use of statistical distributions fitted for the events (Wynn et al. 2008), (Aalst 2010).
On the other hand, there is a problem that is not explained by the lack of capacity of the simulation tools or by the simulation itself, but ends limiting the simulation results. The problem can be found in the simulation models that are created and used. Sometimes, the quality of some models is not good which can be explained by (1) incorrect process modeling or (2) by the shortage of data gathered for the creation and parameterization of the model (Aalst 2010; Terrence and Kapila 2001). There are verification and validation techniques that can be applied in order to minimize the problems that appear, because the model does not represent correctly the reality. As mentioned in (Sargent 1998). Verification is the continuous process of assuring that the model works as it should, whereas the validation is the process of assuring that the model represents the reality (Chung 2003). In both articles (Chung 2003) and (Sargent 1998) simulation models animation appears as being a technique that can be used for both model verification and validation.
2.2. The taxonomy categories
This taxonomy combines several criteria organized in categories: model component animation, animation customization and interaction controls, which will be described hereafter. Each criterion within a category is expressed on an ordinal scale, where the lowest score (1) is assigned if the evaluated feature is unavailable and the highest score (4) corresponds to the best known state of the art.
2.2.1.
Model component animation
This group of criteria (queue, resource and activity animation, process instance animation, sequence flow animation, attributes and global variables animation) evaluates tool capabilities to animate each modeling component separately. This kind of animation is usually shown close to the component, to represent the modifications of a given attribute. The following tables describe the corresponding grading scales.
Table 4 - Queue, Resource and Activity animation 1 No support
2 Numeric values only:
Numbers are placed near the corresponding activity. 3 Bar with shape and color changes:
A bar is shown near the activity and its size and/or color changes over time. 4 Animated figure:
17 Marco Roque – July, 2014
Table 5 - Process instance animation 1 No support
2
Indicative default figure animation:
Represents a false type of animation, since it does not show the passage of a process instance through the sequence flow. Instead, the animation only appears if a sequence flow arrow is selected in order to highlight it from the rest of the model.
3
Default figure animation:
The process instances are animated throughout process execution, but are all presented with an equal figure.
4
Fully animated figure:
Process instances change their representation during process execution in order to express different roles, like a client or a document.
Table 6 - Sequence flow animation 1 No support
2 Color change only at process instance passage:
The sequence flow changes its color to show the passage of a process instance. 3
Color change:
The sequence flow can be animated with several colors, each with a specific meaning. This can be used to represent if a sequence flow path has more process instances trips than other paths of the model (e.g. with a brighter color).
4
Color and form change:
The sequence flow arrows can become wider or thinner and change its color. The sequence flow arrows can become wider with the passage of process instances and its color can also become brighter. This can be useful to distinguish paths in the process that have more traffic than others.
Table 7 - Attributes and global variables animation 1 No support
2 Numeric values only:
Attribute or global variables values are shown during process execution. 3
Temporal evolution graphics:
Graphics displaying the evolution of attribute or global variables value over time may be shown.
4
Multi variable/attribute graphics:
Graphics combining the values of various attributes or/and global variables may be shown.
2.2.2.
Animation customization
The animation customization group of criteria (queue and activity customization, resource customization, process instance customization, sequence flow customization, attributes and global variables customization) relates to the capability of choosing how the model components are animated. The grading scales for each of these customizability criteria are described in the following tables.
Table 8 - Queue and Activity customization 1 No support
2
Customization of presented numeric values / bars:
We may choose which component attribute is shown as numeric value and/or animated bar.
3 Customization of animated figure:
We may customize an animated figure next to the component. 4
Cumulative customization:
Both the customization of presented numeric values/bars (grade 2) and animated figures (grade 3) are supported.
18 Marco Roque – July, 2014
Table 9 - Resource customization 1 No support
2
Customization of presented numeric values / bars and representative figure: We may choose the representative static figure for the resource and also which resource attribute is shown as numeric value and/or animated bar.
3
Customization of animated figure:
We may choose the representative figure for each resource state (e.g.: busy, fail or idle).
4
Cumulative customization:
We may customize the presented numeric values / bars and representative figure (grade 2), as well as the animated figure (grade 3).
Table 10 - Process instance customization 1 No support
2 Customization of representative figure:
We may choose the representative figure for process instances. 3 Customization of figure by sequence flow:
We may choose the representative figure of process instances for each sequence flow. 4
Customization of figure changing logic:
We may specify a logic that defines which figure should be shown for each process instance. For instance, the figure may change depending on the value or range of an attribute.
Table 11 - Sequence flow customization 1 No support
2
Customization of color:
We may choose the color that is presented when a process instance passes in the sequence flow.
3
Customization of color changes:
We may choose how the sequence flow changes color. It is possible to choose the colors, the attribute and attribute value ranges corresponding to each sequence flow color.
4 Customization of color and shape changes:
It is possible to customize the change in sequence flow thickness and color.
Table 12 - Attributes and global variables customization 1 No support
2
Customization of numeric values:
We may choose attributes and global variables to be presented in a chosen position of the model as a numeric value.
3 Customization of graphics:
We may customize graphics that represent attributes and global variables. 4 Cumulative customization:
We may customize the numeric values (grade 2), as well as the graphics (grade 3). 2.2.3.
Interactivity controls
The interactivity controls group of criteria (animation speed control, animation interaction control, animation visualization control) includes the type of controls that enable the user to interact with process execution.
19 Marco Roque – July, 2014
Table 13 - Animation speed controls 1 No support
2 Play controls:
We may play, pause, resume and stop process execution. 3 Speed controls:
We may execute the process faster or slower and go directly to a chosen date/time. 4 Cumulative control:
We may use both the play (grade 2) and speed (grade 3) controls.
Table 14 - Animation interaction controls 1 No support
2
Path choice control:
We may flow through the model, following a process instance and deciding where the instance should go in the gateways.
3
Visual interactive animation control:
We may control model components by manipulating their attributes, as well as global variables. This type of animation helps understanding model behavior and validate it (Rekapalli and Martinez 2007; Rohrer 2000).
4
Cumulative control:
We may use the path choice control (grade 2), as well as the visual interactive animation control (grade 3).
Table 15 - Animation visualization controls 1 No support
2 Zoom and viewport:
We may zoom and change the viewport. 3 Animation filter:
We may choose which components to be animated. 4
Cumulative control:
We may use the zoom and viewport features (grade 2), as well as the animation filter (grade 3).
2.3. Summary
In this chapter a taxonomy that can be used to assess the tool support for process animation was presented. This taxonomy was developed in order to be used to research the state of the art in process models animation. It was developed because we were not able to find a suitable taxonomy that could be used to draw conclusions about animation features support. The proposed taxonomy is divided in three categories; model component animation; animation customization; and interactivity controls. Each one of them with several evaluation criteria.
20 Marco Roque – July, 2014
21 Marco Roque – July, 2014
Chapter 3
Tools survey
Contents
3. Tools survey ... 22 3.1. Tool sample ... 22 3.2. Arena ... 22 3.3. Simul8 ... 24 3.4. IBM WebSphere business modeler advanced 7.0 ... 25 3.5. Progress savvion process modeler 8.0 ... 26 3.6. Tibco business studio community edition ... 28 3.7. ProM UITopia ... 29 3.8. Results summary ... 30 3.9. Related work... 32 3.10. Summary ... 32In this chapter a sample of tools that support process animation is presented. Each tool is then presented individually. In the end we use the taxonomy to evaluate each tool and compare the results of each tool to draw conclusions.
22 Marco Roque – July, 2014
3. Tools survey
3.1. Tool sample
Relevance, diversity and availability were the three basic criteria used in the tool sample selection. Relevance, in this context, stands for the availability of rich model animation features. We discarded tools that missed the description of those features in their online documentation. Regarding diversity, we tried to look at diverse origins, instead of limiting the survey to a limited target (e.g. just simulation tools) or modeling notation (e.g. just BPMN tools). Last, but not the least, availability had a considerable influence on our tool sampling process, since the only way to effectively evaluate a tool is by being able to obtain a fully functional version of it for a sufficient period of time. Several apparently interesting tools had only limited functionality trials or could not be obtained easily for evaluation in due time and therefore were discarded.
The chosen sample of six tools (see Table 16) meets the previous criteria. Since model animation features are used for planning, design, optimization and reengineering of real production, manufacturing, logistic or service provision systems that can be found in most medium to large size companies, it came as no surprise that commercial tools dominate this sample.
Table 16 - Tool sample
TOOL (VERSION) / PRODUCER NOTATIONS SCOPE
Arena (14) / Rockwell Automation Proprietary Simulation SIMUL8 (2012) / SIMUL8 Corporation Proprietary,
BPMN Simulation
WebSphere Business Modeler Advanced (7.0) / IBM BPMN Modeling Savvion Process Modeler (8.0) / Progress BPMN Modeling TIBCO Business Studio (Community Edition, 2012) /
TIBCO Soft. BPMN Modeling
ProM UITopia (6) / Eindhoven Technical University Petri nets, EPC,
BPMN Mining
Each tool will now be reviewed, in a separate subsection, regarding the aforementioned animation features. To facilitate the assessment exercise, an animation example is presented, which has a set of numbers placed on top of it, to identify model components animations. The evaluation scores are presented in the end of each subsection.
3.2. Arena
Arena is a general-purpose simulation tool that can be used in diverse systems, such as assembling lines and call centers. It has rich animation capabilities and is well-established in the marketplace, with several books dedicated to its usage (Altiok and Melamed 2007; Chung 2003; Kelton et al. 2002). It uses a straightforward proprietary notation where modeling constructs map easily to those described in chapter 2.2.1.
23 Marco Roque – July, 2014
In Figure 2 is possible to identify the queues (1) filled with several process instances on top of an activity, as well as the process instances (3) that travel a sequence flow. It is also possible to see a global variable (6) exposed as a numeric value, a graphic representation (7) of a global variable and the combination of two variables in the same graphic. The resources (2) change the appearance according to its state, as seen in Figure 2, where two idle resources and a busy one are presented. On the other hand, activities (4) show only the number of process instances being processed.
Figure 2 - Arena animation example
Customization is also provided in Arena, by allowing the user to choose the animated figure for all components, except for activities and sequence flows. It is also possible to customize graphics for attribute/global variable presentation. For the activities it is only possible to customize the numeric values that are presented, by choosing which activity attributes should be presented. The assessment outcome for this tool is displayed in Table 17.
(1) (2) (2) (3) (4) (6) (7)
24 Marco Roque – July, 2014
Table 17 - ARENA evaluation scores Queue Resource Process
instance Activity Sequence flow Attributes and global variables Component animation 4 4 3 2 1 4 Animation customization 4 4 3 2 1 4
Speed controls Interaction controls Visualization controls
Interaction controls 4 4 4
3.3. Simul8
This is also a general purpose simulation tool. The evaluated version supports modeling with BPMN, but the animation capabilities were not as good as the ones that the tool provides for its proprietary modeling language, what lead us to choose the latter.
Figure 3 - Simul8 animation example
In Figure 3 the queues (1) are represented as a tank, together with a numeric value that shows the number of process instances waiting in the queue. The presentation used for resources is not for each
(2)
(1)
(3)
(4)