University Institute of Lisbon
Department of Information Science and Technology
A Machine Learning Approach for
Indirect Human Presence Detection
Using IoT Devices
Rui Nuno Neves Madeira
A Dissertation presented in partial fulfillment of the Requirements
for the Degree of
Master in Computer Engineering
Supervisor
Prof. Dr. Luís Miguel Martins Nunes, assistant professor
ISCTE-IUL
Resumo
A recente maior democratização da tecnologia contribuiu para o aumento da disponibilidade de dispositivos dedicados à melhoria dos nossos espaços de vivência e trabalho, capazes de controlo remoto pela internet e de interoperabilidade com outros.
É neste contexto que a detecção de presença humana é fundamental pois: permite a automatização de acções, a aprendizagem de padrões de uso, a detecção de problemas de doença ou intrusão, etc. Dispositivos específicos de detecção de presença normalmente tem falhas dependendo da sua natureza, e não costumam estar coordenados de forma a melhorar a performance.
Coordenar os aparelhos de forma a obter um nível mais inteligente de uso requer um outro dispositivo ou software capaz de comunicar e controlar os outros. A Muzzley é uma empresa que criou uma aplicação móvel onde os utilizadores podem registar todos os seus dispositivos e depois controla-los a partir do programa.
Esta dissertação propõe uma abordagem para a detecção de presença baseada na utilização de métricas extraídas das mensagens entre os dispositivos e a plataforma da Muzzley. A ideia é que a detecção não será feita por informação de sensores específicos mas sim pela analise de padrões de interacções com os dispositivos. Conjuntos de dados anónimos criados na plataforma serão submetidos a uma fase extensa de processamento de forma a criar atributos interessantes para o treino e teste de algoritmos de aprendizagem automática.
As contribuições principais deste estudo são os algoritmos de processamento construídos para a criação da informação relevante para a tarefa, a demonstração da capacidade do uso destas interações para a detecção de presença, e os métodos usados de forma a melhorar a performance da abordagem.
Palavras-chave: Detecção de Presença Humana, Inteligência Ambiental, In-ternet das Coisas.
Abstract
The recent increased democratization of technology led to the appearance of new devices dedicated to the improvement of our daily living and working spaces, capable of being remotely controlled through the internet and interoperability with other systems.
In this context, human presence detection is fundamental for several purposes, such has: further automization, usage pattern learning, problem detection (illness, or intruder), etc. Current intrusion detection devices usually have flaws depending on type and many times are not coordinated for better performance.
Coordinating the devices for higher level operation however requires a device, or software, that is able communicate and control them. Muzzley is a company that tries to solve this issue by creating a mobile application where the user can register all its devices and control them from there.
In this dissertation we propose an approach to human presence detection using metrics based on messages between devices and the Muzzley platform. The idea is that the detection does not rely on information from specific presence detectors, but that it is able to achieve its purpose by analyzing the patterns of interactions with the devices. For this, anonimyzed datasets created by the Muzzley platform are submitted to an extensive processing in order to create meaningful features that will then be used with a machine learning algorithm for training and testing. The main contributions of this study is the processing done to create meaning-ful information for the task, the demonstration of the capabilities of the interac-tions between these devices and platforms for human presence detection, and the methods used to improve the performance of the approach.
Keywords: Human Presence Detection, Ambient Intelligence, Internet of Things.
Acknowledgements
I would like to thank my parents and my family for all the love they gave me all my life, and for their efforts to provide me a comfort living that allowed me to develop myself as a human being and to focus properly on my academic path.
I would also like to thank my supervisor, Luís Nunes, for all his support and help in this project, and for all I learned from him in these months and in my time at ISCTE-IUL.
A big thanks to my friends from outside the university, their friendship was crucial for my social life and my personal development, allowing me to learn things from other areas and to have precious escapades from the academic work.
And finally, a very important thank you to everybody that worked beside me at the university during the thesis, since this kept us motivated and inspired through this hard and possibly lonely journey.
Contents
Resumo iii
Abstract v
Acknowledgements vii
List of Figures xi
List of Tables xiii
Abbreviations xv
1 Introduction 1
1.1 Motivation . . . 3
1.2 Objectives . . . 4
1.3 Scientific Contribution . . . 4
1.4 Structure of the Dissertation . . . 5
2 State of The Art 7 2.1 Home automation, Ambient Intelligence and Internet of Things . . 7
2.2 Human Presence Detection Devices . . . 9
2.3 Sensor Fusion . . . 9
2.4 The Concept of Time in a Sequence of Events . . . 10
2.5 A Unique Platform . . . 11
3 Data Processing 13 3.1 The Muzzley Platform . . . 13
3.2 Segmentation Engine . . . 15
3.3 Structure of the Raw Dataset . . . 17
3.3.1 user_reads . . . 18 3.3.2 user_writes . . . 19 3.3.3 device_updates . . . 19 3.4 Plugins Developed . . . 20 3.4.1 devicesPerUser . . . 22 3.4.2 loadEventsToDB . . . 24 3.4.3 presenceFromDevices . . . 27
Contents
3.4.4 changePropertyUpdates . . . 29
3.4.5 interactionStatsPerUser . . . 30
3.4.6 createMLDatasetGenStats . . . 33
3.4.7 createCSVsForPresence . . . 36
3.5 Non Processed Schemas . . . 38
4 Initial Experiments and Exploration 39 4.1 Initial Exploration . . . 39
4.2 Machine Learning Scripts created . . . 41
4.2.1 fullAlgorithm . . . 41
4.2.2 usingSavedConfig . . . 42
4.3 Initial Scikit-Learn Experiments . . . 43
4.4 Feature Selection . . . 49
4.5 Addressing the Imbalance Issue . . . 51
4.6 Results Exploration . . . 55
4.7 Exploration with Other Algorithms . . . 61
4.8 Parameter Search . . . 63
5 Final Experiments 65 5.1 Not Excluding Information from the Metrics . . . 66
5.2 Excluding Messages Used to Generate Presence Information from Metrics . . . 70
5.3 Using more data . . . 72
5.4 Conclusions On The Final Experiments . . . 73
6 Conclusions 75 6.1 On the Development of the Project . . . 76
6.2 On the Results Obtained . . . 77
6.3 Future Work . . . 78
List of Figures
3.1 Overview of the interactions in the Muzzley ecosystem . . . 14
3.2 Muzzley device hierarchy . . . 14
3.3 Sequence of the processing plugins . . . 21
3.4 Component interactions . . . 21
3.5 Partial example database document for the devicesPerUser plugin . 22 3.6 Partial example database document for the loadEventsToDB plugin 25 3.7 Partial example database document for the presenceFromDevices plugin . . . 28
3.8 Partial example database document for the changePropertyUpdates plugin . . . 30
3.9 Partial example database document for the interactionStatsPerUser plugin . . . 31
3.10 Partial example database document for the createMLDatasetGen-Stats plugin . . . 33
3.11 Example database document for the createCSVsForPresence plugin 36 4.1 Example of generated tree structure . . . 57
4.2 Violin graph of the number of different schemas between devices users own vs number of correctly predicted instances . . . 58
4.3 Violin graph of the totalAvgDay metric vs number of correctly pre-dicted instances . . . 59
4.4 Violin graph of the totalCountHalf metric vs number of correctly predicted instances . . . 59
4.5 Violin graph of the total number of devices users own vs number of correctly predicted instances . . . 60
List of Tables
4.1 Features used in first two results that will be presented . . . 45 4.2 Classification report using non-continuous events for labeling not
excluding any information from the metrics . . . 46 4.3 Confusion matrix for the same scenario of Table 4.2 . . . 46 4.4 Classification report using non-continuous events for labeling and
excluding information used for labeling from the metrics . . . 46 4.5 Confusion matrix for the same scenario of Table 4.4 . . . 46 4.6 Classification report using continuous events for labeling and not
excluding any information from the metrics . . . 47 4.7 Confusion matrix for the same scenario of Table 4.6 . . . 47 4.8 Classification report using user_NDI for labeling and not excluding
any information from the metrics . . . 48 4.9 Confusion matrix user_NDI not excluding for the scenario of Table
4.8 . . . 48 4.10 Top feature importance values of some of the initial results
accord-ing to the Random Forest algorithm . . . 50 4.11 Comparison of classification reports for several techniques to cope
with the imbalance problem . . . 54 4.12 Comparison of classification reports using different classification
List of Tables
5.1 Results for each type of dataset obtained using 70% for training with down-sample and 30% for testing using the window based approach and without excluding any information from metrics . . . 66 5.2 Results for each type of dataset obtained using 70% for training with
down-sample and 30% for testing using the event based approach and without excluding any information from metrics . . . 67 5.3 Top feature importance values of the not excluding section
accord-ing to the XGBoost algorithm . . . 69 5.4 Results for each type of dataset obtained using 70% for training with
down-sample and 30% for testing using the window based approach and excluding messages used to gather presence from metrics . . . . 70 5.5 Results for each type of dataset obtained using 70% for training with
down-sample and 30% for testing using the event based approach and excluding messages used to gather presence from metrics . . . . 71 5.6 Top feature importance values of the excluding section according to
the XGBoost algorithm . . . 72
Abbreviations
AdaBoost Adaptative Boost (see page 61) AVG AVeraGe (see page 46)
IoT Internet of Things (see page i) RGB Red Green Blue (see page 15)
SMOTE Synthetic Minority Over-sampling TEchnique (see page 53) SVC Support Vector Classifier (see page 41)
Chapter 1
Introduction
Human presence detection is an ongoing challenge in several scenarios and appli-cations, one of them is in ambient intelligence and home automation. This project intends to create a system able to infer about presence using general information and statistics of usage and interaction with different types of devices.
Ambient intelligence in computing refers to technology that is non-intrusively integrated in an environment, doesn’t need user intensive interaction, and adapts, in an automated way, to the necessities of each user and context. The goal of this technology is the creation of complex systems with simple interfaces that enhance the quality of our daily lives [1] [2] [3].
In order for this vision to become a reality, several authors have pointed out certain attributes that the systems need to have [1] [2] [3] [4]:
• Integration, the devices should be embedded in the environment in a perva-sive but non-intruperva-sive way.
• “Awareness”, the technology must be able to understand its context in order to correctly interact with it.
• It should be tailored to the needs of each user, and be able to adapt to their behaviour changes and external factors.
Chapter 1. Introduction
• It should be able to predict the activities and needs of the users.
• And distributedness, several devices and systems should be connected and exchange information, but in a way that the failure in one of the network nodes does not lead to a total system failure.
Internet of things (IoT) is the network of physical objects with electronics, software, sensors and connectivity capabilities that allow these devices to commu-nicate with each other and to exchange information. Because they are connected in a network, the devices can be interacted and monitored remotely from another point in the network. By joining the information of each device, and through the interaction of each device with its environment, we are able to build complex systems, with better precision, that may enhance our quality of life [5] [6] [7] [8] [9].
The previous concepts are connected, the internet of things is a technology that enables the creation and improvement of more complex ambient intelligence systems. A network of several devices of different types and purposes is a fun-damental tool to understand the context in which the system is operating. The fusion of information from the devices is very important to decide which actions to carry out, and through the combination of the actions of several devices the system can cooperate with the user and fulfill his needs.
Sensor fusion is the combination of information from several sensors in a way that the end result has more quality and precision than the information of each single one. It is a fundamental concept in ambient intelligence, and in a lot of other areas such as robotics. In order to be able to understand the needs of its user and context, an ambient intelligence system has to structure and process very efficiently the data it receives from its device so that quantity is also quality [10] [11].
Home automation can be seen as an instantiation of the concept of ambient intelligence in which the environment we want to “make intelligent” is a residence,
Chapter 1. Introduction
and the functions we want to control and monitor are the temperature, the venti-lation and humidity, the energy consumption, the garden sprinklers, etc.
1.1
Motivation
The problem this project intends to address is related to this vision of ambient intelligence for personal residences. Nowadays is increasingly common to have one or more devices related to this area on our houses. [11] predicts that before 2020 the internet of things will be comprised of more than 50 billion devices. Even today there are quite a few different devices available in the market for a lot of different purposes. Good examples are thermostats, humidity controllers, carbon dioxide sensors, motion sensors, door sensors, etc.
A problem with these devices is that each manufacturer company has its way of communicating and programming its device. Muzzley is a Portuguese company established in 2012 with the purpose of the creating a mobile application and a platform that allows for the interaction with all types of devices, independently of their brand, from a single system. The application has been evolving and nowa-days it boasts of more advanced functions, related to ambient intelligence, such as coordinating the registered devices through programmed rules or behaviours learned from the information received from the devices and user interactions. It is in this context that human presence detection becomes an important thing.
The information about human presence at home is interesting for several rea-sons:
• Allows the automation of several actions such as turning on the lights when someone arrives, turning off when they leave, turning on the kitchen auto-matic cooking robot, turning on the smart sockets, etc.
Chapter 1. Introduction
• Allows the learning of user routines, since it is fundamental to know when a user is at home or when he is simply interacting with the devices remotely. • Can help detect behaviour anomalies related to health conditions.
Specific and high fidelity detectors however are usually expensive for domestic use. The more affordable devices have limitations, for example a person sitting down on a couch will not be detected by a regular motion sensor. Besides this, some devices may not be precise enough on their own.
1.2
Objectives
The idea of this dissertation is to process the data generated from interactions between the user, the devices and the Muzzley platform in order create general metrics, not related to each device usage or characteristic, like for example average number of interactions per day, or number of interactions in the last half hour. And then use them to train machine learning models for presence detection. The information to be used comes from every device possible, even if it isn’t explicitly direct to presence, because the idea is to do an indirect detection based on usage and behaviour patterns of the devices available in the house.
The point is that if this proves to be a good method, it will allow to infer information about presence for users that don’t have presence related sensors. And may increase the overall fidelity of houses equipped with presence detectors compensating for the inherent flaws of each type of sensor.
1.3
Scientific Contribution
This dissertation presents the following contributions:
• reviews state of the art projects in the area of ambient intelligence and internet of things related with the presence detection problematic.
Chapter 1. Introduction
• creates and fully describes an approach to process data from a system that monitors and controls several types of IoT devices with the intent of gener-ating features for machine learning classification.
• presents the potential capabilities of the generated data used with machine learning algorithms for human presence detection.
• Elaborates on the techniques and processes used for result exploration and to improve the scores of the machine learning classification.
• provides conclusions on the approach reasoning on future work and imple-mentation possibilities
Part of the work present in this document is based on the final report delivered for the Introduction to Research in Engineering course of the Master in Computer Engineering, titled: "Human Presence Detection in Ambient intelligence Systems Without relying on Specific Sensors".
The work conducted in this dissertation resulted in the following publication: R. Madeira, L. Nunes, (2016), "A Machine Learning Approach for Indirect Hu-man Presence Detection". Proceedings of the International Conference on Digital Information Management, 2016, Porto. In press.
1.4
Structure of the Dissertation
In Chapter 2 we present projects related to this one stating their contributions and declaring their similarities and differences with this dissertation. In Chapter 3 the Muzzley platform is described, the raw dataset contents are explained and the processing used to generate the feature and the new csvs for machine learning are described in depth. Chapter 4 begins by explaining the machine learning scripts and tools used, it then presents the initial results obtained. After this several sections about exploring the results and improving the scores follow. Chapter 5
Chapter 1. Introduction
in Chapter 6 conclusions are drawn on the results obtained and the developing process of this dissertation.
This study followed the Design Science Research method [12] [13]. For further description of the phases applied in this case refer to the document presented for the Introduction to Research in Engineering course. Described briefly, the dissertation started with the identification and motivation behind the objective. The objectives were presented and now will continue to be elaborated upon, along with the state of the art. Chapters 3, 4 and small details of 5 concern the design and development phase, where the developed plugins, machine learning scripts and improvements are described. Chapter 4 and 5 are the demonstration and evaluation stage. And finally, this document along with the published paper serve as the communication step.
Chapter 2
State of The Art
2.1
Home automation, Ambient Intelligence and
Internet of Things
In recent years the increased general availability of computing technology, the decrease in size of powerful devices of this area, the easiness of implementation of network infrastructures, the practical advances in artificial intelligence and the familiarization of people with these new technologies, has led to an increase in the accessibility of devices related to ambient intelligence and internet of things to the general audiences [3] [14] [15]. The main devices that can be found in common technology stores are light bulbs, capable of network connection and being remotely controlled. Sensors, like thermostats, carbon dioxide sensors, motion sensors, etc. And surveillance cameras with network connection.
The increased presence of these devices, that are easy to install and start to use, without the need for large infrastructures to support them, with the possible of coordination between them through third party products, have made “tradi-tional” home automation systems less popular. Examples of “tradi“tradi-tional” home automation systems are the central heat control, intelligent shutters, intrusion de-tection, gas leak detector, etc. The popularity of these new devices has however
Chapter 2. State of The Art
stores dedicated to the area, offering great quality products, and also house which are built with home automation in mind [16].
Because of this there has been lot of interesting work in the area of ambient intelligence for home and work spaces that by fitting the environment with differ-ent types of these devices, with differdiffer-ent purpose, aim to reach the technological visions for this area. One of these projects is Dream Green House [17], which has the goal of creating the world’s most intelligent house, but also focusing on ecology. The project consists of a series of subprojects, each one focusing on one aspect to improve the house, for example, a module to control energy consumption, an-other for temperature control, luminosity control, water consumption monitor, etc. The house continues being developed, as new technology arises in the area, new functionalities are structured and implemented and older modules are updated.
A system, built using Linux, Java and a Raspberry Pi serves as the main controller of the devices placed in the house, receiving information from the other devices and systems. In 2013 [18] developed a presence detection system at a room or zone level for the house. This system infers about presence by using a large quantity of information gathered from several sources. The type of data used and its source may indicate presence explicitly, such is the case for pressure sensors placed in beds and chairs, or implicitly, in the case for example of the detection of network traffic coming from a PlayStation system.
Another example of house that implements these technologies is the Gator House [19], which has the objective of creating a smart home that can help and monitor the daily life activities of the senior population or people with special needs. The house has a lot of systems and functionalities, such as smart pantries and fridges that can create automatic shopping lists, smart ovens, smart sockets, pressure sensors on the floor, etc. One of the most interesting contributions of the project is the creation of a model of architecture of middleware to control and coordinate all the systems implemented in the house. This model is structured in layers, the base layer has to do with the raw data produced by the devices,
Chapter 2. State of The Art
and then, progressively through the layers the system becomes more complex and abstract in the sense of the created information.
In [20] the authors describe a system that joins information from several sen-sors, using Bayesian networks and Markov chains to reduce each sensor noise, in order to detect human presence. The system was built by layers and receives information from devices such as thermostats, door sensors, and cameras. Its ca-pabilities were tested by using it to monitor an office in the University of Palermo.
2.2
Human Presence Detection Devices
The goal is to create a system that can detect human presence without relying on specific detection devices. However, to build the system and to better under-stand the results that will be obtained it is important to know which devices are available that focus specifically on detection, and what are their capabilities and weaknesses. In [21] the authors do a survey on available methods to detect pres-ence and other related concepts such as occupancy, the number of people present, and the identification of each person. They also explain the physical traits used by the devices to infer about these concepts. Then the devices are classified according to the attribute they use to operate. The authors also refer some work related to sensor fusion. The survey ends with a summary on the capabilities of each type of device and conclusions for the area, one of which is the importance of the creation of sensor fusion systems, on a greater scale and complexity, in order to solve these problems with better precision.
2.3
Sensor Fusion
In addition to those described in [21] there are a lot more projects related to sensor fusion to solve presence detection problems and other related issues such as person tracking and identification. For example in [22], Bayesian networks and Markov
Chapter 2. State of The Art
chains were used to join the information from several sensors in order to detect people and track their movement. An interesting aspect of this project is that they used Gaussian probability distribution functions to model the information gathered from each sensor by varying the average and covariance of each function according to the properties of the sensor.
In [23] the authors used a Kalman filter to join the information from the Wi-Fi module, magnetometer, gyroscope and accelerometer of a smartphone with the purpose of tracking a person’s movement on a known space. Initially sensor fusion was thought to be more important for the project since the approach was different than the present one that focuses on the interaction statistics instead of sensor values, but these projects continue to be relevant as state of the art.
2.4
The Concept of Time in a Sequence of Events
Another important aspect for this problem and area, is the usage and processing of data related with time. There are many ways to model information about time: timestamps, offsets of time between events, time windows of varied size, etc. The authors of [24] studied several ways identification and segmentation of human activities in video and motion capture files. An interesting conclusion is that in this case the usage of a time window is not the best way to solve the problem.
In [24] it’s described a way to process time series, in real time, using a hier-archical tree structure. This algorithm seems interesting for this type of problem since the devices involved generated a lot of data in short time. The authors in [25] have done an extensive analysis of the usage of different types of clustering algorithms on time series data.
Chapter 2. State of The Art
2.5
A Unique Platform
This project however is so far unique and quite different from the others discussed before. A lot of different types of devices from different companies interact in the Muzzley platform. Each one with its details on the way it works and communicates with its manufacturer platform and with Muzzley. Besides this, the system should work in every house and every user, instead of most of other projects that focus on a specific house and, or, type of user. The system must also behaviour correctly independently of the environment on which the user decided to use the devices, and independently of the way the devices are located in the space. And finally, the system must be able to adapt to each user daily life habits and learn his patterns of device usage.
Chapter 3
Data Processing
3.1
The Muzzley Platform
Muzzley is an application for mobile devices that allows the control and monitoring of devices from different manufacturers in a single system. A user just has to register his devices in the application, he then has access to a user interface suited to each type of device that allows interaction with its properties.
For this to happen the device manufacturer has to integrate his devices with Muzzley. This can be done cloud to cloud, in the case of manufacturers who already have a built platform to support their devices, or cloud to device using Muzzley’s own platform to interact with the device. To do the integration the manufacturer has to provide information about the type of integration, interfaces or HTTP URLS needed, etc. Then he has to define an ontology that establishes the properties and components of its devices, and the relationships between them. A user interface used to interact with the device must also be provided, a pre-defined one can be used or a new one using HTML and CSS can be created. This is what the application will use when navigating to the device page.
Chapter 3. Data Processing
Figure 3.1: Overview of the interactions in the Muzzley ecosystem1
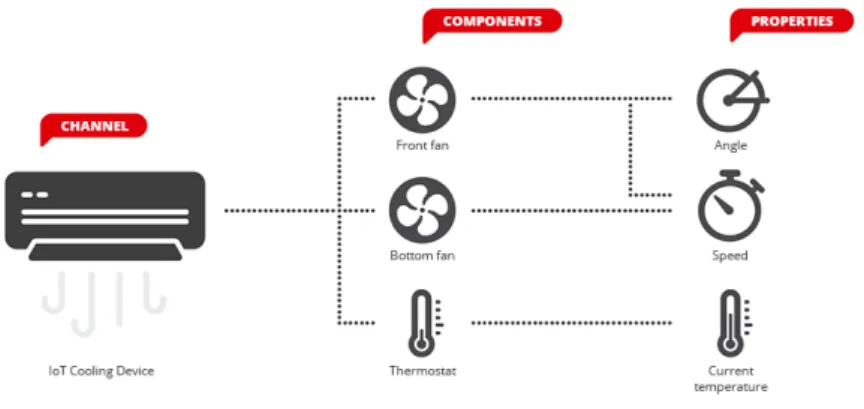
The manufacturer must also define its device hierarchy. This is used by Muzzley in order to have its own way of identifying the devices and their properties without relying on each company’s identification method, since that would be very difficult to integrate and would probably lead to conflicts. The hierarchy in the Muzzley platform is composed by profile: this is an identifier for a type of device, for example a light bulb or a thermostat. Channel, a unique identifier for a certain concrete device. Component an identifier for a certain component of a device, for example a cooling system with more than one fan, each fan is a component. And property the identifier for a certain property of a component, in the cooling system example it could be the speed and angle of the fan.
Figure 3.2: Muzzley device hierarchy2
To communicate with the manufacturer clouds and the devices Muzzley uses a set of JSON schemas that specify the structure and type of data the messages between these entities uses. So the manufacturers must also specify for each prop-erty which type of schema it uses. For a color light bulb this could be for the
1https://www.muzzley.com/documentation/images/integration_assets/_img1.png 2https://www.muzzley.com/documentation/images/integration_assets/_img5.png
Chapter 3. Data Processing
example the colour-rgb (Red, Green, Blue) schema that indicates that, aside from other fields, the messages would have the r, g, and b fields with a value between 0 and 255.
Muzzley also has an automation engine that allows the users to set up rules that control the devices. These rules can use a lot of different events as triggers: time, location, properties of other devices, etc. And can then actuate changing the properties of others devices. These rules capability comes straight out of the box only requiring the user to set up the rules or to adopt some already pre-defined ones.
3.2
Segmentation Engine
The Muzzley system generates data related to the messages interactions between the user application and the platform, and then between the platform and each de-vice manufacturer systems when this applies. The quantity of messages generated by the platform in a short period of time is quite big, and so gathering and storing this information is also a challenge. In order to facilitate this process Muzzley has developed a program called Segmentation-Engine. This program can listen to the messages being transmitted, and operate on them. It stores the messages, filtering and, or, masking some fields if necessary, and compress the information if needed. It can also calculate metrics from received messages or saved datasets, delete saved information according to some parameters, etc. The program was built to do this continuously, while listening to messages or new dataset entries, serving as an automated dataset creation tool.
The Segmentation-Engine is a program written in Python, that uses a lot of libraries and operates using other applications such as the Redis and Mongodb databases. The program is used through the command line and it has 3 main functions. Schema operations, regarding actions on locally stored schemas. The datasets operations, for the creation of a dataset, to append information to an
Chapter 3. Data Processing
existing one, or to clear datasets. And the metrics operations to do calculations and create new data based on the stored datasets.
To create the datasets the program listens to the Muzzley platform and stores the captured messages in csv files. Options can be applied to these operations such as type of messages to store. Details on these types on section 3.3. A list of fields to exclude from the dataset. And masking so that the ids present on the dataset aren’t the ones used in the real application messages.
The metric operations are the crucial part for the data processing phase of this project. These allow the creation of new information by reading the stored datasets and do calculations on them. In order to do this new parts of the program, called plugins, can be developed, each corresponding to a new metric. Each metric has a configuration that defines if it is active, which types of schemas from each dataset it has access to, etc. The program can then run a metric, a list of them, or all of them. If the metric needs to access a csv dataset the Segmentation Engine already is prepared to deal with this abstracting the reading of the datasets and saving on a Redis database the files and lines that were already processed. In case the plugins need access to a MongoDB database the program also facilitates this procedure.
The program also has a set of production services, and more may be added in the future. These are deployment configurations that can easily be used to run the program with a specific purpose. One of them is the muzzley-dataset-writer a configuration that keeps the Segmentation Engine running, listening to the messages sent in the Muzzley platform and creating datasets based on them. This is the process responsible for creating the initial sets for this project.
The data created will then undergo a processing phase to create the features and information that will serve as input to the machine learning algorithms. This phase was done by developing plugins for the Segmentation Engine that will cal-culate the necessary metrics. These plugins use both the Redis database when reading from the stored datasets and the MongoDB database to store new metrics
Chapter 3. Data Processing
and be able to correlate metrics and calculate new ones. Developing these algo-rithms within the Segmentation Engine however puts some constraints on them, mainly they have to be ready to work with stream-like data, because the program is prepared to handle data this way.
Developing the plugins in Python, a language we didn’t have previous expe-rience with, and building the algorithms in accordance with the Segmentation Engine structure meant an initial adaption phase with slower development. In retrospective this paid off, because there was the opportunity to learn a new pro-gramming language, that is very suited for the jobs of data processing and machine learning, also the created plugins follow the Segmentation-Engine way of operation so in the future they can be easily integrated for other purposes or built upon to improve this project.
3.3
Structure of the Raw Dataset
The messages from a “raw” dataset are divided in three types: messages from the application to the device in order to obtain its state called user_reads, from the application to the device to change its state named user_writes, and the messages from the device to the whole platform in order to signal a state change called device_updates.
The Segmentation Engine stores the data in csvs in folders. Inside the main folder there are 3 subfolders that correspond to each type of dataset. Inside each one of these there are subfolders for each type of schema. The schemas, as de-scribed before, are related to how each message should be composed depending on the property it refers to. So there are folders for color-rgb, of, for example, light bulbs, for brightness, for battery levels of certain devices, etc. Inside these folders there are csvs, one per day, where each line correspond to a captured message.
Chapter 3. Data Processing
3.3.1
user_reads
These messages concern direct requests from the application or the platform to a specific device in order to obtain the value of one of its properties. These requests might be triggered by the user, for example opening the application, or by the rules module if it needs to know a property at a certain time. The response to this request with the value of the property is given directly and is not part of the device_updates data set, this also means that response is not gathered by the Segmentation Engine, and so values of properties must be learned from the updates or the writes.
These messages contain information about the ids and names of the device hierarchy to which the request is sent, and all other related information, such as property classes, schema, etc. It also contains information about the time of generation of the message in the timestamp field, the user_id corresponding to which user generated this message and the trigger field, that marks if this message was generated by a user or a rule.
This and the next type of dataset, user_writes, also have an additional special field that will be called user_NDI (non-disclosed information). This field contains special information that won’t be disclosed in this document. The information was gathered from users who agreed to help this project, allowing for the data collec-tion, and it was only handled by Muzzley. The idea is that with this information some more realistic datasets can be created, however it is still very different from having explicit time information about when there was presence at home.
Muzzley’s insight was that these read messages were the least important for this project since that they don’t always mean a direct interaction with a device or the platform. They will however be very important to have data about the user and his devices. Regardless of this, the messages will also be present in the rest of the processing because they might contribute for the presence detection.
Chapter 3. Data Processing
3.3.2
user_writes
These messages are instructions, generated by the user or a rule, to a device in order to change the value of one of its properties. They are very similar to the user_reads messages, but have some fields more depending on the schema of the message. For example, if the message is for an rgb coloured light bulb to change its colour then it will have the additional r, g and b fields. Like the user_reads, these messages have important information about the users and their devices. They also might contribute a lot for the detection problem, since they are specific requests for a property change, and the trigger field will also tell if these were done by a user or by a rule.
3.3.3
device_updates
These messages are quite different from the other types, they are sent throughout the platform and inform the concerned entities, a user application for example, about the value of a device property. Because they inform the value, these messages have, like the user_writes, more fields depending on the type of schema. However, since these don’t originate in a user application, they don’t have the user_id.
Because of not having a user_id field, each message will have to be mapped to one, or several users. But this is a fundamental step since these updates may give a very good insight in terms of presence detection. Another problem with the dataset is that the updates are generally periodic, or originated by a property change. This means that devices who broadcast their status frequently will generate a lot of information that maybe won’t be as useful, and the same is true for devices who change their properties very frequently, like for example, thermostats or weather stations because of fluctuations in temperature, atmospheric pressure, etc.
Chapter 3. Data Processing
3.4
Plugins Developed
As described before, because of the nature of the generated data, the Segmentation-Engine is prepared to work in a stream like way. In order to continue this paradigm the developed plugins must be prepared to be able to process stream-like data in-stead of batch-like which puts some constraints on the complexity and efficiency of some algorithms. Clearly some algorithms could have an overall better structure, and some parts could have being developed in a more efficient or clear way.
Adding to the requisites described, the quality of the code also suffered because the developing was more incremental than completely planned from the beginning. The reason for this is that more insight on the problem was gained from work-ing on it, and also due to the new fields added to the data durwork-ing development, requested after the initial analysis of the results. And thus, more functionalities were interesting to add to the plugins, increasing their complexity. Regardless, the overall quality of the plugins is good and the processing can be completed in a reasonable time window.
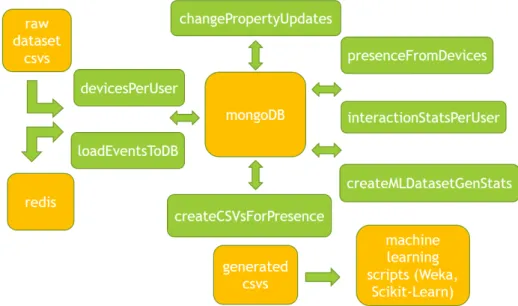
The next diagram shows the flow of information between algorithms, evidenc-ing also their order. Next to each a brief summary of its functions can be found:
Chapter 3. Data Processing
Figure 3.3: Sequence of the processing plugins
The next diagram shows each plugin according to its interactions with other components:
Chapter 3. Data Processing
A detailed description of the plugins will now follow, along with implementation decisions, objective and possible parameters.
3.4.1
devicesPerUser
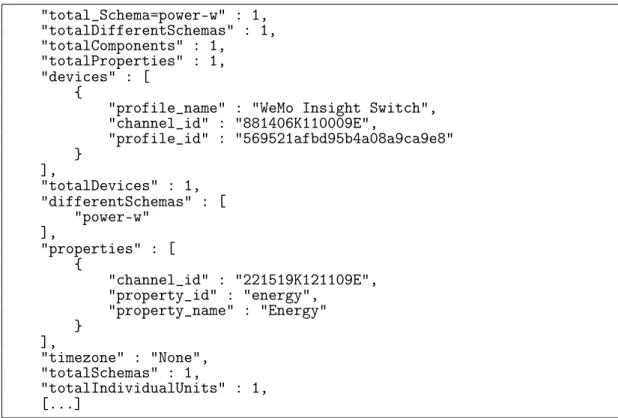
This plugin iterates through the dataset types that have information about user_ids, that is the user_reads and writes. The objective of this plugin is to create infor-mation per user about its devices, including the devices hierarchy. The algorithm will create a document with fields like, number of devices, number of components, the complete device hierarchy of that user, different schemas used by these devices, etc. This document will then be inserted in MongoDB.
Figure 3.5: Partial example database document for the devicesPerUser plugin "total_Schema=power-w" : 1, "totalDifferentSchemas" : 1, "totalComponents" : 1, "totalProperties" : 1, "devices" : [ {
"profile_name" : "WeMo Insight Switch", "channel_id" : "881406K110009E", "profile_id" : "569521afbd95b4a08a9ca9e8" } ], "totalDevices" : 1, "differentSchemas" : [ "power-w" ], "properties" : [ { "channel_id" : "221519K121109E", "property_id" : "energy", "property_name" : "Energy" } ], "timezone" : "None", "totalSchemas" : 1, "totalIndividualUnits" : 1, [...]
The plugin starts by doing a query to its correspondent collection in MongoDB to see if there are already users in the database. Then it starts to use the Seg-mentation Engine built in capabilities to iterate through the stored csv datasets, skipping the device_update dataset because this one doesn’t have user_ids and 22
Chapter 3. Data Processing
thus is not useful. Per each message iterated the plugin will use the user_id present to find in the dictionary if there is already that user, if there isn’t, it cre-ates a new user, which is also a Python dictionary, with that id and certain count fields such as totalDevices, totalSchemas, set to 0 and list fields, such as devices, differentSchemas, etc. empty. Then it will check if there is timezone info for the present user, if there isn’t and the current message has a timezone, it will assign that timezone to the user as another field in the user dictionary.
Then the algorithm will check the current user individual units list. This is a list of dictionaries each one corresponding to a unique device to the property level in the Muzzley hierarchy. So each dictionary has profile_id, channel_id, component_id, property_field and schema field. The idea is to see if the current source from where the message came has already been assigned to this user, this is done checking if there already is a dictionary on the list with the ids present on the message, if there isn’t, one is created and added to the list.
If there is already such item on the list the algorithm will continue to process messages since nothing more is to be added to the user. However if the individual unit is new for this user, the plugin will continue by checking the similar lists, devices, components, properties, to see if that id has already been mapped to this user, and if not creating dictionaries with the correspondent id and the channel id. For example adding the current message component_id and channel_id as fields of a dictionary in the components list.
It will also use profile, component and property labels to add counts to the user dictionary, for example for a light bulb message being processed it can add a plus one count to the total_Comp=bulb field of the user. The schema is also added to a list of different schemas if it isn’t already there.
A user that was modified in this run of the algorithm is marked has changed and in the end the user list will be iterated in order to update the database with the new users info. This is an implementation decision made to avoid updating the database each time new information is added to a user. This works well, however because the plugin takes some time to iterate through all messages when
Chapter 3. Data Processing
the dataset is big, for example 1 hour for a month long data, additional methods should be added to the plugin to save the new gathered information periodically in case there is a problem during the run.
3.4.2
loadEventsToDB
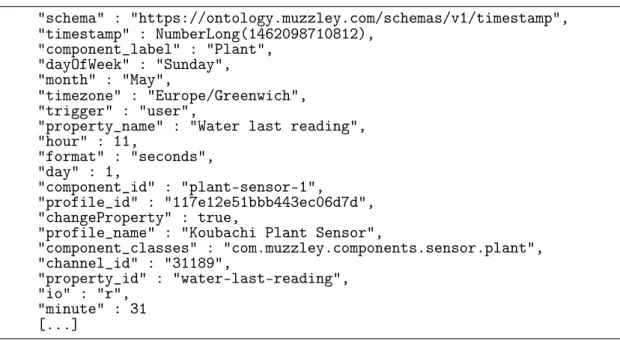
The main idea of this plugin is to insert into MongoDB all of the events of all types of a dataset, so that it’s easier to do queries and create information in other plugins. The algorithm also does some more things: the device_updates type of messages don’t have the user_id in then, so using the information created by the devicesPerUser it can, according to the profile, component and property id, map a user_id to each device_update message. This plugin also uses the timezone information of each user, retrieved in the devicesPerUser, and then using the timestamp of each message it can calculate the date of the message. This is very important to create usage statistics. Finally it is very interesting for the presence problem to know which update occurred without a previous user_write message, because this indicates that either it changed by itself, ex: the value of a thermometer, or it changed because of a manual interaction, ex: the user turned the light bulb manually so he has to be at home. Comparing the values and timestamps between user_writes and device_updates messages the algorithms is able to mark which update was due to a user_write.
The plugin starts by doing a query to the devicesPerUser collection in Mon-goDB in order to retrieve every user we have information so far, and maps these users to a python dictionary using the user_id as key. Then it starts reading the stored user_reads dataset and generates a dictionary from each message, with each field with its correct type, and extra time related fields, minute, hour, day of week, calculated using the message timestamp and the user timezone, if one is known in the devicesPerUser information.
After processing the user_reads dataset the algorithm moves to the writes and updates since for this implementation these have to be processed together. Write 24
Chapter 3. Data Processing
Figure 3.6: Partial example database document for the loadEventsToDB plu-gin "schema" : "https://ontology.muzzley.com/schemas/v1/timestamp", "timestamp" : NumberLong(1462098710812), "component_label" : "Plant", "dayOfWeek" : "Sunday", "month" : "May", "timezone" : "Europe/Greenwich", "trigger" : "user",
"property_name" : "Water last reading", "hour" : 11, "format" : "seconds", "day" : 1, "component_id" : "plant-sensor-1", "profile_id" : "117e12e51bbb443ec06d7d", "changeProperty" : true,
"profile_name" : "Koubachi Plant Sensor",
"component_classes" : "com.muzzley.components.sensor.plant", "channel_id" : "31189", "property_id" : "water-last-reading", "io" : "r", "minute" : 31 [...]
messages are read, events for them are created, like in the reads, and they are stored in a buffer. When the buffer is full, its length is a global variable, the algorithm iterates through the updates and checks if the element in the middle of the writes buffer has a lower timestamp than the current update message, if so half of the buffer is flushed inserting the write events in the database and loading new ones. When the middle element timestamp is no longer lower the algorithm will process the current update event.
Processing the current event has two phases, first the plugin searches the writes buffer to see if there is a write to the same device property, meaning profile, channel, component and property id between messages has to be the same, with at most a 4 minute time difference. If so, this means the current update event was caused by a write message, a trigger field is created on the update with the write message trigger and a user_id field with the corresponding user id. 4 minute is a heuristic defined time frame, discussed with Muzzley that is used in order to take into account delays in the network, delays while gathering messages and delays of the device generating the update. An update event is appended to a list per correspondent write message found.
Chapter 3. Data Processing
In the second phase the algorithm goes through the devicesPerUser information and if the corresponding profile, channel, component and property of the message matches a unit in a user information then an update event is appended to a list with that user id, but this time with a trigger that marks it as an independent update. This is only done if this user id was not already gathered in the first phase. Finally time information is calculated for the created events using the time zones of users mapped to these events and the events are inserted into the database.
The plugin does this until there are no more write messages to process. Then it checks to see if there are more update datasets to process, since a lot of schemas present in the updates are not present in the writes, and if so it process those events. The implementation decisions in this algorithm rested in how to best do the search for write messages related to update ones. Other possibilities instead of the writes buffer used are inserting immediately the write messages and then do a query to see if there is a match. Or inserting all messages and then in the end do queries and change the update messages that got matched. Both alternatives rely on query times to be effective, which means creating and updating indexes. For large number of messages to process the solution implemented or the second alternative are probably the best since they don’t require constant queries and index updating. However, even with the chosen approach, indexes had to be created anyway because of queries done in other plugins.
The possible parameters for this plugin are the length of the write events buffer and the bulk insert limit. The bulk insert limit is the number of inserts to the database done at once. This batch like insert type was adopted to try to further speed up the algorithm. After the algorithm run indexes are created for the user_id, timestamp, and user_NDI fields in this collection since these will be heavily queried in other plugins.
Chapter 3. Data Processing
3.4.3
presenceFromDevices
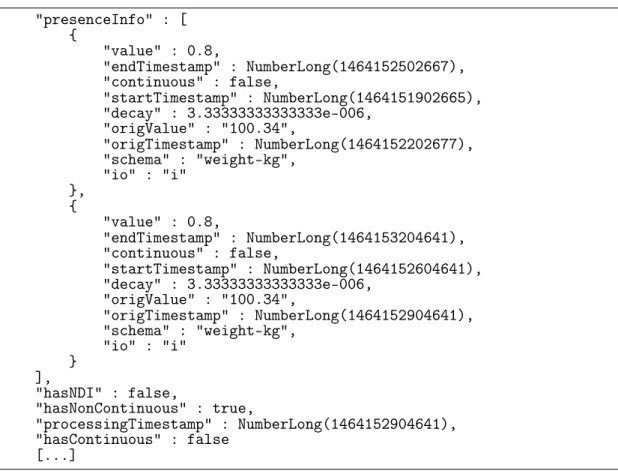
This plugin is responsible to collect events that give information about presence. This information is a mixture of heuristics, for example device_updates from light bulbs that were independent, this probably means that the user is home. And sensor information, for example cameras with motion sensors. The plugin creates this information by doing a set of queries to the loadEventsToDB collection, and then generates a document per user with lists of events that each have a window of time and a value between 0 and 1 that correspond to certainness of presence. The events are divided in two types: continuous, gathered from devices like alarms which their state give a continuous source of presence information, and non-continuous like motion sensors or light bulb interactions which have a time window, heuristically defined, in which the occurrence of the event is relevant.
Adding to this information some users were given a chance to contribute with the user_NDI field. With this, additional presence information can be gathered in certain conditions and better tag the datasets.
As with the devicesPerUser this plugin starts by doing a query to its own collection in the database to retrieve the users that are already there. Then it does a list of queries to the loadEventsToDB collection, each one corresponding to a specific type of event we want to gather presence information from. The results of each query are passed to a function that processes them, accepting as parameters the results, the collection of users, the type of dataset, the name to give to this presence information, the presence value, the time window and if it’s a continuous event.
This function will iterate through the results skipping those already processed according to saved timestamp, if information is already present for the user_id of the current result it will retrieve that user document from users dictionary, otherwise it will create a new user. Then it will create an event for this result, saving the original timestamp, the schema, the original value, and if it is a contin-uous event. It then creates an identifier using the profile, channel, component and
Chapter 3. Data Processing
Figure 3.7: Partial example database document for the presenceFromDevices plugin "presenceInfo" : [ { "value" : 0.8, "endTimestamp" : NumberLong(1464152502667), "continuous" : false, "startTimestamp" : NumberLong(1464151902665), "decay" : 3.33333333333333e-006, "origValue" : "100.34", "origTimestamp" : NumberLong(1464152202677), "schema" : "weight-kg", "io" : "i" }, { "value" : 0.8, "endTimestamp" : NumberLong(1464153204641), "continuous" : false, "startTimestamp" : NumberLong(1464152604641), "decay" : 3.33333333333333e-006, "origValue" : "100.34", "origTimestamp" : NumberLong(1464152904641), "schema" : "weight-kg", "io" : "i" } ], "hasNDI" : false, "hasNonContinuous" : true, "processingTimestamp" : NumberLong(1464152904641), "hasContinuous" : false [...]
property id present in the result, this identifier is stored in a list in the user info, if it isn’t already there, and is used after to exclude events with this identifier in other plugins.
If the result is of a continuous type the function will check its value and add a value to the event, 1 for home and 0 for away. It will then set the event start timestamp to the original timestamp and add it the presence info list of the user and the event list of the corresponding type. If the event list for that type is not empty it will set the last event end timestamp to this current one start timestamp. If it is of a non-continuous type it will use the provided interval in the pa-rameters of the query, heuristically defined, to calculate the event start and end timestamps from the original timestamp and then will add these events to the lists. The algorithm will also store the messages ids, simply because sometimes there are messages from the same device hierarchy with the same value and the 28
Chapter 3. Data Processing
same timestamp, and this way we can avoid processing again the same messages if the plugin is run again or is in a continuous production service. Finally as with the devicesPerUser, the users marked has changed are updated on the database.
3.4.4
changePropertyUpdates
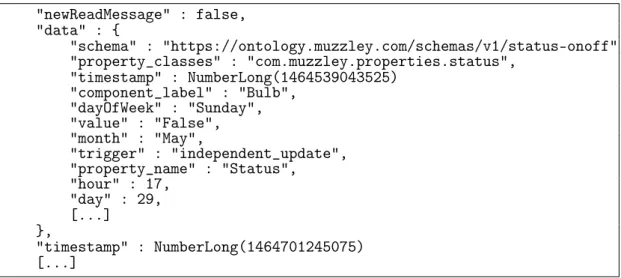
Depending on the type of device and its use cases sometimes the update messages generated by it may report repeated values. For example an alarm may create a lot of updates since it was activated up to the point it was turned off, however only two times the arm property changed. The same is true in the case of the read messages, several read messages may be sent for a property that hasn’t changed in value meanwhile. Also for the write messages, repeated write messages for the same property with the same value are in some cases common, specially when they are triggered by rules. This plugin was created to mark the events that effectively report a property change instead of just broadcasting a repeated value, since this may generate more meaningful information about the messages. The idea is to save a state per property of each device and then check if an update message reports a new value or if a write message contains a new value. For the reads case basically the read is marked if there hasn’t been another read since the property changed.
So contrary to the other plugins, which are more focused on the user_id for their operation, this one is oriented to a property device identifier composed by profile, channel, component, property and user ids. It stores a timestamp and an event per identifier that corresponds to the last update message from this device property. Then it will iterate through the events checking per identifier if the new message, an update or a write differs from the last one. If so the event is marked by creating the new field changeProperty with true value and then updating the loadEventsToDB collection, and the event is also stored in this identifier data so that it can be compared to the next.
Chapter 3. Data Processing
Figure 3.8: Partial example database document for the changePropertyUp-dates plugin "newReadMessage" : false, "data" : { "schema" : "https://ontology.muzzley.com/schemas/v1/status-onoff", "property_classes" : "com.muzzley.properties.status", "timestamp" : NumberLong(1464539043525) "component_label" : "Bulb", "dayOfWeek" : "Sunday", "value" : "False", "month" : "May", "trigger" : "independent_update", "property_name" : "Status", "hour" : 17, "day" : 29, [...] }, "timestamp" : NumberLong(1464701245075) [...]
In the case of the read messages there is a Boolean variable associated with the identifier that is set to true each time the saved data changes and set to false when a read message for that identifier is processed. A message that is processed while the variable is true is updated in the loadEventsToDB collection with the changeProperty field, like in the update and read cases. This way only one read message is marked per property state change.
As with the loadEventsToDB, event comparison is done by comparing the dictionaries representing the messages, excluding certain fields, such as timestamp, etc. in order to see if the message reports new values or not. This is done because the fields in the message are dependent on the schema and this way works on all of them.
3.4.5
interactionStatsPerUser
This plugin is responsible for creating usage statistics for each user. It iterates through all database loaded messages and creates metrics per user with different levels of granularity, taking into account the type and time of day. The metrics are created by counting events and time passed, then averages are calculated using this information. Examples of created metrics are: average number of update 30
Chapter 3. Data Processing
messages per hour, average number of write messages per weekend day, average number of independent update messages per hour on a weekday, etc. Metrics are also divided by if the counts concern messages marked as changeProperty.
Figure 3.9: Partial example database document for the interactionStatsPe-rUser plugin "iWeekendCountCP" : 11, "iWeekdayCountCP" : 74, "rWeekendCountCP" : 8, "userWeekendAvgDay" : 3, "WeekdayAvgHour" : 0, "iNightWeekdayindependent_updateCount" : 17, "rWeekendAvgMin" : 0, "userAvgDay" : 1, "iDawnWeekdayindependent_updateCount" : 12, "rAvgDay" : 1, "rDawnWeekenduserCountCP" : 8, "rCount" : 13, "ruserAvgDay" : 1, "iNightWeekdayindependent_updateCountCP" : 17, "currentTimestamp" : NumberLong(1464715201302) "totalCount" : 98, "iAvgDay" : 5, "iDawnWeekendindependent_updateCountCP" : 1, "iNoonWeekdayindependent_updateCount" : 25, "ruserAvgMin" : 0 [...]
This plugin starts by retrieving users’ information from the devicesPerUser collection and then it will iterate through the users skipping those that don’t have timezone information, also checking if there is already information for this user in this plugin collection and if not, it creates a new dictionary for it. For each user it will then do a query to the presenceFromDevices and if that yields a result it will then query loadEventsToDB collection to retrieve all his events, sorted by timestamp. This query is limited to results with timestamp greater than the saved one so that events are not processed twice. Then start and end timestamps are retrieved from the first and last events returned by the query, and the plugin starts iterating the results.
Firstly, if the exclude option is set, it will check the presence information for the identifiers and if the current one matches it will skip the event. Then it will use the dayOfWeek information to create a typeOfDay, Weekend or Weekday and the hour to create a timeOfDay, morning if between 7 and 13, noon if 13 and 19,
Chapter 3. Data Processing
night if 19 and 1, and dawn between 1 and 7. After this it starts doing counts based on the event information. These counts take into account several levels of the Muzzley hierarchy and other information. For example, the first count is the type of dataset at this time of day in this type of day with this trigger. This is composed has a field name for the user dictionary, so a field for this type of count can be iMorningWeekendindependent_updateCount, in which “i” means it is from the updates dataset. An example of a different type of granularity of this count would be for example dataset and trigger, which for this case would compose the field iindependent_updateCount. A duplicate version of each type of metric is also created with the CP letters on the end of its name, meaning that this metric only counts events that were marked has changeProperty.
After a lot of different types of counts are done the plugin will then calculate days passed based on the difference between the first and last event timestamp. This is important to know how many week and weekend days passed to have statis-tics based on each. The algorithm then iterates the collected counts calculating the averages. In order to do this it calls a function that will discount time passed based on the properties of the count, for example if it is referred to weekend it will removed all time passed in weekdays and then it will divide the count with the remaining time to obtain the average. This is done in three levels, minutes, hours and days.
Finally, as with other plugins, users marked as changed will be updated in the database. The algorithm however does some simplifications. First when counting the days passed, even if a user only has a couple of events at the beginning of the day, that day is counted. Then when discounting the time, for example for time periods, time is simply divided by 4, the number of periods. And the same for time passed depending on week or weekend days. In the long run, if the user has normal activity throughout the days the simplifications won’t distort too much the real values, but it is something to take into account. Doing the algorithm other way would probably mean a much more complicated solution with a slightly better precision that might not make much difference.
Chapter 3. Data Processing
It is worth noting that the metrics marked as CP were a later introduction to the plugin and so they were not present in the initial experiments, but this will be stated again when explaining the experiments.
3.4.6
createMLDatasetGenStats
This plugin generates more immediate metrics that will serve as the main building block of the csvs for machine learning. Depending on the chosen mode it will either create a database entry per message from the loaded ones, or an entry per window of time. The metrics on this entry are for example: number of write messages in the past 5 minutes, number of independent updates in the past half hour, etc. This algorithm also creates information about presence per entry by querying the presenceFromDevices collection.
Figure 3.10: Partial example database document for the createMLDataset-GenStats plugin "wLastMessageDiffCP" : 1292, "totalDiffSchemasCountHalf" : 1, "iindependent_updateCountHalfCP" : 1, "ruleLastMessageDiff" : 0, "rruleLastMessageDiffCP" : 835, "ruleCountQuarter" : 5, "iindependent_updateCountFive" : 1, "ruleCountHalf" : 5, "iLastMessageDiffCP" : 0, "totalDiffSchemasCountQuarterCP" : 1, "iindependent_updateLastMessageDiff" : 0, "presenceStatusContinuous" : "n/a", "totalCountQuarter" : 6, "iDiffSchemasCountHalf" : 1, "rDiffSchemasCountHalf" : 1, "totalCountFiveCP" : 1, "totalCountHalfCP" : 1, "iCountHalfCP" : 1, [...]
The plugin starts by retrieving information from the devicesPerUser collection, the interactionStatsPerUser collection and its own collection. Then it iterates each user_id to query the loadEventsToDB collection to retrieve the events that weren’t processed yet, sorted by timestamp. It will then process them by window or by
Chapter 3. Data Processing
If window mode is selected statistics are calculated each time we move to a new time frame. In order to do this the algorithm gets the last event timestamp and the current event timestamp is initialized with the first event time. It then enters a while cycle that continues as long as the current is lower than the last timestamp. Inside this while there is another cycle that essentially adds events to a list as long as the event timestamp is lower than the current timestamp and there are more events to process. This is the list that will be used to calculate this time window metrics. In this mode the time metrics are calculated from the window timestamp and the user timezone.
If event mode is selected, the events are iterated and simply added to the list to be used to calculate statistics, time metrics are gathered directly from the event. As with the interactionStatsPerUser, if event exclusion is turned on before adding to the lists in both window and event mode, those events are skipped if they were used to gather presence from. Then for each window or each event, another function goes through the selected events list. Since metrics are based in messages occurring in the last 1, 5, 15 and 30 minutes, the ones out this timeframe are removed. This function will then do counts to create the metrics using this list, for example, wuserFivecount, the number of user writes messages in the last 5 minutes.
Besides count related metrics very similar to the interactionStatsPerUser plu-gin, this plugin has 2 other types of metrics. Firstly there are the different schemas metrics. These count the number of messages that use a different schema per time window and granularity as the other counts. So for example if in the last 15 min-utes there was an update message for an rgb bulb and an update message for an alarm that was activated, the metric iDifferentSchemasCountQuarter will be 2. And if for example another 2 messages for a different rgb bulb were processed, this metric will still be 2 since no different schema was counted. This is imple-mented by keeping a list of schemas, appending when a new one is processed and then retrieving the list length to create the metric value. The reason behind these metrics is that they represent indirectly the number and types of devices being
Chapter 3. Data Processing
interact with. This may be very relevant for presence, for example somebody ar-riving home probably interacts with different type of devices in a very short time, switching lights on, changing the thermostat temperature, turning a cooking pot on, watering plants, etc.
The second type of different metrics are the last message difference. These basically hold in seconds how much time ago a message of a certain granularity was generated. So for example if the metric wRuleLastMessageDiff holds the value 5 it means that the last time a write message with the rule engine as trigger was seen was approximately (since its rounded from milliseconds) 5 seconds ago. This is implemented by storing the last event of each type, the difference in time is calculated between the current processing time and the last events of each type. The idea of these metrics is that even with the counts it may be useful to know when was the last time a message of a certain type occurred.
As with the interaction stats per user, for each of these types of metrics, the counts, the counts of different schemas and the last messages differences, an equal counterpart exists that holds the same type of information but only takes into account events that were marked as changedProperty.
Regardless of the selected mode, the last step for creating an entry in this plugin collection is retrieving information about presence. Values for presence are stored individually for each type of presence, non-continuous continuous and user_NDI, and an “n/a” is used when a user doesn’t have that type. A total presence value is also stored. In order to do this a function iterates through the presence events of the user and retrieves the values of the events that have time windows in which the timestamp of the event/window fits. If more than one event is gathered the values are summed and if the value is bigger than 1 it is lowered to one. Finally the new entry is inserted in the database in a bulk operation, the same way it’s done in the loadEventsToDB plugin.
The main parameters for the plugin is the mode: window / event and the size of the time window. Initially this plugin would also restrict the users from which