Gago et al. - 1
Targeted gene disruption coupled with metabolic screen approach to
1
uncover the LEAFY COTYLEDON1-LIKE4 (L1L4) function in tomato
2
fruit metabolism
3 4
Custódia Gago1, Victoria Drosou2, Konstantinos Paschalidis3, Adriana Guerreiro1, Graça 5
Miguel1, Dulce Antunes4*, Zoe Hilioti2* 6
7
1
University of Algarve, Meditbio, FCT, edf. 8 Campus de Gambelas, 8005-139 Faro, Portugal 8
2
Institute of Applied Biosciences, Centre for Research and Technology Hellas, Thessaloniki, 9
Thermi, 57001, Greece 10
3 Technological Educational Institution of Crete, Department of Agriculture
11
710 04 Heraklion, Crete, Greece 12
4 University of Algarve, CEOT, FCT, edf. 8 Campus de Gambelas, 8005-139 Faro, Portugal
13 14 15
keywords: L1L4/NF-YB6, fruit quality, metabolites, zinc-finger nuclease technology, transcription 16 factor, tomato 17 18 *Correspondence 19 Dr. Zoe Hilioti 20
Institute of Applied Biosciences 21 CERTH 22 6th klm Charilaou-Thermi Rd. 23 Thessaloniki, 570 01, Greece 24 [email protected] 25 26
Prof. Dulce Antunes 27
University of Algarve 28
edf. 8 Campus de Gambelas, 8005-139 Faro, Portugal 29 [email protected] 30 31 32 33 34 35 36 ABSTRACT 37
Tomato fruits from mutant lines bearing targeted disruption of the heterotrimeric Nuclear 38
transcription factor Y (NF-Y) transcription factor (TF) gene LEAFY-COTYLEDON1-LIKE4 39
(L1L4, NF-YB6), a master regulator of biosynthesis for seed storage proteins and fatty acids, 40
were evaluated for metabolites content and morphology. Metabolic screens using LC-MS/MS-41 1 2 3 4 5 6 7 8 9 10 11 12 13 14 15 16 17 18 19 20 21 22 23 24 25 26 27 28 29 30 31 32 33 34 35 36 37 38 39 40 41 42 43 44 45 46 47 48 49 50 51 52 53 54 55 56 57 58 59
based analysis and physico-chemical methods in different L1L4 mutants of the fourth generation 42
allowed a comparative assessment of the effects of the TF disruption. Mutagenesis resulted in 43
fruits phenotypically similar to wild-type with subtle shape differences in the distal end 44
protrusion and symmetry. Conversely, mutant fruits from independent lines had significant 45
variation in moisture content, titratable acidity and overall metabolite profiles including oxalic 46
and citric acid, fructose, β-carotene, total polyphenols and antioxidants. Lines 6, 7 and 9 were the 47
richest in -carotene and antioxidant activity, line 4 in ascorbic acid and lines 4 and 8 in succinic 48
acid. The reduced content of the anti-nutrient oxalic acid in several mutant fruits suggests that 49
L1L4 gene may regulate the accumulation of this compound during fruit development. Detailed
50
LC-MS/MS analysis of mutant seeds showed substantial differences in bioactive compounds 51
compared to wild-type seeds. Taken together, the results suggest that the L1L4 TF is a 52
significant regulator of metabolites both in tomato fruit and seeds providing a molecular target 53
for crop improvement. Elucidation of the candidate genes encoding key enzymes in the affected 54
metabolic pathways aimed at facilitating a better exploration of the L1L4 gene networks and to 55
expedite the use of systems biology approaches in tomato fruit. 56
57 58
KEY MESSAGE 59
Functional analysis of tomato L1L4 master transcription factor resulted in important metabolic 60
changes affecting tomato fruit quality. 61
62
INTRODUCTION 63
Tomato (Solanum lycopersicum L.) is an important fresh produce crop. The fruit is produced in 64
large scale and consumed all over the world. World’s tomato production reached 137 MT in 65 4 5 6 7 8 9 10 11 12 13 14 15 16 17 18 19 20 21 22 23 24 25 26 27 28 29 30 31 32 33 34 35 36 37 38 39 40 41 42 43 44 45 46 47 48 49 50 51 52 53 54 55 56 57 58 59
crops. Tomato fruit for consumption, as either fresh or processed, is an important source of 67
nutrients, such as vitamins, carotenoids and phenolics (Antunes, et al. 2013; Breksa, et al. 2015; 68
Odriozola-Serrano, et al. 2008). Sugars and organic acids and their balance are the main 69
contributors to the tomato’s fruit taste. In particular, ascorbic acid (vitamin C) along with the 70
carotenoids lycopene and -carotene and phenolic compounds (flavonoids and hydroxyxinnamic 71
acids) are responsible for the tomato antioxidant properties which are health promoting 72
phytochemicals in human diet (Ilahy, et al. 2011). Therefore, enhancing the tomato fruit quality 73
is of great research interest for both nutraceutical and horticultural industries (Rigano, et al. 74
2013; Rosati, et al. 2000). 75
76
Appropriate cultivars must be selected to reach the demand of growers and consumers. Markets 77
are today interested in differentiating products by attributes related to taste, aroma, acidity, sugar 78
content and vitamins (Causse, et al. 2002; Powell, et al. 2012; Serrano-Megías and López-79
Nicolás 2006). Traditionally, tomato breeding has been focused on the improvement of yield, 80
disease resistance, tolerance to abiotic stress and sugar content [(López, et al. 2015) and 81
references therein]. Yield enhancement was achieved by crosses with wild relative species 82
(Swamy and Sarla 2008). However, many quantitative trait loci (QTL) for yield and related traits 83
as fruit weight, total soluble solids or lycopene content were found non-randomly distributed in 84
the genome (Fulton, et al. 1997; Fulton, et al. 2000; López, et al. 2015). Domestication and 85
breeding of tomato plants resulted in a variety of phenotypes with increased fruit weight, 86
variability in fruit shape and color (Paran and van der Knaap 2007), as well as differences in fruit 87
quality characteristics which have been largely attributed to genetic factors (Breksa, et al. 2015; 88
Choi, et al. 2014). Phenotypic tomato fruit diversity may range from round to elongated and from 89 4 5 6 7 8 9 10 11 12 13 14 15 16 17 18 19 20 21 22 23 24 25 26 27 28 29 30 31 32 33 34 35 36 37 38 39 40 41 42 43 44 45 46 47 48 49 50 51 52 53 54 55 56 57 58 59
small to large. Thus far, the elongated shape was linked to the loci sun (Van der Knaap, et al. 90
2004; Van der Knaap and Tanksley 2001), ovate (Ku, et al. 1999; Liu, et al. 2002; Van der 91
Knaap, et al. 2002) and fs8.1 (Grandillo, et al. 1996; Ku, et al. 2000). 92
93
The downside of the conventional breeding approaches is that they remain a time-consuming (9-94
15 years for cultivar improvement) and laborious effort considering the relatively long life cycle 95
of tomato (90-120 d) and the fact that, most of the times, these approaches are not targeted to a 96
single genetic locus. As a result of this, classic research in tomato has characterized only a few 97
mutants at molecular level. Recent efforts to increase the available resources for tomato research 98
centered on tomato Heinz 1706 genome sequencing project which after its completion (Tomato 99
Genome 2012), provided clues for fruit evolution and fueled functional genomics studies in this 100
species. The advantages of tomato Heinz 1706 are its compact growth, high production, 101
determinate growth pattern and adaptability to both controlled environments and field conditions. 102
The molecular-based breeding in tomato could be accelerated by using gene targeting 103
technologies, such as the Zinc Finger Nuclease (ZFN) technology, to identify genes required for 104
a particular trait. In our previous studies in tomato, we found that L1L4, a member of the L1L 105
gene family, was expressed in flowers and green developing fruit (Hilioti, et al. 2014) while a 106
ZFN-based disruption of the coding sequence of the TF affected fruit phenotype (Hilioti, et al. 107
2016). Notably, the L1L4 (or NF-YB6), encodes the subunit of CCAAT binding heterotrimeric 108
transcription factor NF-Y, an embryo-specific transcription factor involved in plant development 109
and regulation of seed storage proteins and fatty acid biosynthesis (Kagaya, et al. 2005; Lotan, et 110
al. 1998; Mu, et al. 2008). 111 112 4 5 6 7 8 9 10 11 12 13 14 15 16 17 18 19 20 21 22 23 24 25 26 27 28 29 30 31 32 33 34 35 36 37 38 39 40 41 42 43 44 45 46 47 48 49 50 51 52 53 54 55 56 57 58 59
We studied the function of L1L4 TF in tomato fruit development and quality and evaluated both 113
fruit tissues and seeds in an effort to establish a relationship between metabolites in fruits and 114
seeds of each mutant line. The integrative analyses allowed us to identify crucial content 115
variation in major metabolites which was attributed to the regulatory role of L1L4. 116
117 118
RESULTS AND DISCUSSION 119
Selection of different L1L4 disruption variants 120
Tomato, apart from being an economically important food crop, serves as a model system for 121
complex processes, such as fruit development, ripening (Giovannoni 2004) and seed 122
development (Hilhorst, et al. 1998). In a previous study, we used ZFN technology to target the 123
developmental TF L1L4. Disruption of L1L4 coding sequence revealed that the TF is a global 124
regulator of tomato development, affecting flower fruit setting, fruit and seed morphology 125
(Hilioti, et al. 2016). In the current study, plants homozygous for L1L4 of the M4 generation were
126
produced, as the cultivar Heinz 1706 displays cleistogamy and is self-pollinated. Independent 127
plants from each mutant line were studied for fruit quality. In Arabidopsis, LEC1/L1L is an 128
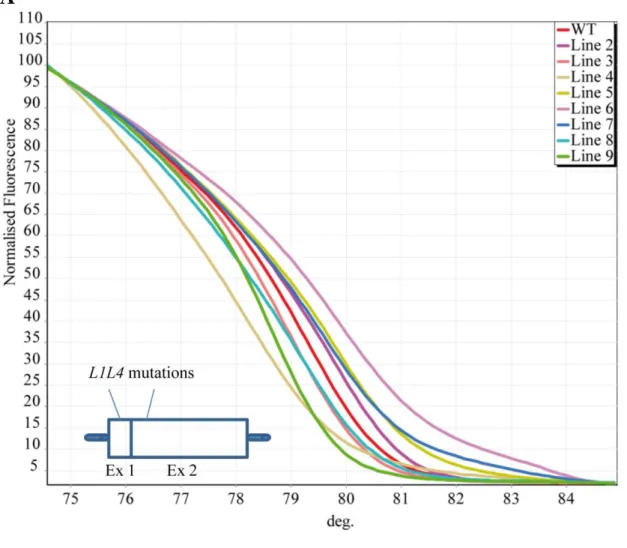
essential gene regulating plant development (Kwong, et al. 2003). HRM analysis was used to 129
identify 8 lines carrying different ZFN-induced and NHEJ-mediated mutations (indels) in the 130
target locus (Figure 1A). The presence of indels in the target locus produced different melting 131
curves compared with the one from the non-mutated amplified target DNA flanking the end of 132
exon 1 and beginning of exon 2. Sequencing of the L1L4 locus amplified from cDNA by PCR 133
using a forward and a reverse primer in exons 1 and 2, respectively, revealed the exact genotypes 134
of the mutant lines (Figure 1B). Interestingly, nucleotide changes were found in lines 2 and 4 135
while lines 5 and 7 have a 1-bp insertion which results in frameshift. Line 3 had a 2-bp deletion 136 4 5 6 7 8 9 10 11 12 13 14 15 16 17 18 19 20 21 22 23 24 25 26 27 28 29 30 31 32 33 34 35 36 37 38 39 40 41 42 43 44 45 46 47 48 49 50 51 52 53 54 55 56 57 58 59
and line 6 had two 1-bp insertions in addition to nucleotide changes. Line 8 had nucleotide 137
changes and deletions while line 9 had a 1-bp deletion and insertion at the end of exon 1. The 138
unique coding sequence polymorphism in mutant lines lied upstream of the DNA binding 139
domain of the TF and the highly conserved among eukaryotes central region of NF-YB subunit 140
(Li, et al. 1992; Mantovani 1999). Unlike other TFs, three subunits (YA, YB and NF-141
YC) of NF-Y are required to create the DNA binding domain (Maity and de Crombrugghe 1992; 142
McNabb, et al. 1995; Sinha, et al. 1995). Therefore, one would expect that L1L4 mutations could 143
potentially affect one or more of the following: the recognition ability of L1L4 to target the 144
promoters of its target genes, the interaction of the L1L4 protein with the NF-YC subunit, and 145
NF-Y complex formation. In the last two cases the effect of the mutation would lead to a 146
functional knockout. Substitutions and other specific characteristics of the L1L4 mutations in 147
coding region were revealed by comparison with the wild-type sequence via multiple sequence 148
alignment (Supplemental File 1). Indels in lines 3, 5 and 7 led to premature nonsense (stop) 149
codons in L1L4 and in truncated proteins lacking the central B and C-terminal C domains of the 150
transcription factor (Supplemental File 1). The truncated versions of the TF are expected to be 151
non-functional. However, a well-conserved domain is present in the truncated isoforms and other 152
mutants from residues 1 to 19, where potential phosphorylation sites for serine may be present. If 153
the truncated proteins are stable and substrates for phosphorylation, then they can compete with 154
other substrates causing interference in other phosphorylation-dependent pathways. In line 2, 155
nucleotide substitution mutations led to E34N, L35R, P36H amino acid substitutions, which are 156
also rare as the exchanged residues have very different structures and properties. Mutant line 4 157
constitutes a unique case as it carries a single amino acid substitution of aspartic (abbreviated as 158
Asp or D) to tyrosine (abbreviated as Tyr or Y) residue at position 23. The D23Y substitution is 159 4 5 6 7 8 9 10 11 12 13 14 15 16 17 18 19 20 21 22 23 24 25 26 27 28 29 30 31 32 33 34 35 36 37 38 39 40 41 42 43 44 45 46 47 48 49 50 51 52 53 54 55 56 57 58 59
also fixed in line 9, in addition to the presence of three more amino acid substitutions (T20P, 160
P21L, A22Q) in this line. The aspartic acid to tyrosine substitution is rare as the two amino acids 161
have very different structures, properties and biological functions. An Aspartic acid residue is 162
negatively charged prefers to be on the surface of proteins, and it can be a phosphomimetic 163
chemically similar to phospho-serine. From the other hand, Tyr residue is aromatic and prefers to 164
be buried in protein hydrophobic cores. This replacement is expected to maximally alter the 165
hydrophofic surface of L1L4 and consequently the accessibility of kinases to possible serine 166
residues located nearby Tyr-23, altering, in such scenario, L1L4 protein regulation. Further, it is 167
possible that tyrosine itself is a target for phosphorylation by tyrosine-specific kinases and this 168
phosphorylation is crucial for a signal transduction process in the cells. Line 6 carries a block of 169
six different amino acid residues (EPGTDN) compared to wild-type (ELP) in the amino acid 170
region between 33 and 38, which is expected to alter the folding and properties of the protein. 171
Notably, the Ser-32, which is quite conserved in other lines, has been substituted with glutamic 172
acid (E) in this line. The insertion and deletion of nucleotides in line 8 changed the reading frame 173
only of the region between P20-L40, resulting in a completely different translation from the 174
wild-type. Overall, the amino acid substitutions in L1L4 appeared between the residues 20 and 175
38 of the protein, which suggests that the region is under relaxed selection and mutations can be 176
tolerated. 177
178
Consequences of L1L4 disruption on tomato fruit appearance 179
Fruit quality, as determined by the appearance of the fruit including its shape, size, color, 180
synchronous ripening and absence of defects, remains an important quality criterion for fresh 181
market industries. To investigate the tomato fruit morphological effects of the L1L4 coding 182
sequence disruption, we assessed the variation of shape in fertile lines carrying different L1L4 183 4 5 6 7 8 9 10 11 12 13 14 15 16 17 18 19 20 21 22 23 24 25 26 27 28 29 30 31 32 33 34 35 36 37 38 39 40 41 42 43 44 45 46 47 48 49 50 51 52 53 54 55 56 57 58 59
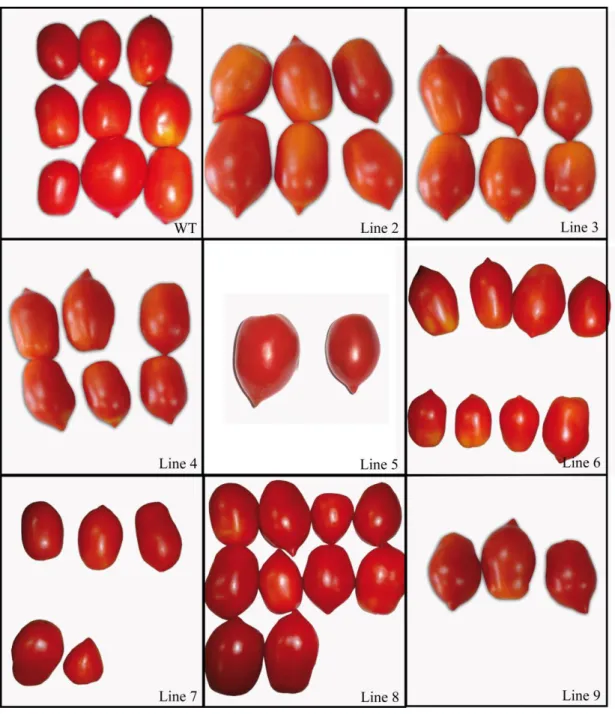
mutations in relation to the wild-type species. Based on visual observation, the phenotype of the 184
fruits from mutant lines showed subtle shape differences in the distal end protrusion and 185
symmetry (Figure 2), which did not significantly affect the size of the fruit in terms of diameter, 186
length and weight (Table 1). In contrast to wild-type plants that produced elongated and three-187
loculed fruit, L1L4 mutant fruits had usually not more than two locules (data not shown). 188
Previous studies have linked mutations in the LOCULE NUMBER (LC) (Barrero, et al. 2006) and 189
FASCIATED (f or fas) genes (Lippman and Tanksley 2001) to the increase in locule number of
190
tomato fruit. Further, the characteristic distal end protrusion of Heinz 1706, which is related to 191
localized cell division events, was either more or less pronounced in mutants compared to wild-192
type (Figure 2). Specifically, lines 2, 3, 4, 8 and 9 showed a pronounced distal end protrusion 193
compared to wild-type. This suggested that the fruit shape trait is under L1L4 TF control while 194
the genes regulated by this TF remain to be identified. A previous study in tomato determined 195
that mutations in the SUN, OVATE, LC and/or FAS genes can explain as much as 71% of the 196
fruit shape diversity (Rodríguez, et al. 2011). In particular, SUN gene product has been 197
hypothesized to control elongated fruit shape by acting as positive regulator on growth to alter 198
hormone or secondary metabolite levels (Xiao, et al. 2008). 199
200
Tomato color correlates with maturity and the a/b ratio, which measures the relative amounts of 201
red (a) and yellow (b), has been used as an indicator of maturity (Arias, et al. 2000). The results 202
of this study revealed that tomato color was almost not influenced by L1L4 gene disruption 203
(Figure 2). In addition, color parameters L and a* had similar values among all tomato lines 204
(Table 1) except line 3 (Table 1). Nevertheless, none significantly differed from wild-type fruit at 205
the ripe stage. 206 4 5 6 7 8 9 10 11 12 13 14 15 16 17 18 19 20 21 22 23 24 25 26 27 28 29 30 31 32 33 34 35 36 37 38 39 40 41 42 43 44 45 46 47 48 49 50 51 52 53 54 55 56 57 58 59
207
Fruit weight ranged from 29.35 g (line 3) to 40.51 g (line 4) showing a 1.4-fold variation from 208
lowest to highest weights, being significantly different only between lines 3 and 4. Nevertheless, 209
fruit diameter and length did not show significant differences among lines and wild-type (Table 210
1). 211 212
Although consumers buy on the basis of appearance and textural quality, their satisfaction and 213
repeat purchases are dependent upon good eating (flavor) quality. Firmness was also not affected 214
by the L1L4 gene disruption, being all lines and wild-type with values which did not significantly 215
differ (Table 1). 216
217
Fruit compositional changes related to L1L4 gene disruption 218
Tomato ripening is a highly regulated developmental process involving changes in fruit color 219
and alterations in its texture-a result of cell wall remodeling-as well as changes in metabolism in 220
terms of accumulation of sugars, organic acids, flavonoids, carotenoids and ascorbic acid which 221
can influence the flavor quality of the fruit. An autocatalytic increase in respiration and ethylene 222
biosynthesis precedes the initiation of ripening in tomato while a number of transcription factors 223
encoded by the NON-RIPENING (NOR), COLORLESS NON-RIPENING (CNR), and RIPENING 224
INHIBITOR (RIN) regulate the ripening process in concert with the gas hormone ethylene
225
[reviewed in (Giovannoni 2007)]. 226
227
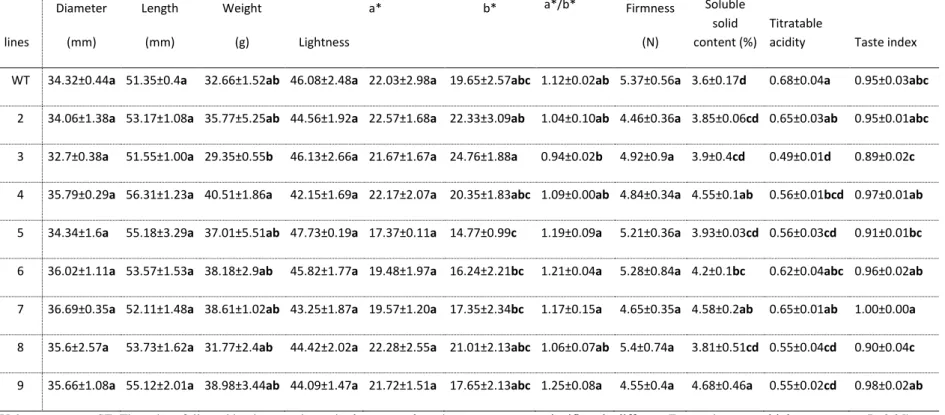
To determine whether fruit quality characteristics were different in L1L4 mutant tomato lines and 228
wild-type, several attributes were evaluated. Tomato firmness is a texture attribute that 229
determines postharvest shelf-life and is required for shipping to distant markets. Maintenance of 230 4 5 6 7 8 9 10 11 12 13 14 15 16 17 18 19 20 21 22 23 24 25 26 27 28 29 30 31 32 33 34 35 36 37 38 39 40 41 42 43 44 45 46 47 48 49 50 51 52 53 54 55 56 57 58 59
firmness was observed in all mutant fruits with values which did not significantly from the wild-231
type (Table 1). In contrast to fruit firmness, a strong variation in fruit soluble solids content 232
(SSC) was detected for the mutants in Heinz 1706 background with values between 3.6 and 233
4.68% (Table 1), which were greater than the range (3.57 to 3.75) of SSC values reported by 234
Ferreira (Ferreira 2001) and lower than that (5.18 to 7.88) of the Mexican cultivars (Mahakun, et 235
al. 1979). Importantly, all mutant fruits had increased SSC when compared to wild-type. SSC 236
content is of prime importance in fresh-market tomatoes and a breeding target (Stevens 1986), as 237
it affects flavor (Simandle, et al. 1966) and nutritive value. An increase in SSC is also desirable 238
in processing tomatoes and it has been estimated that an increase of 1% in fruit SSC represents a 239
20% increase in yield of processed product (e.g. paste, purees) which translates in significant 240
financial profit (Wood 1992). In line 4, the single D23Y substitution was sufficient to increase 241
SSC content over wild-type levels while the additional substitutions present in line 9 did not 242
contribute significantly to SSC content. The SSC contents in lines 3 and 5 carrying the truncated 243
forms of the TF were similar to those in lines 4 and 9 carrying amino acid substitutions between 244
residues 20 and 23. The acidity of the fruit is very important for the flavor and storability of 245
processed tomato. Genetic factors are the major acid content determinants in tomato fruits, with 246
great variation occurring among genotypes (Stevens and Rick 1986). Fruit titratable acidity (TA) 247
varied greatly in the mutant lines with line 9 having the highest value which did not significantly 248
differ from lines 4, 6 and 7, while wild-type had the lowest value which was similar to lines 2, 3, 249
5 and 8 (Table 1). Specifically, TA values ranged from 0.49 to 0.68 (wild-type) and were similar 250
to values reported for the Mexican tomato cultivars (Méndez I, et al. 2011). The single D23Y 251
substitution in line 4 was sufficient to reduce significantly the TA in fruits. Taste is one factor 252
that affects perception of flavor. The taste index was calculated using the values of SSC and TA 253 4 5 6 7 8 9 10 11 12 13 14 15 16 17 18 19 20 21 22 23 24 25 26 27 28 29 30 31 32 33 34 35 36 37 38 39 40 41 42 43 44 45 46 47 48 49 50 51 52 53 54 55 56 57 58 59
and applying the equation determined by Navez et al. (Navez, et al. 1999). The mutants had 254
values between 0.89 and 1.0 (Table 1), thus being adequate for fresh consumption. According to 255
Navez et al. (Navez, et al. 1999) if the value of the taste index is higher than 0.7, tomato is 256
considered as tasty. Lines 3 and 8 had the lowest values (0.89 and 0.90, respectively), in contrast 257
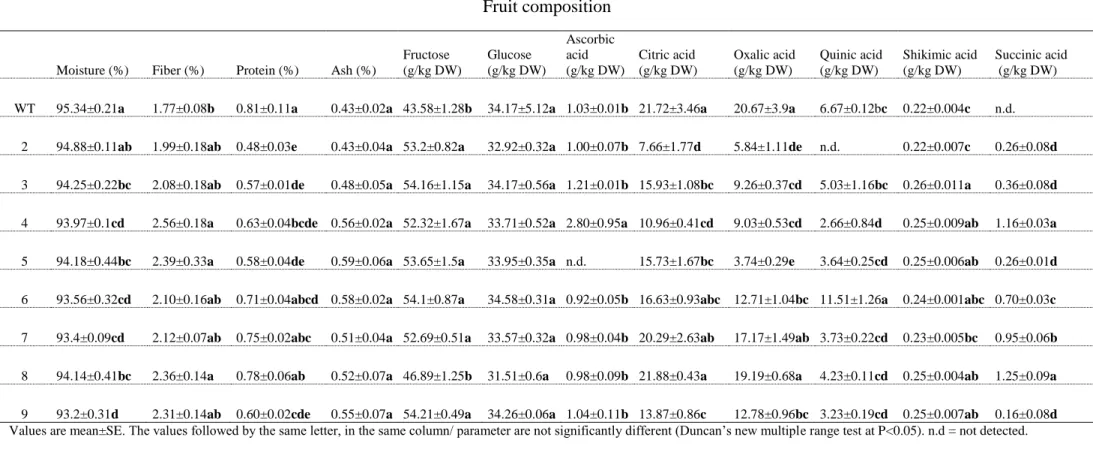
to line 7, with the highest value (1.0) (Table 1). Fruit moisture (Table 2) ranged from 93.2 (line 258
9) to 95.34% (wild-type), which was similar in magnitude to the values obtained by some tomato 259
cultivars grown in Tenerife (Suárez, et al. 2008). Fruit fiber content is another important quality 260
characteristic that was affected in lines 4, 5 and 8 with values significantly greater than in wild-261
type (Table 2), while wild-type values were similar to the ones obtained for other tomato 262
cultivars (Suárez, et al. 2008). These results indicate that L1L4 regulates fiber content in tomato 263
which is a beneficial health parameter. 264
265
Tomato mutant lines investigated in this work did not show variation in ash content (Table 2). 266
On the contrary, great variation in the crude protein content (free and protein-bound amino acids) 267
was detected in the mutants with values from 0.48% (line 2) to 0.81% (wild-type) (Table 2). 268
Mutations in lines 2, 3, 4 and 9 resulted in significantly lower protein content than wild-type and 269
lines 6, 7 and 8. The crude protein content of the wild-type background was similar to Korean 270
cherry tomato fruits (Choi, et al. 2014). 271
272
Fruit flavor is greatly affected by sugars as they contribute to sweetness. The sugars glucose and 273
fructose are the most prominent fractions of the SSC in the domesticated tomato (S. 274
lycopersicum). On the contrary, some wild tomato species (e.g. S. chmielewskii) accumulate
275
mostly sucrose (Yelle, et al. 1991). The soluble sugar contents (glucose, fructose and sucrose) 276 4 5 6 7 8 9 10 11 12 13 14 15 16 17 18 19 20 21 22 23 24 25 26 27 28 29 30 31 32 33 34 35 36 37 38 39 40 41 42 43 44 45 46 47 48 49 50 51 52 53 54 55 56 57 58 59
were determined in mature fruit tissues. As anticipated from previous studies, fructose was 277
present in high concentration followed by glucose, in agreement with results in other tomato 278
cultivars (Antunes, et al. 2013; Breksa, et al. 2015). Remarkably, the fructose to glucose ratio 279
was lower (1.3) in wild-type than in the L1L4 mutants (1.5) (Table 2). The remarkably 280
contrasted ‘high-fructose-to-glucose’ phenotype that contributes to sweetness in mutant lines 281
suggests that the TF regulates fruit fructose content. The mechanism of this effect is not obvious, 282
but needs to be further investigated in tomato fruits from individual lines. Overall, SSC showed a 283
significant and positive correlation with the fructose concentration (r=486, p<0.01). Fruit flavor 284
is also affected by the degree of sourness and the level of citric acid. Among the identified fruit 285
acids in the current study, citric acid level was significantly reduced in 5 out of 8 mutant lines, 286
with values ranging from 7.66 to 21.88 g/kg DW, which reflects a reduction in wild-type levels 287
by 64.8 and 26.66 %, respectively (Table 2). The persistence of the dramatic reduction in citric 288
acid levels in mutant fruits provided compelling evidence for the involvement of the TF in the 289
regulation of citric acid production. 290
291
The presence of oxalic acid in tomato has been previously reported (Islam, et al. 1996; Suárez, et 292
al. 2008). The plant metabolite oxalic acid when present in relative high amounts can be 293
considered as an anti-nutrient because it may inhibit the correct absorption of calcium due to the 294
formation of insoluble salts with calcium, particularly if the ratio of oxalic acid to Ca is higher 295
than 2.25. In such cases, food is considered to be decalcifying (Suárez, et al. 2008). In the 296
present study, oxalic acid was reduced in lines 2 and 5 by 70-80 % of wild-type levels, although 297
it was also reduced in lines 3, 4, 6 and 9 to a smaller extent (Table 2). A reduction in the levels of 298
oxalic acid in tomato fruit is desirable as it may facilitate the absorption of micronutrients. 299 4 5 6 7 8 9 10 11 12 13 14 15 16 17 18 19 20 21 22 23 24 25 26 27 28 29 30 31 32 33 34 35 36 37 38 39 40 41 42 43 44 45 46 47 48 49 50 51 52 53 54 55 56 57 58 59
300
Ascorbic acid, vitamin C, is a powerful antioxidant and a low intake may result in adverse health 301
effects. Tomato fruits from line 4 showed the highest ascorbic acid content with a 2.7-fold 302
increase above wild-type level. On the contrary, ascorbic acid was not detectable in line 5. Since 303
ascorbic acid is an essential dietary component, line 4 could be used for breeding cultivars 304
enriched in ascorbic acid. Further, line 6 exceeded in quinic acid content by 1.72-fold the wild-305
type level, while quinic acid was not detected in line 2 (Table 2). Shikimic acid concentrations 306
increased over wild-type levels in 6 out of 8 L1L4 mutant lines. Although succinic acid was not 307
detected in wild-type fruit, L1L4 lines produced fruits with increased levels (0.16-1.25 g/Kg 308
DW) of succinic acid, which provides a foundation for developing tomato fruit as a system for 309
producing succinic acid. Succinic acid has a specialty chemical market which includes 310
surfactants, detergents, foods and pharmaceuticals (Zeikus, et al. 1999). Specifically, mutant 311
lines 8 and 4 had the highest succinic acid content. Succinic (Suárez, et al. 2008) and shikimic 312
acids (Osvald, et al. 2001) were also previously reported in tomato samples. The sum of the 6 313
acids content, herein identified, showed a negative correlation with tomato fructose 314
concentration (r=-0.535, p<0.01). 315
316
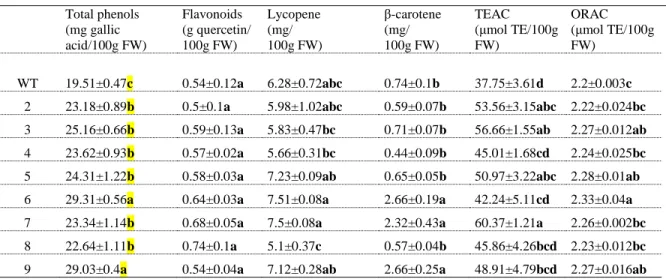
The content of antioxidants in tomato fruits from wild-type and mutant lines growing under 317
controlled conditions in the greenhouse was also investigated. Total phenol content was 318
consistently higher in all of the L1L4 mutant tomatoes, as compared to the wild-type (Table 3). 319
Line 9 had the highest phenol content which was 1.48-fold higher than the wild-type level. Our 320
results for phenol content in mutant lines are consistent with the results from Toor et al. (Toor 321
and Savage 2005) ranging from 7.41 to 21.7 mg GAE/kg FW, which indicates that the genotype 322 4 5 6 7 8 9 10 11 12 13 14 15 16 17 18 19 20 21 22 23 24 25 26 27 28 29 30 31 32 33 34 35 36 37 38 39 40 41 42 43 44 45 46 47 48 49 50 51 52 53 54 55 56 57 58 59
significantly affects total phenol content in tomato (Dumas, et al. 2003; George, et al. 2004). 323
According to Toor et al. (Toor and Savage 2005), flavonoids represent the major component of 324
the total phenol content in tomato fruit. No differences were detected in flavonoid content among 325
mutant lines. Tomato fruit is an important source of carotenoids in the human diet (Beecher 326
1998). The β-carotene levels were higher (approximately 3.5-fold increase) in lines 6, 7 and 9 327
compared to wild-type (Table 3), with concentrations (~0.5 mg/100 g FW) consistent with those 328
reported on tomato cultivars from Italy (Ilahy, et al. 2011) and China (Juroszek, et al. 2009). 329
Lycopene, a carotenoid, is the most prominent (90-99%) (Dumas, et al. 2003) lipophilic pigment 330
in tomato fruits known for its strong antioxidant role associated with its ability to act as free 331
radical scavenger (Müller, et al. 2011). Lycopene levels in mutant lines did not differ 332
significantly from wild-type levels. Nevertheless, lycopene values observed were higher than the 333
ones described for fresh tomatoes from China (Chang, et al. 2006), but slightly lower than in 334
Italian varieties (~10 mg/100 g FW) (Ilahy, et al. 2011). The general correlation between 335
lycopene and a*/b* ratio, a measure of redness, has been noted previously (Arias, et al. 2000) 336
and it was also found in this study (r=0.675, p<0.05). The metabolites listed above (phenols, 337
flavonoids, lycopene, β-carotene) have the ability to inhibit or retard oxidation processes which 338
are associated with human aging and development of pathologies such as metabolic syndrome, 339
cancer or degenerative disorders (Hamid, et al. 2010). In this context, lines 6 and 9 are of better 340
quality concerning those quality characteristics. The antioxidant activity of the wild-type tomato 341
fruits, determined by both the TEAC and the ORAC methods, was lower, as compared to the 342
mutants. According to Dumas et al. (Dumas, et al. 2003) and Atanassova et al. (Atanassova, et 343
al. 2007) the antioxidant contents in tomato fruit vary in relation to genotype and environment. 344
As all mutant lines were grown under similar conditions, the higher antioxidant content was 345 4 5 6 7 8 9 10 11 12 13 14 15 16 17 18 19 20 21 22 23 24 25 26 27 28 29 30 31 32 33 34 35 36 37 38 39 40 41 42 43 44 45 46 47 48 49 50 51 52 53 54 55 56 57 58 59
attributed to L1L4 gene disruption. Positive correlations were found between these antioxidant 346
activities (ORAC) and the contents of all bioactive compounds referred above but they were only 347
significant for total phenolics (r=0.598, p<0.001) and β-carotene contents (r=0.581, p<0.01). 348
349
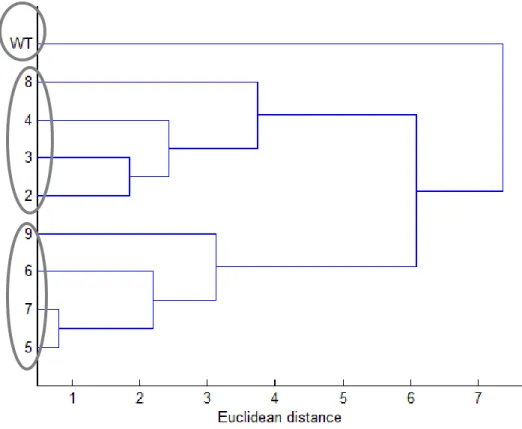
Principal component analysis (PCA) was used to explore the similarities among all the lines with 350
respect to the analyzed quality parameters. The data showed that three principal components 351
explained 67% of the total variation (Figure 3A). The first, second and third components 352
explained 31.16%, 21.0% and 14.84%, respectively, of total variation. Variable analysis made 353
possible to group the tomato lines in 3 groups in order to express and show the similarities and 354
differences (Figure 3). Group I consisted of wild-type alone characterized mainly by the protein 355
and moisture contents. Group II consisted of lines 2, 3, 4 and 8 which were closer because of 356
their similarity in fiber, color values (a*, b*, C* and hue), pH, ascorbic and succinic acids 357
content. Finally, group III consisted of lines 5, 6, 7 and 9 due to similarities in antioxidant 358
activity, lycopene, β-carotene, glucose, shikimic acid content, a*/b* ratio and fruit dimensions. A 359
dendrogram confirmed the results of PCA (Figure 3B). The results of PCA further confirmed the 360
previous analyses showing that the fruit quality parameters varied considerably with the L1L4-361
specific mutations. Based on the overall results in fruit composition from lines 3, 5, and 7 362
carrying truncated and non-functional L1L4 proteins, the TF appears to be a negative regulator 363
of fiber, fructose, succinic and shikimic acid biosynthesis and a positive regulator of citric and 364
oxalic acid biosynthesis. 365
Hence, the single gene mutation breeding accompanied by fruit quality assessment provided a 366
unique link between genotype, phenotype and fruit quality, which is currently missing for tomato 367 4 5 6 7 8 9 10 11 12 13 14 15 16 17 18 19 20 21 22 23 24 25 26 27 28 29 30 31 32 33 34 35 36 37 38 39 40 41 42 43 44 45 46 47 48 49 50 51 52 53 54 55 56 57 58 59
species. The results may provide a forward looking perspective on designing and producing 368
specialized products in plants. 369
370
Profiling of metabolites in seeds based on LC-MS/MS analysis 371
Tomato seeds represent a major (about 40%) byproduct of the tomato processing industry. The 372
seeds contain about 34% oil (Giannelos, et al. 2005) and posses antioxidant properties (Toor and 373
Savage 2005). To further address the role of L1L4 TF in seed metabolism, we screened, in 374
parallel, seeds from the same mutant fruits and wild-type for metabolites. The rational of this 375
approach was that L1L4 may have some effect on known or unknown metabolites predominantly 376
present in seeds. Notably, studies on tomato seed composition remain rather scarce; hence, our 377
analysis contributes new knowledge to what is already known from previous studies (Hilhorst, et 378
al. 1998; Mounet, et al. 2007; Persia, et al. 2003; Voelker and Kinney 2001). Typically, ripe-379
fruits from mutants and wild-type tomato plants were harvested, and the seeds were then 380
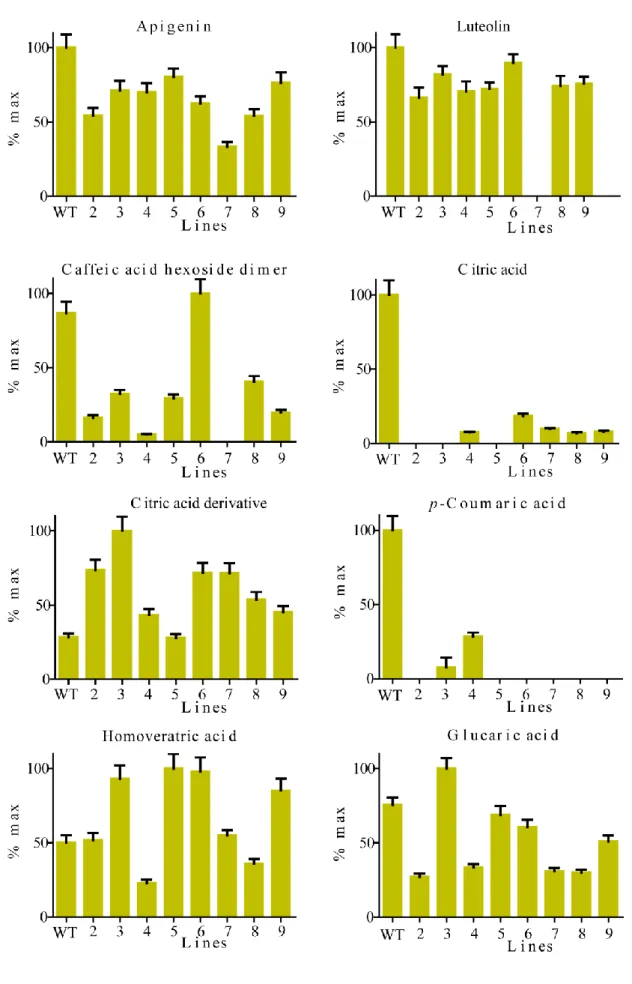
analyzed by LC-MS/MS for the presence of carotenoids, flavonoids and non-volatile acids. The 381
untargeted analysis, revealed a decrease in the levels of apigenin in mutant seeds compared to 382
wild-type (Figure 4). Further, a pronounced reduction in luteolin levels was detected in all 383
mutant seeds while the metabolite was practically undetectable in line 7. These results suggest 384
that L1L4 may regulate luteolin levels in tomato seeds. Luteolin was previously detected in 385
tomato fruits (Chassy, et al. 2006), seeds and skins (Kalogeropoulos, et al. 2012). Αpigenin and 386
its derivatives have been previously identified in bell pepper (Miean and Mohamed 2001) and 387
tomato products (Vallverdú-Queralt, et al. 2011), but to the best of our knowledge, this 388
metabolite has not been reported previously for tomato seeds. The flavone apigenin and its 389
structural analogue luteolin are known to have anti-inflammatory (Hougee, et al. 2005; Rezai-390 4 5 6 7 8 9 10 11 12 13 14 15 16 17 18 19 20 21 22 23 24 25 26 27 28 29 30 31 32 33 34 35 36 37 38 39 40 41 42 43 44 45 46 47 48 49 50 51 52 53 54 55 56 57 58 59
Zadeh, et al. 2008), free radical scavenging properties (Yao, et al. 2004) and cancer-preventing 391
effects in humans (Chen, et al. 2006; Le Marchand 2002). 392
393
Citric acid is the predominant organic acid in tomato fruits (Davies 1966) and contributes to the 394
total acidity. A comparison of flavonol profiles in wild-type and mutant seeds showed that the 395
accumulation of citric acid and citric acid derivative were severely affected by the disruption of 396
the TF. Specifically, citric acid derivative rose above wild-type levels in mutant seeds except in 397
line 5. On the contrary, the levels of citric acid were dramatically decreased in all mutant seeds 398
compared to wild-type. These results uncover a potential regulatory role for the TF in citric acid 399
biosynthesis and conversion to organic derivatives in seeds, in addition to its role in regulating 400
citric acid in tomato flesh (Table 2). Previous studies have determined that the processes 401
involved in the metabolism and accumulation of citric acid are under both genetic and 402
environmental control (Etienne, et al. 2013), while during tomato ripening citric acid levels 403
increase (Anthon, et al. 2011). 404
405
Hydroxycinnamic acids (HCAs) are secondary metabolites and are widely distributed in plant 406
species. They are health promoting components as a result of their antioxidant activities. In 407
tomatoes, p-coumaric acid, caffeic acid and ferulic acid are the most abundant hydroxycinnamic 408
acids (Luthria, et al. 2006) contributing to the beneficial and health promoting effects of tomato 409
products. L1L4 mutations led to dramatically decreased levels of p-coumaric acid in lines 3 and 4 410
while it was nondetectable in lines 2, 5, 6, 7, 8 and 9, pointing to a regulatory role of L1L4 in p-411
coumaric accumulation. Similarly, in all mutant seeds except those in line 6, the level of caffeic 412 4 5 6 7 8 9 10 11 12 13 14 15 16 17 18 19 20 21 22 23 24 25 26 27 28 29 30 31 32 33 34 35 36 37 38 39 40 41 42 43 44 45 46 47 48 49 50 51 52 53 54 55 56 57 58 59
acid hexoside dimer decreased compared to wild-type. Phenolic compounds such as caffeic acid 413
and derivatives contribute to the bitter taste of immature green tomatoes. 414
415
Compared with wild-type, the L1L4 mutants showed a decrease in the level of glucaric acid in 416
seeds, with the exception of line 3 where an increase was detected. Notably, glucaric acid content 417
in seeds from lines 2, 4, 7 and 8 was reduced to 40% of wild-type level. Glucaric acid is formed 418
by the oxidation of glucose. The metabolite has been detected in camelina seeds, another oilseed 419
crop (Li, et al. 2015). D-glucaric acid (or saccharic acid) and its derivatives, normally present in 420
fruits and vegetables (Dwivedi, et al. 1990), have been associated with therapeutic uses including 421
cholesterol reduction (Walaszek, et al. 1996), diabetes treatment (Bhattacharya, et al. 2013) and 422
cancer prevention (Walaszek 1990). 423
424
Homoveratric acid, a biophenol compound, has been detected previously in tomato (Gómez-425
Romero, et al. 2010) and olive millwaste (Obied, et al. 2007). In the present study, the level of 426
homoveratric acid was reduced in mutant seeds of lines 4 and 8 while it was increased above 427
wild-type levels in seeds of lines 3, 5, 6 and 9. Only lines 2 and 7 maintained wild-type levels of 428
homoveratric acid. 429
430
Overall, it became evident that the single D23Y substitution present in line 4 was sufficient to 431
lower most of the seed metabolites examined, suggesting a negative interference in their 432 biosynthesis. 433 434 4 5 6 7 8 9 10 11 12 13 14 15 16 17 18 19 20 21 22 23 24 25 26 27 28 29 30 31 32 33 34 35 36 37 38 39 40 41 42 43 44 45 46 47 48 49 50 51 52 53 54 55 56 57 58 59
Hence, the parallel investigation of ZFN-based targeted L1L4 mutations revealed the significant 435
role of the TF in regulating tomato fruit quality while the effects on appearance were subtle in 436
the selected mutant lines and mostly related to the distal end protrusion and symmetry. Fruits 437
from lines 5, 6, 7 and 9 of the PCA group III, had good nutritional properties in terms of 438
antioxidant activity, though with a reduced protein content. Importantly, an improved cultivar 439
pertains not only to enrichment in nutrients but also to the low content of metabolites recognized 440
as anti-nutrients such as oxalic acid. In this context, our study links for first time L1L4 function 441
to oxalic acid accumulation in tomato fruits. 442
443
In silico reconstruction of putative biosynthetic pathways of L1L4-dependent metabolites 444
Due to the importance of tomato in human nutrition, we examined the in silico reconstruction of 445
selected portions of specific biosynthetic pathways involved in tomato metabolism as identified 446
by the analysis of metabolic profiles among the L1L4 mutant lines. In particular, the citrate, 447
galactose, ascorbate and carotenoids contents were significantly affected in several mutant lines, 448
suggesting a transcriptional regulation of the corresponding biosynthetic pathways by the TF. 449
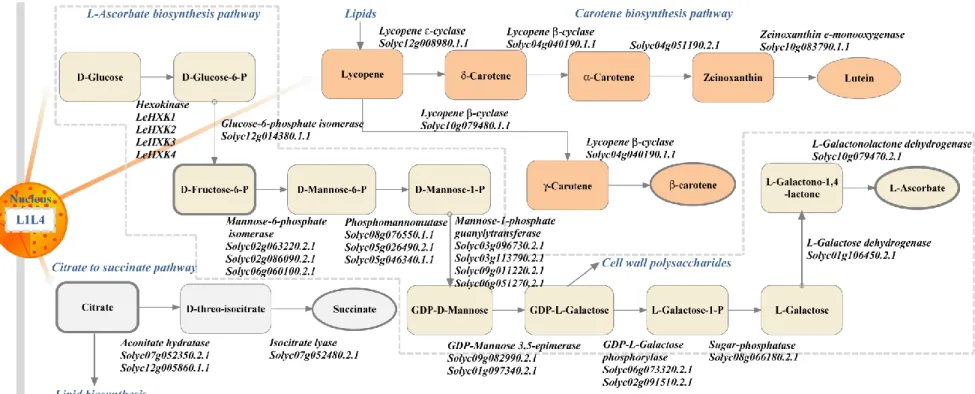
Based on the current data, we initially employed a reductionist computational approach 450
supported by the PMN software and the current biochemical knowledge to reconstruct three 451
putative metabolic pathways for the production of -carotene, L-ascorbate and succinate by 452
determining the initial and end compound. A model of the metabolic pathways is shown in 453
Figure 5. The L-ascorbate pathway (L-galactose pathway) has only been recently proposed in 454
plants (Wheeler, et al. 1998) and uses D-glucose as metabolic input. In our model, L-ascorbate is 455
formed from D-glucose in ten steps by Hexokinase (HXK), glucose-6-phosphate isomerase (EC 456
5.3.1.9), mannose-6-phosphate isomerase (EC 5.3.1.8), phosphomannomutase (EC 5.4.2.8), 457
mannose-1-phosphate guanylytransferase (GDP, EC 2.7.7.22), GDP-mannose 3,5 epimerase (EC 458 4 5 6 7 8 9 10 11 12 13 14 15 16 17 18 19 20 21 22 23 24 25 26 27 28 29 30 31 32 33 34 35 36 37 38 39 40 41 42 43 44 45 46 47 48 49 50 51 52 53 54 55 56 57 58 59
5.1.3.18), GDP-galactose phosphorylase (EC 2.7.7.69), sugar-phosphatase (EC 3.1.3.93), L-459
galactose dehydrogenase (EC 1.1.1.316) and L-galactonolactone dehydrogenase (EC 1.3.2.3). 460
461
Further investigation on metabolic genes putatively involved in the above pathways will enable 462
the engineering of tomato metabolite accumulation rationally in order to produce fruits with 463
specific nutritional compositions. The great diversity of metabolites produced in fruits as well as 464
the presence of gene families involved in metabolite biosynthesis pose limitations in the holistic 465
representation of the fruit system. Current techniques for reconstructing metabolic networks have 466
depended heavily on sequence homology searches (Bono, et al. 1998). PMN searches of genes 467
coding for key enzymes in the selected metabolic pathways against the entire tomato genome 468
enabled us to identify 31 gene models of S. lycopersicum fruit metabolism (Figure 5). Notably, 469
most of the predicted genes in the gene models are not functionally characterized in tomato while 470
multi-gene copies exist as in the case of mannose-1-phosphate guanylytransferase 471
(Solyc03g096730.2.1, Solyc03g113790.2.1, Solyc09g011220.2.1, Solyc06g051270.2.1). Another 472
gene family encoding HXK has been previously characterized in tomato (Dai, et al. 2002; 473
Kandel-Kfir, et al. 2006; Menu, et al. 2001). Interestingly, in the HXK gene family only LeHXK4 474
was expressed in young fruits (Kandel-Kfir, et al. 2006). Genes that are directly regulated by 475
L1L4 TF should be enriched for the CCAAT consensus LEC1 (CBF) binding element in their 476
promoters. The biological validity of the computational prediction of gene candidates shown in 477
Figure 5 will be verified in future experiments using L1L4 mutant backgrounds. 478 479 CONCLUSIONS 480 4 5 6 7 8 9 10 11 12 13 14 15 16 17 18 19 20 21 22 23 24 25 26 27 28 29 30 31 32 33 34 35 36 37 38 39 40 41 42 43 44 45 46 47 48 49 50 51 52 53 54 55 56 57 58 59
Targeted genome technologies are a young field in metabolic engineering of plants. The results 481
of the current study in tomato fruits attempt to fill this gap in knowledge by demonstrating that 482
ZFN-mediated targeted disruption of the master developmental regulator L1L4 affects major fruit 483
and seed metabolites which were hard to predict. The mutations were found between the residues 484
20 and 38 of L1L4 protein, which suggests that the region is under relaxed selection and 485
mutations can be tolerated. This in turn, generates novel insight on L1L4 function in fruit quality. 486
The identification of identical phenotypes (e.g. metabolic and morphologic) in several mutant 487
fruits shows the robustness of the ZFN technology. The current data establish a relationship 488
between high-order regulators of gene expression and physiological-metabolic phenotypes of 489
tomato fruit. L1L4 TF appears to be a negative regulator of fiber, fructose, succinic and shikimic 490
adic biosynthesis and a positive regulator of citric and oxalic acid. The single gene-based 491
variations in metabolite composition may direct breeding for specific nutritional and/or anti-492
nutritional needs, such as fruits with high fructose content or low oxalate for diabetic diets. 493
While L1L4 mutagenesis effect on fruit quality may be specific to tomato, it may be common or 494
provide guidance for other fleshy-fruited plants. 495
496
MATERIALS AND METHODS 497
Plant material 498
Tomato seeds of S. lycopersicum (cv. Heinz 1706), control (wild-type/WT) and eight different 499
L1L4 gene disruption lines from M4 generation, obtained at Institute of Applied Biosciences 500
(Thessaloniki, Thermi, 57001, Greece) were sown in a plastic greenhouse at the University of 501
Algarve (located in Faro, Portugal), and the resulting seedlings were transplanted to pots. Plants 502
were grown in the greenhouse under normal culture procedures until the end of fruit harvest 503 4 5 6 7 8 9 10 11 12 13 14 15 16 17 18 19 20 21 22 23 24 25 26 27 28 29 30 31 32 33 34 35 36 37 38 39 40 41 42 43 44 45 46 47 48 49 50 51 52 53 54 55 56 57 58 59
period in June-July 2013. The greenhouse was ventilated when the temperature exceeded 24 ºC. 504
For each tomato line and replication, 6 to 10 completely red and firm ripe fruits were harvested 505
randomly from different plants of the same genetic line. 506
507
ZFN-based L1L4 mutant lines 508
ZFN technology was used to develop tomato lines in which the L1L4 has been disrupted in the 509
coding region (Hilioti, et al. 2016). Different L1L4 disruption lines of M4 generation were
510
selected by genotyping. 511
512
RNA extraction and cDNA synthesis 513
RNA from leaf tissue (100 mg) was extracted using the NucleoSpin RNA plant kit (Macherey-514
Nagel). cDNA synthesis was performed using the PrimeScript first strand cDNA synthesis kit 515
(TaKaRa). To detect DNA changes at target site, cDNA isolated from mutant lines of M4 516
generation and wild type (control) was used as template in PCR-based analysis. 517
518
Detection of ZFN-induced modifications at L1L4 locus 519
High Resolution Melting (HRM) analysis on founder plants and selected progenies (M4
520
generation) was performed using F1: GCTATCGCAGATCTCCACAACCAACC and R2: 521
CGTTTGGTATGACTTCGTCTTGCTCCTG primers flanking the L1L4 (Solyc05g005350) 522
target site to amplify a 131 bp product in cDNA. HRM analysis was performed in a total volume 523
of 15 μL on a Rotor-Gene 6000 real-time 5P HRM PCR Thermocycler (Corbett Research, 524
Sydney, Australia). The reaction mixture contained 20 ng genomic DNA, 1X PCR buffer, 2.5 525
mM MgCl2, 0.2 mM dNTP, 300 nM forward and reverse primers, 1.5 mM Syto® 9 green
526
fluorescent nucleic acid stain (Life Technologies Corp., Paisley, UK) and 1 U Kapa Taq DNA 527 4 5 6 7 8 9 10 11 12 13 14 15 16 17 18 19 20 21 22 23 24 25 26 27 28 29 30 31 32 33 34 35 36 37 38 39 40 41 42 43 44 45 46 47 48 49 50 51 52 53 54 55 56 57 58 59
polymerase (Kapa Biosystems, Cape Town, South Africa). The PCR protocol was conducted in a 528
36-well carousel, using an initial denaturing step of 95 °C for 3 min followed by 35 cycles of 529
denaturation at 95 °C for 20 sec, annealing at 60 °C for 20 sec, extension at 72 °C for 20 sec and 530
final extension at 72 °C for 10 min. All samples including the wild-type were plotted according 531
to their melting profiles. Shape differences in melting curves relative to wild-type control were 532
indicative of sequence changes within the amplicon analyzed. For sequencing data, primers F4: 533
ATGGATGGTGGTTCAGGAAATG and R2 (as above) were used in PCR reactions with cDNA 534
as template. 535
536
Fruit size, color evaluation and fruit quality parameters 537
Following fruit maturity, a minimum of 18 ripe tomatoes (3 replication with 6 fruits each one) 538
from each line were evaluated for a series of phenotypic traits related to fruit size: fruit weight, in 539
grams; fruit length was obtained by measuring, in centimeters, from stem to blossom end; fruit 540
width was measured, in the equatorial zone of the fruit, using a caliper. 541
542
Tomato surface color was determined at 3 points around the fruit using a Chroma meter CR-300 543
series (CE Minolta, Japan) in CIE L* a* b* color space. The L* value indicates lightness 544
(black=0 and white=100), a* changes from green (negative values) to red (positive values) and 545
b* from blue (negative values) to yellow (positive values). The a* and b* readings were 546
converted to the vectorial coordinates hue angle (h) and chroma (C*) using the equations h = arc 547
tan b*/a* and C* = (a*2 + b*2)1/2, respectively (McGuire 1992). 548
549
Firmness was determined on two opposite sides of each fruit using a Chatillon Force TCD 200 550
and Digital Force Gauge DFIS 50 (Jonh Chatillon & Sons, Inc., Largo, FL, USA), by measuring 551 4 5 6 7 8 9 10 11 12 13 14 15 16 17 18 19 20 21 22 23 24 25 26 27 28 29 30 31 32 33 34 35 36 37 38 39 40 41 42 43 44 45 46 47 48 49 50 51 52 53 54 55 56 57 58 59
the force required for a 6-5 diameter probe (conical for the last 3 mm) to penetrate a tomato fruit 552
to a depth of 7 mm through the skin. 553
554
After quantification of the parameters referred to above, the fruits from each replication were 555
longitudinally cut into quarters and all the seeds were extracted for separate analysis. Three 556
quarters of each fruit were stored at -80 ºC for later use. The remaining quarter of each fruit in 557
each replication was ground using an UltraTurrax mixer T18 (IKA, Starfen, Germany) and the 558
juice was extracted by squeezing the fruit mixture through cheesecloth. The juice aliquot was 559
collected and frozen at -80 ºC until use. The remaining juice obtained was used to quantify 560
soluble solids content (SSC) and titratable acidity (TA). SSC was measured in juice using a 561
digital refractometer (Model PR-100, Atago Co., Tokyo, Japan). 562
563
Titratable acidity was determined by titration of the juice with 0.1M of NaOH to the end-point of 564
pH 8.2 and the results expressed as percentage of citric acid. 565
566
A taste index (TI) was calculated from the SSC data and the titratable acidity, as previously 567
described (Navez, et al. 1999), using the following expression: TI = [SSC pulp/(20*titratable 568
acid)] + titratable acidity. 569
570
Fruit composition 571
Moisture, fiber, protein and ash content 572
Moisture was determined by desiccation at 105 ºC for about 24 h till constant weight (Horwitz, et 573
al. 2000). Total dietary fiber (TDF) was evaluated using a commercial kit (Sigma-Aldrich, St. 574
Louis MO, USA). This assay determines the TDF content using a combination of enzymatic and 575 4 5 6 7 8 9 10 11 12 13 14 15 16 17 18 19 20 21 22 23 24 25 26 27 28 29 30 31 32 33 34 35 36 37 38 39 40 41 42 43 44 45 46 47 48 49 50 51 52 53 54 55 56 57 58 59
gravimetric methods (Horwitz, et al. 2000). Lyophilized tomato samples (1 g) were gelatinized 576
with a heat-stable α-amylase (pH 6, 100 °C, 15 min) and then enzymatically digested 577
sequentially with protease (pH 7.5, 60 °C, 30 min) and amyloglucosidase (pH 6, 60 °C, 30 min). 578
TDF was precipitated with ethanol, and after washing and drying, the residue was weighed. Part 579
of the residue was analyzed for nitrogen content by the Kjeldahl method (Bradstreet 1954). 580
Nitrogen content was multiplied by a conversion factor of 6.25 to calculate protein content. 581
Another part of the residue was used for ash analysis by combustion in a furnace at 550 ºC for 5 582
hours. TDF values were recorded after subtracting protein and ash contents. 583
584
Extraction, quantification of sugars and sweetness index 585
Extraction and quantification of sugars (fructose, glucose and sucrose) were based on a method 586
described by (Terry, et al. 2007) and modified as described previously (Magwaza, et al. 2012). 587
Briefly, a 150 ± 0.5 mg of fruit powder was extracted in 3 mL 62.5% (v/v) aqueous methanol. 588
Following extraction, the concentrations of fructose, glucose and sucrose were determined in an 589
HPLC binary pump system (L-2130, Elite LaChrom series, Hitachi, Japan). Ten µL of a diluted 590
sample solution (1:10) was injected into a Purospher Star NH2 (amino) column (4.6 mm diameter
591
× 250 mm, 5 µm particle size; Merck Millipore, Germany) with an amino guard column 592
(LiChroCART 4-4 Merck Millipore, Germany). The thermostatic column compartment 593
temperature was set at 35 ºC. The mobile phase used was HPLC-grade water at a flow rate of 1.0 594
mL/min and the presence of carbohydrates was detected on a refractive index detector (RID, L-595
2490, Elite LaChrom series, Hitachi, Japan). Sugars were quantified from a linear standard curve 596
(0.05–1.25 mg/mL; average R2= 0.99). 597
598
Extraction and quantification of non-volatile organic acids 599 4 5 6 7 8 9 10 11 12 13 14 15 16 17 18 19 20 21 22 23 24 25 26 27 28 29 30 31 32 33 34 35 36 37 38 39 40 41 42 43 44 45 46 47 48 49 50 51 52 53 54 55 56 57 58 59
Non-volatile organic acids (ascorbic, citric and oxalic acid) were extracted and determined using 600
a method described previously (Crespo, et al. 2010) with slight modifications (Magwaza, et al. 601
2013). Briefly, 50 ± 0.5 mg of freeze dried samples were cold extracted for 5 min in 3 mL of 602
HPLC water. The flocculate was filtered through a 0.2 m syringe filter before HPLC analysis. 603
Ascorbic, citric and oxalic acid concentrations were determined on a HPLC binary pump system 604
equipped with a diode array detector (DAD, L-2455, Elite LaChrom series, Hitachi, Japan) with 605
multiple wavelength detector, degasser and cooled autosampler. The filtered sample extract (20 606
µL) was injected into a Purospher Star RP-18 column (4.6 mm diameter × 250 mm, 5 µm 607
particle size, Merck Millipore, Germany) with an organic acid guard column (LiChroCART 4-4 608
Merck Millipore, Germany). Temperature of the column was set to 35 ºC using a thermostated 609
column compartment (L-2300, Elite LaChrom series, Hitachi, Japan). The mobile phase used 610
was 0.2% HPLC-grade aqueous metaphosphoric acid at a flow rate of 1.0 mL/min. Non-volatile 611
organic acids were detected at 210 nm except for ascorbic acid which was detected at 245 nm 612
and quantified using linear standard curves (0.01–1.25 mg/mL; average R2= 0.99). 613
614
Antioxidant composition 615
Extraction and assay of total phenols (Folin-Ciocalteau) 616
The total phenolic content was determined using the Folin-Ciocalteau reagent and gallic acid as 617
standard as described by Slinkard and Singleton (Slinkard and Singleton 1977). Tomato juice 618
(0.2 mL) or gallic acid concentration was mixed with 0.8 mL of an aqueous sodium carbonate 619
solution (75 g L-1) and were added to 1 mL of 10% (v/v) Folin-Ciocalteau reagent. After 30 min
620
of reaction at room temperature, the absorbance was measured at 765 nm in a Shimadzu, UV-621
visible recording spectrophotometer model UV-160A (Shimadzu Corporation, Kyoto, Japan). 622 623 4 5 6 7 8 9 10 11 12 13 14 15 16 17 18 19 20 21 22 23 24 25 26 27 28 29 30 31 32 33 34 35 36 37 38 39 40 41 42 43 44 45 46 47 48 49 50 51 52 53 54 55 56 57 58 59
β-Carotene and lycopene 624
β-Carotene and lycopene were determined following a procedure previously described (Nagata 625
and Yamashita‚ I 1992; Pinela, et al. 2012), measuring the absorbance at 453, 505, 645 and 663 626
nm. Contents were calculated according to the following equations: β-carotene (mg/100 ml) = 627
0.216 × A663 – 1.220 × A645 - 0.304 × A505 + 0.452 × A453; lycopene (mg/100 ml) = − 0.0458 ×
628
A663 + 0.204 × A645 - 0.304 × A505 + 0.452 × A453, and further expressed in mg per 100 g fruit.
629
A663, A645, A505 and A453 are absorbance at 663nm, 645nm, 505nm and 453nm, respectively.
630 631
Flavonoid content 632
Flavonoid content was quantified as described by (Ahn, et al. 2007). Briefly, 0.5 mL of 2% 633
AlCl3-ethanol solution was added to 0.5 mL of sample or standard. After 1 h at room
634
temperature, the absorbance was measured at 420 nm. Quercetin was used as standard for the 635
construction of calibration curve. 636
637
Evaluation of antioxidant activity 638
Oxygen radical absorbance capacity (ORAC) 639
The antioxidant activity by the method ORAC measures the ability of samples for scavenging 640
peroxyl radicals. The ORAC method used, with fluorescein (FL) as the fluorescent probe, was 641
that described previously (Ou, et al. 2001). As the ORAC assay is extremely sensitive, the 642
samples must be diluted appropriately before analysis to avoid interference. In each well, 150 μL 643
of fluorescein working solution and 25 µL sample previously diluted, blank (75 mM phosphate 644
buffer) or standard (Trolox) were placed. The plate was covered with a lid and incubated in the 645
pre-heated (37 °C) Tecan Infinite M200 Microplate Reader for 10 min with a previous shaking 646
of 3 min. The 2, 2-Azobis-2-methyl-propanimidamide dihydrochloride (AAPH) was added to 647 4 5 6 7 8 9 10 11 12 13 14 15 16 17 18 19 20 21 22 23 24 25 26 27 28 29 30 31 32 33 34 35 36 37 38 39 40 41 42 43 44 45 46 47 48 49 50 51 52 53 54 55 56 57 58 59
each well of the plate, except for the control and blank. The final volume of the assay was 200 648
µL. The fluorescence was read every minute for 90 min at excitation of 485 nm and emission of 649
527 nm. The ORAC values are calculated according to a previous work (Huang, et al. 2002). 650
Briefly, the net area under the curve (AUC) of the standards and samples was calculated. The 651
standard curve was obtained by plotting Trolox concentrations against the average net AUC of 652
the two measurements for each concentration. Final ORAC values were calculated using the 653
regression equation between Trolox concentration and the net AUC and were expressed as mmol 654
Trolox/100 g fresh weight. 655
656
Trolox equivalent antioxidant activity (TEAC) 657
The preformed radical monocation of 2, 2-azinobis-(3-ethylbenzo-thiazoline-6-sulfonic acid) 658
(ABTS) was generated according to the modified method of Re et al. (Re, et al. 1999), as 659
described elsewhere (Antunes, et al. 2010). For the assay, 10 μL of the extract was added to 990 660
µL of ABTS radical cation solution. The absorbance was monitored spectrophotometrically at 661
735 nm for 6 min (Shimadzu spectrophotometer 160-UV). The antioxidant activity of each 662
sample was calculated using the following equation: scavenging effect % (IA%) = (1 − Af/A0) × 663
100, where A0 stands for the absorbance of the control and Af for the absorbance in the presence 664
of the sample. The values were compared with the standard curve constructed with a series of 665
Trolox concentrations and the values were expressed as mM Trolox equivalent antioxidant 666
capacity. 667
668
LC-MC/MS-based metabolic profiling in tomato seeds 669
Wild-type and L1L4 mutant seeds of the M4 generation were ground in liquid nitrogen and stored
670
at -80 °C. Mature seed tissue was extracted in 80% methanol (HPLC grade) and then vortexed 671 4 5 6 7 8 9 10 11 12 13 14 15 16 17 18 19 20 21 22 23 24 25 26 27 28 29 30 31 32 33 34 35 36 37 38 39 40 41 42 43 44 45 46 47 48 49 50 51 52 53 54 55 56 57 58 59
for about 20 s. Subsequently, the samples were centrifuged at 11,000 g for 15 min at 4 °C to 672
remove protein pellets. Next, the cleared supernatants containing extracted metabolites were 673
transferred into aliquots for LC-MS/MS analyses. Metabolites were identified by triplicate 674
analysis of single seed extracts. 675
676
Statistical analysis 677
Analysis of variance (ANOVA) was performed on the data and, when needed, means were 678
compared using Duncan’s Multiple Range Test at P < 0.05. Pearson correlation was used to test 679
whether two traits varied together for all possible pairwise comparisons. Software utilized for the 680
statistical treatments was SPSS (SPSS Inc., Chicago, USA). Principal component analysis (PCA) 681
and hierarchical cluster analysis (HCA) were performed using the statistical software Chemoface 682
version 1.5 (Nunes, et al. 2012). 683
684
Metabolic and gene pathway inference 685
The metabolic pathways as well as the gene identities in each pathway have been 686
computationally predicted by PMN (http://pmn.plantcyc.org/) using species-specific pathway 687
databases, selection of the initial and end metabolite and specification of the number of 688
maximum path length. 689
690 691
ACKNOWLEDGMENTS 692
This work was benefited from the networking activities within the European funded 693
COST ACTION FA1106 Quality Fruit. 694 695 696 4 5 6 7 8 9 10 11 12 13 14 15 16 17 18 19 20 21 22 23 24 25 26 27 28 29 30 31 32 33 34 35 36 37 38 39 40 41 42 43 44 45 46 47 48 49 50 51 52 53 54 55 56 57 58 59