O R I G I N A L A R T I C L E
Anthropometric predictors of body fat in a large population of
9-year-old school-aged children
Sílvia M Almeida
1,2,, José M Furtado
1,2, Paulo Mascarenhas
2, Maria E Ferraz
1, Luís R Silva
1,2, José C
Ferreira
1,3, Mariana Monteiro
4, Manuel Vilanova
5,6and Fernando P Ferraz
1,21Centro de Genética Médica e Nutrição
Pediátrica Egas Moniz, Campus
Universitário, Monte da Caparica, Portugal;
2
Instituto Superior de Ciências da Saúde Egas Moniz, Campus Universitário, Monte da Caparica, Portugal;3Department of
Obstetrics and Gynecology of University of Medicine of Warsaw, Warsaw, Poland;
4Clinical and Experimental Endocrinology
Group, Unit for Multidisciplinary Research in Biomedicine UMIB, ICBAS, University of Porto, Portugal;5Instituto de Investigação e Inovação em Saúde, and IBMC– Instituto de Biologia Molecular e Celular,
Universidade do Porto, Portugal;6Instituto de Ciências Biomédicas de Abel Salazar, Universidade do Porto, Portugal
Received 29 January 2016; revised 31 May 2016; accepted 12 June 2016
Address for correspondence: SM Almeida, Campus Universitário, Quinta da Granja, Monte de Caparica, 2829-511 Caparica, Portugal. E-mail: [email protected] This manuscript has been revised by BioMed Proofreading.
Summary
Objective
To develop and cross-validate predictive models for percentage body fat (%BF) from anthropometric measurements [including BMI z-score (zBMI) and calf circumference (CC)] excluding skinfold thickness.
Methods
A descriptive study was carried out in 3,084 pre-pubertal children. Regression models and neural network were developed with %BF measured by Bioelectrical Impedance Analysis (BIA) as the dependent variables and age, sex and anthropometric measure-ments as independent predictors.
Results
All %BF grade predictive models presented a good global accuracy (≥91.3%) for obesity discrimination. Both overfat/obese and obese prediction models presented respectively good sensitivity (78.6% and 71.0%), specificity (98.0% and 99.2%) and reliability for positive or negative test results (≥82% and ≥96%). For boys, the order of parameters, by relative weight in the predictive model, was zBMI, height, waist-circumference-to-height-ratio (WHtR) squared variable (_Q), age, weight, CC_Q and hip circumference (HC)_Q (adjusted r2= 0.847 and RMSE = 2.852); for girls it was zBMI, WHtR_Q, height, age, HC_Q and CC_Q (adjusted r2= 0.872 and RMSE = 2.171).
Conclusion
%BF can be graded and predicted with relative accuracy from anthropometric measure-ments excluding skinfold thickness. Fitness and cross-validation results showed that our multivariable regression model performed better in this population than did some previ-ously published models.
Keywords: Anthropometry, body fat grade models, prediction equations, children.
Introduction
Childhood obesity is a worldwide epidemic and World Health Organization European Region studies indicate Portugal as the country with the highest rate of over-weight among 7 to 9-year-old children (1).
There is evidence supporting improved outcomes for interventions aiming at early detection and correction of
overweight (2,3). Frequently, Body Mass Index (BMI) [weight (kg) / height (m)2] is used as a screening tool of obesity. However, as all methods based on weight and height, the major limitation is its inability to distinguish weight status from adiposity (4,5).
Ideally, the definition of childhood obesity should accurately reflect body fat and have cut-off points to predict adverse health effects (6,7). Because children are constantly growing, this task becomes more difficult than in adults and any measure of excess weight need to be adjusted to age (6,7).
This manuscript has been revised by BioMed Proofreading.
© 2016 The Authors. Obesity Science & Practice published by John Wiley & Sons Ltd, World Obesity and The Obesity Society. Obesity Science & Practice 272
Accurate methods to assess adiposity [e.g, densi-tometry, dual-energy x-ray absorptiometry (DXA), computed tomography] are not suitable for use as a screening tool (8). As an alternative, anthropometric measurements, such as BMI, waist circumference (WC), hip circumference (HC), mid-upper arm circumference (MUAC), calf circumference (CC) and subcutaneous skinfold thickness [triceps (TSF) and subscapular (SSF)] can be performed easily, quickly, inexpensively, reliably and can be used in epidemiologic studies (8). However, there is no general consensus on the reliance, use and application of single anthropometric indices as identifiers of adiposity in children (6). Therefore, specific predictive equations of %BF from several anthropometric measure-ments have been developed in children (9–13). However Goran et al. (10) failed in validating Slaughter equation, reason why they derived a new one. Dezenberg et al. (11) also found that both Goran (10) and Slaughter (13) equations did not accurately predict fat mass in a hetero-geneous group of children. Furthermore, these cross-validated equations are skinfold dependent, which has many disadvantages such as not being recommended for children of the same age and sex with BMI >95th percentile (14,15).
Therefore, the present study’s main objective is to develop new, sex-specific, %BF predictive models derived from simple anthropometric measurements excluding skinfold thickness. Prior to the determination of %BF, all children were also assessed for overweight (as defined by BMI) (16,17) and overfatness (as defined by bioimpedance estimates of body fatness) (18) with specifically developed %BF grade prediction models. Using %BF cut-offs, children were categorized into four grades (‘underfat’, ‘normal’, ‘overfat’ and ‘obese’) (18) or only into two grades (‘overfat/obese’ and ‘others’ or only ‘obese’ and ‘others’). Such models were built for obesity screening purposes using simple anthropometric measurements. Finally, the predictive model was cross-validated and compared with previously published models.
Methods
Study design and participants
The descriptive and the multivariable regression analysis here reported are part of a Project titled ‘Nutritional, Biochemical and Genetic Study of an Overweight and Obese Children Population in the Southern Region’, approved by the Directorate General of Health, the Ministry of Science and Education and also by the Ethics Committee of the Hospital Garcia de Orta, according to Helsinki Declaration. The project was carried out from
January of 2009 to June 2013 in a population of pre-pubertal children (based on Tanner stage) recruited from 87 public schools of Lisbon and Tagus Valley urban region and included anthropometric, BIA, biochemical and genetic analysis.
To be included in the study, the children should have completed 9 years of age during the ongoing school year, with the exact chronologic ages calculated in days, as the date of examination minus birth date. This assumption reduced the initial population of 5,989 to 5,577 children. The age criteria was applied because it is a late enough age for obesity rebound and because, at this age, there is less possibility of spontaneous regularization of corpu-lence (19).
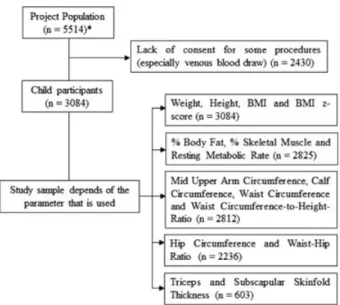
Children transferred to another school, missing the minimal required measurements or whose parents aban-doned participation were also excluded, leaving 5,514 children. All children’s parents were required to give in-formed consent to participate in the study. Because of lack of consent for some of the procedures, especially venous blood draws (out of the scope of this specific study), the number of children enrolled was reduced to 3,084 (Figure 1).
Anthropometric and bioelectrical impedance
analysis
Clinical procedures were carried out at school under the guidance of two pediatric specialists, which had previ-ously been assessed for the equivalence of their measur-ing performance. All anthropometric measurements were taken with participants dressed in lightweight clothing and without shoes.
Height was measured to the nearest 0.1 cm at the end of a deep inspiration (20) (stadiometer – Seca 217, Hamburg, Deutschland). Weight was measured to the nearest 0.1 kg (digital calibrated scale– Seca 899). zBMI was determined using the least mean squares method (21) and was used to categorize subjects as‘thin’ (grades 1, 2 and 3), ‘normal weight’, ‘overweight’ or ‘obese’ according to World Obesity/Policy and Prevention (Inter-national Obesity Task Force– IOTF) cut-offs (16,17).
The following circumference measurements, also taken, to the nearest 0.1 cm, with the tape snug but not compressing the skin, were made using a flexible and inextensible tape (Seca 203)
MUAC was measured on the upper left arm, flexed at 90°, at the midpoint between the acromion and the olecranon (20). CC was measured at the point of the widest diameter of the calf (20). Both measurements were taken while participants were sitting. WC and HC were measured in the standing position, with the first at umbilicus level (22) at the end of normal expiration and © 2016 The Authors.
the second at the widest part of the hip at the level of the great trochanter (20). Waist–hip ratio (WHR) was defined as WC/HC. WHtR was defined as WC/height.
Skinfold thickness was measured with a Harpender Skinfold Caliper (West Sussex, UK) at two sites (TSF and SSF), was read twice and the mean value was recorded. Whenever the two values differed greatly, a third measurement was made. Measurements were recorded by one observer for the left side of the body (20) to the precision of ±0.5 mm. For the measurement of TSF, the midpoint of the back of the upper arm between the tips of the olecranon and the acromion processes was determined with the arm flexed at 90° (20). The SSF was measured at immediately below the inferior angle of the scapula (20). Centrality index was defined as SSF/TSF.
Tetrapolar whole-body BIA (measured with Omron BF 511 – 500 mÅ, 50 KHz, Kyoto, Japan) was used to evaluate %BF, percentage of skeletal muscle (%SM) and resting metabolic rate (RMR), all of which have been validated previously in children against Magnetic Resonance Imaging findings (23). Children were measured 2 h or more after breakfast according to the manufacturer instructions. For the assessment of adipos-ity, based on bioimpedance, four grades (‘underfat’, ‘normal’, ‘overfat’ and ‘obese’) were defined using McCarthy body fat reference curves for children and adolescents (18).
Statistical analysis
Descriptive statistic, group comparison tests, modeling and associated plots were performed using SPSS 23.0 (IBM corp., Armonk, NY, US). Missing data were ignored and outliers were included in the statistics.
Because parametric assumptions were not met across all groups, Spearman correlations evaluated the relation-ship between the anthropometric measures and both BMI z-score and %BF, and Kruskal–Wallis ANOVA, Mann–Whitney ranks and Mood’s median tests were used for group comparisons. A Mann–Whitney multi-comparison test was applied in groups with a case size above 20. For smaller groups, differences were evaluated through Hedge’s g effect size.
Next, and for cross-validation purposes, the sample was split, for each model, into two different sets with % BF stratification: 70% of the sample was randomly selected from %BF strata and allocated to a model-training sample set, while the remaining 30% was allocated to a validation sample set. Anthropometric features, measured %BF and other characteristics of each set were compared through Mann–Whitney test to check for homogeneity between the two groups. Models for %BF grade classification and for %BF value predic-tion were built and evaluated.
Percentage BF grade predictors were developed using the measured anthropometric variable’s training data Figure 1 Flowchart of child participation in the study. *Project population sample was used to characterize the nutritional status of the population.
through multinomial/binomial logistic regression and neural network (NN) analysis and the outcomes were further evaluated through Bayesian analysis. The global working sample size was dependent on the selected variables and is reported in Table 2 for each obesity grade predictor. Finally, to build a %BF predictive model the best candidate parameter was pre-selected through a stepwise forward, based on the Akaike information crite-rion across 1,000 bootstrap regression models. This bagging procedure required no missing values for all the candidate variables reducing the available sample to 2,201 children. This sample were split in two different sets: 70% were randomly assigned from %BF strata to a model-training set, while the remaining 30% were allocated to a cross-validation set. To build a linear regression, a model training set was used, choosing the final model parameters through stepwise forward. Model fitness was evaluated through root mean square error (RMSE) and adjusted r2. Root mean square prediction error (RMSPE) and the measured versus predicted adjusted r2 were used as cross-validation performance indexes to validate each model development step.
Furthermore, our %BF measurements were compared with %BF values calculated from previously published %BF prediction equations. Most of these equations required skinfold thickness data, reducing the working sample to 603 children. Cross-validation indexes such as the mean predicted %BF, the measured versus predicted adjusted r2 as well as the RMSPE were calculated. Significant differences between the predicted and measured %BF were screened by the paired Student’s t test. Statistical significance was considered when p< 0.05. The equations that were used in the com-parison were Slaughter et al. (13), Goran et al. (10), Dezenberg et al. (11) and Marrodán et al. (24), because their parameters are included in those used in this study.
Results
A population sample of 5,514 schoolchildren (2,772 boys and 2,742 girls) with mean age 9.75 ± 0.57 years was characterized anthropometrically. Results showed that according to IOTF definition, 6.2% were ‘underweight’ (thinness grades 1, 2 or 3), 66.1% were‘normal weight’, 27.6% were ‘overweight’ including 6.9% ‘obese’ (Table S1).
Mean values of anthropometric characteristics, with the exception of BMI, zBMI, WHR and %SM, were signif-icantly higher in girls than in boys (Mann–Whitney, p< 0.05) (Tables 1 and S1).
The ethnic composition of the sample subjects was 87.4% Caucasian, 11.3% Afro-Portuguese and 1.3% other ethnicities. Differences between ethnicities were
found in WC, HC, WHR, %BF and %SM (Kruskal–Wallis, p< 0.05), with Afro-Portuguese children having lower values, but being higher than Caucasian children (Mann–Whitney, p < 0.05) (Table 1).
Like zBMI, %BF was also categorized by adiposity grades. Differences were noticed for height (between ‘underfat’, ‘normal’ and ‘overfat’ and also between ‘over-fat’ and ‘obese’ groups), WHR and SSF (both between ‘underfat’ and ‘normal’ groups) (Table S2). Figure 2 illus-trates how sample size was dependent on the selected variables.
There were different strengths in the association between %BF and the measured anthropometric variables. Results indicates that all parameters, except WHR (r = 0.307) and %SM (r = 0.462), showed a strong correlation with %BF. Nevertheless, zBMI (r = 0.935), BMI (r = 0.902) and WHtR (r = 0.838) presented the highest values (Table S3). Scatter plots between %BF and anthropometric parameters (Figure S1) were constructed to further explore these relationships. Because most scatter plots demonstrate a slight upward curve, just like the one present in the association between %BF and zBMI (Figure 3), four non-linear models (quadratic, cubic, logarithmic and exponential) were compared. The linear, quadratic and cubic presented the highest squared corre-lation values (Table S4). Because no meaningful differ-ence was found and for simplicity, quadratic models were selected.
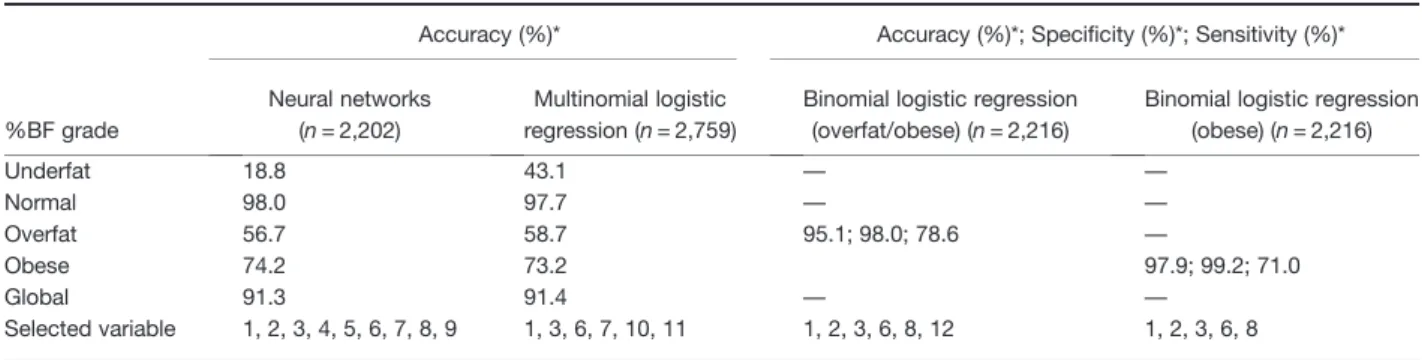
For the creation of screening models, all anthropomet-ric measurements (including quadratic functions of the parameters) as well as age and sex were taken into account. However, only the variables that contributed most to the classification model, and the associated cross-validation performance results, are presented in Table 2. Results indicate that the NN model failed to classify children who were in the‘underfat’ grade (18.8% correctly predicted) and, in less extension, those in the ‘overfat’ grade (56.7% correctly predicted). In contrast to the previous model, the multinomial logistic model (MLM) approach showed a higher accuracy in classifying ‘underfat’ grade children. The global cross-validation results of the two models show that both are very strong obesity grade predictors: 91.3% for NN versus 91.4% for MLM. Individual analyses of each group demonstrate that NN is a better classification predictor for ‘normal’ and ‘obese’ grades. Most significant differences are found in the ‘underfat’ and ‘overfat’ grade groups (18.8% and 56.7% for NN, 43.1% and 58.7% for MLM, respectively). For the creation of only two grades screening models (‘overfat/obese’ or exclusively ‘obese’ child grades), a binomial logistic regression was built. The results indicate that when BMI z-score, WHtR, WC, weight, height and sex parameters were used, 95.1% of children belonging © 2016 The Authors.
Table 1 Descriptive characteristics (by sex and ethnicity) of the study sample Sex Ethnicity Male Female Caucasian Afro-Portuguese Others Characteristic n Mean ± S D n Mean ± S D n Mean ± S D n Mean ± S D n Mean ± S D Age ¥ 1,487 9.78 ± 0.58* 1,597 9.73 ± 0,56* 2,560 9.71 ± 0.57 a 331 9.88 ± 0.65 a 37 9.69 ± 0.55 a Weight (kg) 1,487 35.26 ± 8,45** 1,597 35.57 ± 8.35** 2,560 35.31 ± 8.47 a 331 36.15 ± 8.32 a 37 34.56 ± 7.75 a Height (cm) 1,487 138.3 ± 6.99* 1,597 138.2 ± 7.33* 2,560 137.9 ± 7.12 a 331 140.8 ± 7.27 b 37 137.1 ± 7.64 a BMI (kg/m(2)) 1,487 18.44 ± 3.18** 1,597 18.24 ± 3.19** 2,560 18.37 ± 3.21 a 331 18.08 ± 3.09 a 37 18.23 ± 3.01 a BMI z-score 1,487 0.60 ± 1.08** 1,597 0.66 ± 1.06** 2,560 0.64 ± 1.07 a 331 0.50 ± 1.12 a 37 0.63 ± 0.98 a WC (cm) 1,368 64.75 ± 8.84** 1,444 65.68 ± 9.25** 2,382 65.33 ± 9.15 a 294 63.76 ± 8.27 b 34 64.51 ± 9.0 a,b HC (cm) 1,078 71.03 ± 7.81** 1,158 72.53 ± 8.00** 1,955 71.8 ± 7.89 a 235 72.2 ± 8.45 a 27 68.9 ± 7.0 a WHR (WC/HC) 1,078 0.90 ± 0.05** 1,158 0.89 ± 0.06** 1,955 0.90 ± 0.06 a 235 0.88 ± 0.05 b 27 0.90 ± 0.04 a WHtR (WC/height) 1,368 0.47 ± 0.05** 1,444 0.48 ± 0.06** 2,385 0.47 ± 0.57 a 294 0.45 ± 0.05 b 34 0.47 ± 0.05 a MUAC (cm) 1,368 20.94 ± 2,94** 1,444 21.32 ± 2.74** 2,385 21.2 ± 2.85 a 294 21.3 ± 2.80 a 34 20.4 ± 2.43 a CC (cm) 1,368 29.08 ± 3.25* 1,444 29.09 ± 3.27* 2,385 29.1 ± 3.29 a 294 28.9 ± 3.14 a 34 28.4 ± 3.15 a TSF (mm) 284 12.65 ± 6.47** 319 13.99 ± 5.51** 522 13.53 ± 5.95 a 63 12.21 ± 6.54 a 14 12.7 ± 6.43 a SSF (mm) 284 9.53 ± 6.68** 319 11.13 ± 6.70** 522 10.42 ± 6.75 a 63 10.51 ± 7.22 a 14 8.92 ± 4.40 a BF (%) 1,368 21.22 ± 7.34** 1,457 22.34 ± 7.88** 2,380 22.03 ± 7.62 a 295 20.31 ± 7.90 b 35 21.72 ± 6.83 a SM (%) 1,368 32.56 ± 2.79** 1,457 31.41 ± 2.52** 2,380 31.84 ± 2.71 a 295 32.89 ± 2.63 b 35 31.36 ± 2.54 a RMR (Kcal/day) 1,368 1,237 ± 120.96** 1,457 1,185 ± 95.42** 2,380 1,209 ± 112.85 a 295 1,223 ± 103.29 b 35 1,185 ± 110.94 a ¥Age in days were converted in years for a better comparison between groups. *Distribution (mean ranks) and medians are the same between groups – Mann – Whitney (p > 0.05) and Mood ’s median test (p > 0.05). **Distributions are different between groups – Mann – Whitney (p < 0.05) and mean test (p < 0.05). Distribution (mean ranks) are different between groups with different letters: a, b [Mann – Whitney (p < 0.05)]. The test of significance adjustments was made using Dunn – Bonferroni correction. BF (body fat), BMI (body mass index), CC (calf circumference), HC (hip circumference), MUAC (mid upper arm circumference), RMR (resting metabolic rate), SM (skeletal muscle), SSF (subscapular skinfold thickness), TSF (triceps skinfold thickn ess), WC (waist circumference), WHR (waist – hip ratio) and WHtR (waist circumference-to-height-ratio ).
to the‘overfat/obese’ grade were correctly classified. This model presented a posterior probability of correct posi-tive and negaposi-tive test results of 87% (95% confidence in-terval [CI]: 83%–91%) and 96% (95% CI: 96%–97%), respectively. On the other hand, to accurately classify 97.9% of the children as belonging to the‘obese’ grade, only the BMI z-score, WC, WHR, weight and height pa-rameters were required (Table 2). These latter screening model results showed that 82% (95% CI: 73%–88%) of the children with a positive result were effectively into the‘obese’ grade and 99% (95% CI: 98%–99%) that pre-sented a negative result were not.
Finally, a %BF predictive model was developed and validated using simple anthropometric variables. In the
resulted set of bootstrap models zBMI, WHtR and WHtR_Q (importance: 0.114, 0.0842 and 0.0807, respec-tively) were globally the best predictors, with SSF and TSF (importance: 0.0516 and 0.0500, respectively) pre-senting a relatively smaller predictive power (Table S5). The %BF predictive models for both sexes and the step-wise cross-validation of the %BF predictive equations are shown in Table 3. The training and validation subsamples did not differ significantly in %BF and anthropometric measurements (Kruskal–Wallis, p > 0.05 for every param-eter; data not shown).
The results indicate that, for boys, BMI z-score, height, squared WHtR, age, weight, squared CC and squared HC are the variables that most contributed to the adjusted r2 positive alterations (Table 3). The final step predictive equation is, therefore: 22.589 + (3.776 × BMI z-score) (0.426 × height) + (12.038 × waist circumference-to-height-ratio_Q) + (0.001 × age) + (0.482 × weight) (0.043 × calf circumference_Q) + (2.229 × calf circumference) + (0.001 × hip circumference_Q); adjusted r2= 0.847, RMSE = 2.852.
For girls, the preferred model includes BMI z-score, waist circumference-to-height-ratio_Q, height, age, hip_Q and calf_Q circumferences (Table 4). The final step predictive equation is: 23.628 + (6.195 × BMI z-score) + (19.689 × waist circumference-to-height-ratio_-Q) (0.180 × height) + (0.004 × age) + (0.001 × hip circum-ference_Q) + (0.03 × calf circumference_Q); adjusted r2= 0.872, RMSE = 2.717.
The predictive parameters for the equations account for 84.7% and 87.2% of the %BF variance (adjusted r2) in the training sample set for boys and girls, respectively. Figure 4 shows the predicted and measured %BF values for boys and girls in the validation subsample using the predictive models showed in Table 4. In addition, this ta-ble compares cross-validation results obtained with our equation, with those from previously published predictive equations (10,11,13,24). In contrast to our equation, most of these previous equations have in common the use of skinfold thickness and none of their predictions fitted very well our data, with RMSE/RMSPE below 3%. Only ours and Slaughter’s equation (13) presented estimated mean values not significantly different from the measured % BF mean. However, our equation shows a better identity fit (adjusted r2= 0.947) with smaller prediction errors (RMSE = 1.989 and RMSPE = 2.915) than all tested previ-ous published equations.
Discussion
Our study demonstrates that, based on a relatively large sample of pre-pubertal children, predictive models for % Figure 2 Flowchart of child participation in the study according to
the anthropometric and BIA parameters that were selected. *Project population sample was used to characterize the nutritional status of the population.
Figure 3 Scatter plots between %BF and BMI z-score.
BF can be developed from anthropometric measure-ments excluding skinfold thickness.
The data shows that both zBMI (r = 0.935) and BMI (r = 0.902) have the strongest correlation with %BF, which Table 2 %BF obesity grade prediction models
%BF grade
Accuracy (%)* Accuracy (%)*; Specificity (%)*; Sensitivity (%)*
Neural networks (n = 2,202)
Multinomial logistic regression (n = 2,759)
Binomial logistic regression (overfat/obese) (n = 2,216)
Binomial logistic regression (obese) (n = 2,216) Underfat 18.8 43.1 — — Normal 98.0 97.7 — — Overfat 56.7 58.7 95.1; 98.0; 78.6 — Obese 74.2 73.2 97.9; 99.2; 71.0 Global 91.3 91.4 — — Selected variable 1, 2, 3, 4, 5, 6, 7, 8, 9 1, 3, 6, 7, 10, 11 1, 2, 3, 6, 8, 12 1, 2, 3, 6, 8
Selected variables: (1) weight, (2) height (cm), (3) BMI z-score, (4) hip circumference (cm), (5) calf circumference (cm), (6) waist circumference-to-height-ratio, (7) age (in days), (8) waist circumference (cm), (9) mid upper arm circumference (cm), (10) squared BMI z-score and (11) squared waist circumference-to-height-ratio, 12 (sex).
*Shown results are related to the performance of each model in the validation sample set. BMI (body mass index).
Table 3 Stepwise cross-validation of %BF predictive equation from anthropometric measurements with measured versus predicted data
Stepwise model predictors
Training set Validation set
Adjusted r2 RMSE (%) Adjusted r2 RMSPE (%) Boys (n = 759 in the training set and 301 in validation
subsample)
BMI z-score 0.807 3.209 0.762 3.612
BMI z-score, height 0.828 3.033 0.806 3.248
BMI z-score, height, waist circumference-to-height-ratio_Q
0.837 2.947 0.817 3.162
BMI z-score, height, waist circumference-to-height-ratio_Q, age
0.840 2.918 0.821 3.134
BMI z-score, height, waist circumference-to-height-ratio_Q, age, weight
0.842 2.907 0.823 3.120
BMI z-score, height, waist circumference-to-height-ratio_Q, age, weight, calf circumference_Q
0.844 2.886 0.823 3.121
BMI z-score, height, waist circumference-to-height-ratio_Q, age, weight, calf_Q and calf circumferences
0.846 2.870 0.823 3.117
BMI z-score, height, waist circumference-to-height-ratio_Q, age, weight, calf_Q, calf and hip_Q circumferences
0.847 2.852 0.823 3.110
Girls (n = 778 in the training set and 363 in validation subsample)
BMI z-score 0.831 3.117 0.832 3.226
BMI z-score, waist circumference-to-height-ratio_Q 0.852 2.915 0.856 2.996 BMI z-score, waist circumference-to-height-ratio_Q,
height
0.860 2.832 0.861 2.929
BMI z-score, waist circumference-to-height-ratio_Q, height, age
0.869 2.747 0.865 2.902
BMI z-score, waist circumference-to-height-ratio_Q, height, age, hip circumference_Q
0.870 2.731 0.868 2.868
BMI z-score, waist circumference-to-height-ratio_Q, height, age, Hip_Q and calf_Q circumferences
0.872 2.717 0.869 2.867
r (correlation coefficient), RMSE (root mean square error), RMSPE (root mean square prediction error), _Q (squared variable). Candidate predic-tors included age (in days), BMI z-score [body mass index (kg/m2)], height (in cm), calf and hip waist circumferences (in cm), waist circumfer-ence-to-height-ratio and weight (in kg).
is consistent with Pecoraro et al. (25) (r = 0.92 for BMI); however, Boeke et al. (26) (r = 0.81 for BMI and zBMI) and Gutin et al. (r = 0.82 for BMI) (27) presented lower cor-relation results. This may be because of the fact that these authors have studied small sample sizes or be-cause they used bipolar impedance (28).
Recent studies have also tried to determine which measure– WC, HC, WHC or WHtR – is better suited for the diagnosis of overfatness; however, until now, there has been no general agreement (14,29–31). The study here reported shows that all these variables, with the exception of WHR, are strongly correlated with %BF, with WHtR presenting the highest correlation. Watts et al. (15) found strong correlations between DEXA total body fat and BMI (r = 0.86), WC (r = 0.81) and HC (r = 0.88). Bigorna et al. (32) showed that BMI and WC had a high correlation and similar accuracies as predictors of adiposity. However, Aeberli et al. showed that WC performed slightly better than BMI in predicting %BF (29). On the
contrary, to Brambilla et al. (30), WHtR is a better predic-tor of adiposity than WC or BMI.
One of the main results of our study, to the best of our knowledge, is the first validated body fat grade predictor model that can be used as a screening tool for obesity.
Both, NNs and multinomial logistic regression models, were shown to be very strong obesity grade predictors (global accuracy≥ 91.3%). However, the later model showed 2.29 times more sensitivity in classifying children in the‘underfat’ grade (presenting similar accuracy in the other grade categories) and has the advantage of only requiring weight, height, WC and age. In contrast, NNs require the same parameters, plus CC, HC and MUAC.
Binomial logistic regression indices have also demonstrated a very good global accuracy, with a high specificity and sensitivity. To classify children into the ‘overfat/obese’ grade, or exclusively into the ‘obese’ grade, only three direct measurements are needed: weight, height and WC. The obese screening model also requires sex as a parameter.
Another major contribution of this work is the develop-ment of a cross-validated %BF predictive equation that, to the best of our knowledge, is the first developed in children that includes zBMI and CC as predictors and excludes the use of skinfold thickness. There are advantages in this exclusion because skinfold thickness has several problems: (i) it has higher errors at higher levels of adiposity (14,15); (ii) it lacks high-quality calibrated calipers (15); (iii) it requires highly trained anthropometrists (15); and (iiii) as demonstrated by our study, it has relatively small %BF predictive power. Furthermore, the results of this study suggest the need of sex-specific equations only requiring, for both sexes, small and simple anthropometric measure-ments (height, weight, WC, HC and CC), as well as age (in days).
Table 4 Comparison of current study model and previously pub-lished equations performances to predict %BF
(n = 603) Predicted %BF Adjusted r2 RMSE (%) RMSPE (%) Current model§ 21.588 ± 7.326 0.947 1.765 2.915 Goran et al. (10) 20.430 ± 5.219¥ 0.675 4.358 5.427 Dezenberg et al. (11) 25.559 ± 5.865¥ 0.592 4.875 6.673 Slaughter et al. (13) 21.027 ± 8.680 0.704 4.156 5.406 Marrodán et al. (24) 24.235 ± 6.098¥ 0.634 4.625 5.744
§This predicted versus measured regression was built using the same
sample (n = 603) that was used for the previously published equa-tions cross-validation. r (measured versus estimated %BF identity regression Spearman coefficient correlation), RMSE (root mean square error), RMSPE (root mean square prediction error), SD (stan-dard deviation),¥significantly different from measured %BF mean (21.370 ± 7.642).
Figure 4 Scatter plot between %BF measured by BIA and validation set predicted %BF [A, male model (cross-validation n = 301); B, female model (cross-validation n = 363)]. Dotted line shows the identity regression (Y = X).
The equations developed by Slaughter et al. (13), Goran et al. (10), Dezenberg et al. (11) and Marrodán et al. (24) were also applied in the present study. This last equation was selected because of being exclusively based on WHtR. However, the predictor’s choice was based on previous studies’ findings, which have no general consensus between authors, and was not cross-validated.
The results of this study also show that ours and Slaughter’s equations (13) have both a significant agree-ment between predicted and measured %BF. The remaining equations underestimate or overestimate %BF (Table 4). Furthermore, our equation presented a higher fitness than Slaughter’s, as demonstrated by the better respective adjusted r2, RMSE and RMSPE, when applied to the cross-validation sample subset.
Several other studies have also explored the validation of these equations in their own populations. Hussain et al. (33) in 99 Pakistani children (9–19 years old) concluded that Slaughter’s equation (13) presented a reasonable correlation with DXA measured %BF, while Goran’s (10) and Dezenberg’s (11) equations underestimate and over-estimate, respectively, %BF. L’Abbée et al. (34) also reported an overestimation of %BF in a sample of 30 Dutch children (6–7 years old) by the Dezenberg equation (11) compared to the isotope dilution technique. How-ever, for Nasredinne et al. (12), these three predictive equations underestimated %BF in pre-pubertal Lebanese children. Huang et al. (35) also indicated that the Dezenberg predictive equation (11) is not appropriate in predicting total body fat in Latin children.
Differences in lifestyles, cultural background and envi-ronmental living conditions between populations may be the reason for the above described poor fitness of prior developed models to different populations. Although our models were cross-validated (which is not the case in the others), for the same reasons, it may also result in its sub-optimal generalization. Therefore, they will also need to be validated in other populations before extrapo-lations are warranted.
In conclusion, %BF can be graded and predicted with reasonable accuracy, in children with characteristics sim-ilar to the ones from our sample, from anthropometric measurements even excluding skinfold thickness. Fitness and cross-validation results showed that our multivariable regression models performed better in this population than did previously published models.
Acknowledgements
The authors thank the children, parents and teachers at the participating schools, Susana Adam for skinfold thick-ness measurements, João Vintém and Solange Campos
for managing the program and Júlio Guilherme and Hélder Carrilho for their computer work.
Funded by the Directorate General of Health– Ministry of Health and, in part, by Egas Moniz Higher Education Cooperative (Martins dos Santos). An informatics plat-form was funded by Rui Nabeiro (Nabeiro Group).
Disclosure
The authors declared no conflict of interest.
Author contributions
SA, JMF and FF designed the study; SA, FPF, MEF and LRS conducted anthropometric and BIA measurements; PM performed statistical analysis; SA and JMF wrote the manuscript under the guidance of FPF; JCF, MM and MV critical reviewed the preliminary draft of this man-uscript. All authors read and approved the final manuscript.
References
1. Franca F, Nikogosian H, Lobstein T. The challenge of obesity in the WHO European region and the strategies for response. WHO Re-gional Office of Europe 2007; 1–76.
2. Juonala M, Magnussen CG, Berenson GS, et al. Childhood adi-posity, adult adiadi-posity, and cardiovascular risk factors. N Engl J Med 2011; 365: 1876–1885.
3. Skinner AC, Perrin EM, Moss LA, Skelton JA. Cardiometabolic risks and severity of obesity in children and young adults. N Engl J Med 2015; 373: 1307–1317.
4. Eto C, Komiya S, Nakao T, Kikkawa K. Validity of the body mass index and fat mass index as an indicator of obesity in children aged 3–5 year. J Physiol Anthropol Appl Human Sci 2004; 23: 25–30. 5. Gómes-Ambrosi J, Silva C, Galofré JC, et al. Body mass index
classification misses subjects with increased cardiometabolic risk factors related to elevated adiposity. Int J Obes 2012; 36: 286–294. 6. De Onis M. The use of anthropometry in the prevention of childhood
overweight and obesity. Int J Obes 2004; 28(Suppl3): S81–S85. 7. Must A, Anderson SE. Body mass index in children and
adoles-cents: considerations for population-based applications. Int J Obes (Lond) 2006; 30: 590–594.
8. Goran MI. Measurement issues related to studies of childhood obesity: assessment of body composition, body fat distribution, physical activity, and food intake. Pediatrics 1998; 101(3 Pt 2): 505–518.
9. Bray GA, DeLany JP, Harsha DW, Volaufova J, Champagne CC. Evaluation of body fat in fatter and leaner 10-y-old African American and white children: the Baton Rouge children’s study. Am J Clin Nutr 2001; 73: 687–702.
10. Goran MI, Driscoll P, Johnson R, Nagy TR, Hunter G. Cross-cali-bration of body-composition techniques against dual-energy X-ray absorptiometry in young children. Am J Clin Nutr 1996; 63: 299–305.
11. Dezenberg CV, Nagy TR, Gower BA, Johnson R, Goran MI. Predicting body composition from anthropometry in pre-adolescent children. Int J Obes Relat Metab Disord 1999; 23: 253–259.
12. Nasredinne L, Naja F, Hills AP, Youssef SK, Chahine J, Hwalla N. Validity of predictive equations developed to estimate body fat from anthropometry and bioelectrical impedance analysis in 8–10 year-old children. Clin Nutr 2012; 31: 364–371.
13. Slaughter MH, Lohman TG, Boileau RA, et al. Skinfold equations for estimation of body fatness in children and youth. Hum Biol an Int Rec Res 1988; 60: 709–723.
14. Mei Z, Grummer-Strawn LM, Wang J, Thornton JC, Freedman DS, Pierson RN Jr, Dietz WH, Horlick M. (n.d)Do skinfold measurements provide additional information to body mass index in the assess-ment of body fatness among children and adolescents? Pediatrics 2007; 119: e1306–e1313
15. Watts K, Naylor LH, Davis EA, et al. Do skinfolds accurately assess changes in body fat in obese children and adolescents? Med Sci Sports Exerc 2006; 38: 439–444.
16. Cole TJ, Flegal KM, Nicholls D, Jackson A. Body mass index cut offs to define thinness in children and adolescents: international survey. BMJ 2007; 335: 166–167.
17. Cole TJ, Bellizzi MC, Flegal KM, Dietz WH. Establishing a standard definition for child overweight and obesity worldwide: International Survey. BMJ 2000; 320: 1240.
18. McCarthy HD, Cole TJ, Fry T, Jebb SA, Prentice AM. Body fat ref-erence curves for children. Int J Obes (Lond) 2006; 30: 598–602. 19. Abraham S, Collins G, Nordsieck M. Relationship of childhood weight
status to morbidity in adults. HSMHA Health Rep 1971; 86: 273–284. 20. Sampé M, Pedron G, Roy-Pernot MP. Auxologie, Méthode et
Sé-quences. Theraplix, 1979.
21. Cole TJ. The LMS method for constructing normalized growth standards. Eur J Clin Nutr 1990; 44: 45–60.
22. McCarthy HD, Jarrett KV, Crawley HF. The development of waist circumference percentiles in British children aged 5.0– 16.9 y. Eur J Clin Nutr 2001; 55: 902–907.
23. Oshima Y, Shiga T, Namba H, Kuno S. Estimation of whole-body skeletal muscle mass by bioelectrical impedance analysis in the standing position. Obes Res Clin Pract 2010; 4: e1–e82. 24. Marrodán M, Alvarez JRM, de Espinosa MG-M, et al. Predicting
percentage body fat through waist-to-height ratio (WtHR) in Span-ish schoolchildren. Public Health Nutr 2014; 17: 870–876. 25. Pecoraro P, Guida B, Caroli M, et al. Body mass index and skinfold
thickness versus bioimpedance analysis: fat mass prediction in children. Acta Diabetol 2003; 40(Suppl1): S278–S281.
26. Boeke CE, Oken E, Kleinman KP, Rifas-Shiman SL, Taveras EM, Gillman MW. Correlations among adiposity measures in school-aged children. BMC Pediatr 2013; 13: 99.
27. Gutin B, Litaker M, Islam S, Manos T, Smith C, Trieber F. Body-composition measurement in 9–11-y-old children by dual-energy X-ray absorptiometry, skinfold thickness measurement and bioimpedance analysis. Am J Clin Nutr 1996; 63: 287–92.
28. Dittmar M. Comparison of bipolar and tetrapolar impedance techniques for assessing fat mass. Am J Hum Biol 2004; 16: 593–597.
29. Aeberli I, Gut-Knabenhans M, Kusche-Ammann RS, Molinari L, Zimmermann MB. A composite score combining waist circumfer-ence and body mass index more accurately predicts body fat percentage in 6- to 13-year-old children. Eur J Nutr 2013; 52: 247–253.
30. Brambilla P, Bedogni G, Heo M, Pietrobelli A. Waist circumference-to-height ratio predicts adiposity better than body mass index in children and adolescents. Int J Obes (Lond) 2013; 37: 943–946.
31. Cameron N, Jones LL, Griffiths PL, Norris SA, Pettifor JM. How well do waist circumference and body mass index reflect body compo-sition in pre-pubertal children ? Eur J Clin Nutr 2009; 63: 1065–1070.
32. Bigornia SJ, LaValley MP, Benfield LL, Ness AR, Newby PK. Rela-tionships between direct and indirect measures of central and total adiposity in children: what are we measuring? Obesity 2013; 21: 2055–2062.
33. Hussain Z, Jafar T, Zaman MU, Parveen R, Saeed F. Correlations of skinfold thickness and validation of prediction equations using DEXA as the gold standard for estimation of body fat composition in Pakistani children. BMJ 2014; 4 e004194.
34. L’Abée C, Visser GH, Liem ET, Kok DE, Sauer PJ, Stolk RP. Com-parison of methods to assess body fat in non-obese six to seven-year-old children. Clin Nutr 2010; 29: 317–22.
35. Huang TT-K, Watkins MP, Goran MI. Predicting total body fat from anthropometry in Latino children. Obes Res 2003; 11: 1192–1199.
Supporting Information
Supplementary Table 1. Anthropometric characteristics and sex distribution of the project population (n = 5,514). Supplementary Table 2. Physical characteristics distrib-uted by adiposity grades.
Supplementary Table 3. Anthropometric correlations with obesity indices.
Supplementary Table 4. Anthropometric fitting models of %BF.
Supplementary Table 5. Importance of predictors for %BF.
Supplementary Figure 1. Scatter plots correlating %BF and anthropometric parameters
![Figure 4 Scatter plot between %BF measured by BIA and validation set predicted %BF [A, male model (cross-validation n = 301); B, female model (cross-validation n = 363)]](https://thumb-eu.123doks.com/thumbv2/123dok_br/14995396.1009148/8.892.175.746.777.1007/figure-scatter-measured-validation-predicted-validation-female-validation.webp)
