FISH LARVAE AND ZOOPLANKTON BIOMASS AROUND FAIAL ISLAND
(AZORES ARCHIPELAGO). A PRELIMINARY STUDY OF SPECIES
OCCURRENCE AND RELATIVE ABUNDANCE
LUIS SOBRINHO-GONÇALVES & EDUARDO ISIDRO
SOBRINHO-GONÇALVES, L. & E. ISISDRO 2001. Fish larvae and zooplankton biomass around Faial Island (Azores archipelago). A preliminary study of species occurrence and relative abundance. Arquipélago. Life and Marine Sciences 18A: 35-52. Ponta Delagada. ISSN 0873-4704.
Plankton hauls were conducted off Faial island (Azores archipelago, NE Atlantic), to a depth of 100 m, between February and June 1998, covering the spawning period of a number of commercially important fish species. Seventy-three fish larvae taxa were identified, of which 51 were quantified, one of them a new record for the region, Glossanodon leioglossus (Valenciennes, 1848). The fish larvae community was dominated by mesopelagic and bathypelagic elements (namely Myctophidae and Gonostomatidae), a typical oceanic island environment composition. Total zooplankton showed a biomass peak in May that could correspond to the Spring “bloom”. However, the fish larvae showed an abundance minimum in May and a maximum in June, presenting a general negative relationship with zooplankton biomass and indicating a temporal asynchrony between their annual cycles of production. The comparison of fish larvae abundance with those of other NE Atlantic regions suggests that the zooplankton production in the Azores may be similar to the one found in the Iberian Peninsula continental shelf. Significant spatial density gradients (for fish larvae and zooplankton) were not found with either bathymetry or distance from shore.
Luis Sobrinho-Gonçalves (e-mail: andresg@notes.horta.uac.pt) & Eduardo Isidro, Departamento de Oceanografia e Pescas, Universidade dos Açores, Cais de Santa Cruz, PT-9901-862 Horta, Açores.
INTRODUCTION
Studies of fish larvae are important for numerous marine biology areas, particularly for biogeography and fisheries studies. As fish larvae live in a highly dynamic biological environment being a very small part of a system dominated by a great diversity of predators and competitors (MCGOWAN & MILLER 1980), to properly investigate this group’s ecology it is important to know the composition, abundance and distribution of the whole zooplanktonic community. Moreover, the reciprocal relations between zooplankton and ichthyoplankton have enormous importance being able to impact stock size regulation for innumerable fish species (RODRÍGUEZ &RUBÍN 1991). However, the study of events in plankton ecology has always been
very difficult due to the highly variable (moving) nature of the system (RÉ 1984a).
In the Azores Region, only two studies involving fish larvae have been published: a study of the Abudefduf luridus by RÉ (1980) and a preliminary incomplete ichthyoplankton characterization by CHÍCHARO & TEODÓSIO
(1990).
The following main objectives were defined for the present study: characterize the seasonal and spatial distribution (investigating the eventual occurrence of density gradients with the coastal distance and bathymetry) of the zooplankton and fish larvae communities; study the relation between these two groups and to identify the maximum number of larvae species possible in the vicinity of an island in a period of known spawning and larvae development.
MATERIAL AND METHODS
Sampling strategy
Plankton sampling was conducted by pelagic tows at night at five fixed stations off the southern coast of Faial island, Azores archipelago (NE Atlantic), on board R/Y ÁGUAS VIVAS (see study area in Fig. 1). The tows were made monthly between February and June 1998 (with the exception of April) with a Bongo net of 60 cm mouth diameter with two different mesh sizes,
335µm and 500µm. Each month, all stations were sampled during one night. The tows were made with a double oblique design until a maximum depth of 100 m using standard methodology (SMITH & RICHARDSON 1977; OMORI & IKEDA
1984), during approximately 30 min., at a velocity between 1.5 and 3 knots. Net monitoring and instant depth control was carried out with the angle method (SMITH & RICHARDSON 1977). Towing depth profiles were verified with a mini datalogger attached to the net (Vemco´s TDR). The total volume of filtered water was measured with two flowmeters (G.O. ref. 2030R).
Fig. 1. Sampling stations in the study area – Faial Island, Azores archipelago, NE Atlantic. Terminology
Ichthyoplankton is composed by the eggs and larval stages of bony fishes (Osteichthyes). In this study we considered only the larvae (FL), following the terminology adopted by MOSER et al. (1984) and RÉ (1984a) who considered all stages between egg eclosion and transformation (that coincides with the end of the planktonic phase).
For zooplankton we considered two subgroups:
a) Partial zooplankton (PZ), formed by the organisms with individual volumes less than 5 ml that includes the mesozooplankton division (SIEBURTH et al. 1978), mainly composed of crustaceans, chaetognaths, molluscs and siphonophores.
b) Megaloplankton (MZ) formed by organisms with individual volume greater than 5 ml that includes the macrozooplankton and
megazooplankton divisions (SIEBURTH et al. 1978), mainly composed of larger specimens of medusae, tunicates, ctenophores and siphonophores.
These last two groups together were termed total zooplankton (TZ).
Sample treatment and data analysis
The zooplankton samples were initially fixed in formalin 5% (salt water) neutralized with borax (PH=8-8.5) and later preserved in ethanol 70% (fresh water) using standard methodology (SMITH
& RICHARDSON 1977; OMORI & IKEDA 1984). The biomass of PZ and MZ were estimated by measuring the displaced volume of the filtered samples (AHLSTROM & THRAILKILL 1962 in CIECHOMSKI &SANCHEZ 1983). The fish larvae were sorted without any sub sampling.
The FL abundance is expressed in number of larvae/100m3 (of filtered water) and zooplankton biomass in ml/100m3. As the maximum depth for all the tows was similar (100 m), the results of abundance and biomass can be equally read as per m2, which is useful for comparison with results from other studies.
Because the number of samples was low (19) and because the data of FL abundance, PZ and TZ biomass did not follow a Normal distribution – see Appendix 1, the statistical analysis was performed using non-parametric methods.
To compare the samples between the two mesh sizes of the Bongo net we used the Wilcoxon´s signed rank test (SIEGEL 1956; CAMPBELL 1974). The Spearman´s correlation coefficient (SIEGEL 1956; ZAR 1996) was used to test for the relations between biotic variables (PZ, MZ, FL) and the bathymetry and distance from the coast. The bathymetric values used were the average bottom depth for the area covered by each station.
We did not analyze the FL data through diversity indices because of the high proportions of unidentified larvae.
RESULTS
a. Quantitative differences between mesh sizes
Of a total of 3925 ml of partial zooplankton biomass quantified during the sampling period, 2072 ml were collected with the 335 µm mesh size while 1853 ml were collected with the 500 µm; the data relative to the volume of filtered water (ml/100m3) reveals a proportion of 1.19:1 between the harvests of the two mesh sizes.
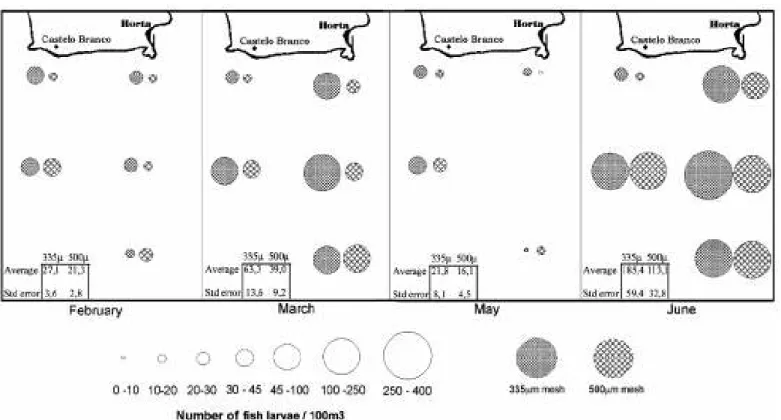
Of a total of 12816 fish larvae counted, 7441 were captured with the 335 µm mesh, while 5375 were collected with the 500 µm; the data relative to the volume of filtered water (number of larvae/100m3) reveals a proportion of 1.51:1 between the catches of the two mesh sizes.
Figures 2 and 3 present the biomass of PZ and MZ as well as the FL abundance by station and month and suggest that there are persistent differences in the catchability of the nets. The results of the Wilcoxon’s matched pairs test applied to the complete data set are given in Table 1 and confirm these graphical indications. The 335µm net captured greater biomass of PZ and higher numbers of FL, but the harvests of MZ were similar for both mesh sizes. Based on this result and following GRIOCHE &KOUBBI (1997), the data of PZ, TZ and FL will be presented separately (by mesh size) and the MZ presented in average.
Table 1
Wilcoxon’s test results for the differences of partial zooplankton biomass, of megaloplankton biomass and of fish larvae community abundance, between the two
mesh sizes. The complete set of data was used. PZ T =29, p =0.008, n =19 MZ T =6, p =0.093, n =9
FL T =10, p =0.001, n =19
Note: The test for the megaloplankton was only conducted in the months with sufficient captures.
b. Monthly distribution
There was a clear peak of PZ biomass in May and a MZ distribution "window" almost restricted to this month (Fig. 2). A great increase of FL abundance is evident in June (Fig. 3) after some lower fluctuations in the first months. To compare these FL abundance results we refer to other Northeast Atlantic studies (Table 2).
c. Spatial distribution, relation with coastal distance and bathymetry
Usually, the bottom depths increase when the distance from the coast increases, thus are generally used as a single variable (POWLES et al. 1984). However, this is not true in our case
because the bottom depth of station 2.3 is shallower than at stations 2.2 and 3.2 (Fig. 1). In this scenario, we investigated the correlation between each of these two variables and the FL and PZ, for each mesh size data set. The obtained Pearson´s correlation coefficients are given in Table 3.
Regarding PZ, the results indicated a trend for weak positive correlations (statistically significant for the 335 µm mesh size, but not significant for the 500 µm) with both the environmental parameters. The results for FL indicated a trend for a weak positive correlation (though not statistically significant) with depth for the 335 µm mesh. On the other hand, for the 500 µm mesh size, there is significant positive correlation with coastal distance.
Table 2
Comparison of observed fish larvae maximum abundances with other works in the Northeast Atlantic using very similar methodologies.
Maximum
abundance Month
Sampling
period Study location Mesh size References 376.4
larvae/100m3 June
February to June, 1998
Faial island, Açores
archipelago 335µm Present study ⊕ 185.4
larvae/100m3 June
February to June, 1998
Faial island, Açores
archipelago 335µm Present study ⊕ 165
larvae/m2 September 1988 Canary archipelago, Spain 335µm
RODRIGUEZ et al.
1990
337.3 larvae/m2 April April, 1987 Galicia, Spain 335µm RODRÍGUEZ & RUBÍN 1991 ⊕ 46.8
larvae/100m3 April
1979 and
1980 Peniche, Portugal 505µm RÉ 1984a ⊕ 75
larvae/100m3 May
1981 and
1982 Sines, Portugal 505µm RÉ 1984a ⊕ 182.8
larvae/100m3 April 1981
Between cape Espichel and
cape Sardão, Portugal 505µm AFONSO 1989 ⊕ 320.7
larvae/100m3 March 1983
Between cape Espichel and
cape Sardão, Portugal 505µm AFONSO 1989 ⊕ - Average abundance for a set of sampling stations.
39
Fig. 2. Spatial distribution of partial zooplankton (PZ) and megaloplankton (MZ) biomass (ml/100m3) by month, for both mesh sizes. Note : The 2.2 May
sample was lost.
3
Fig. 3. Spatial distribution of fish larvae (FL) community abundance (nº/100m3) by month, for both mesh sizes. Note : The 2.2 May sample was lost.
4
Table 3
Spearman’s correlation coefficient (R) between partial zooplankton biomass / fish larvae abundance and coastal distance and water depth, for the complete data
set of each mesh size. 335µµµµm 500µµµµm Coastal distance Water depth Coastal distance Water depth PZ R =0.47, p =0.04, n =19 R =0.42, p =0.03, n =19 R =0.25, p =0.31, n =19 R =0.28, p =0.26, n =19 FL R =0.14, p =0.55, n =19 R =0.30, p =0.21, n =19 R =0.46, p <0.05, n =19 R =0.72, p =0.17, n =19 Note: The megaloplankton data were insufficient to be included in this analysis.
d. Relationship between the fish larvae community and the zooplankton (PZ and TZ) RODRÍGUEZ & RUBÍN (1991) admitted that the ideal condition to study eventual relations between these two communities is that both follow the same distribution model. This condition was valid in the present work (see Appendix 1). The differences between these two groups were clear between the various months and it was in this context that we analyzed this relationship. The simple observation of Fig. 4 indicates a general trend for a negative association between the FL and both PZ and TZ. The Spearman’s correlation analysis also indicates a negative correlation (weak and not statistically significant) between FL and PZ when all the data set is used (R= -0.18, n= 38, p= 0.27). However, it is obvious, comparing Fig. 2 and Fig. 3, that for the May-June sub-set this negative correlation is stronger. The Spearman’s correlation coefficients of FL vs PZ and of FL vs TZ applied to these months confirmed it, showing R= -0.44, p= 0.07 and R= -0.55, p=0.01 respectively, for n=18.
e. Fish larvae community characterization This work resulted in 73 identified taxa belonging to 29 families. Of these taxa, 59 were identified to genus or species. The identified taxa and corresponding abundances are listed in Tables 4 and 5. In Appendix 2 are listed the taxa that were identified but still not quantified because of
substantial doubts about their taxonomical identification. 0 200 400 600 800 1000 0 500 1000 1500 2000 No of fish larvae Z o o p la n k to n b io m a ss ( m l) PZ TZ
Fig. 4. Abundance of fish larvae (FL) community as a function of partial and total zooplankton (PZ and TZ) biomass.
To characterize the diversity of the fish larvae community we referred only to a specific richness estimation, the number of taxa – see Tables 4 and 5. The most abundant and/or important taxonomical components of the community are summarized in the Table 6 and Fig. 5. The FL samples were dominated, throughout the 5 months period, by only two Families, firstly Myctophids and secondly Gonostomatids. Although in small amounts, we found other ecological groups represented, for example: deep sea - Macrouridae and Cryptopsaras couesi; neritic / demersal - Conger conger and Phycis phycis; shallow waters - Synodus saurus and Bothus podas; epipelagic - Sardina pilchardus and Trachurus picturatus; migratory - Anguilla sp.
For our data, the dynamics of the two species of the genus Ceratoscopelus (mainly C. madeirensis) call for attention because of their tremendous abundance and dominance in June following relatively low values in the Winter/Spring months.
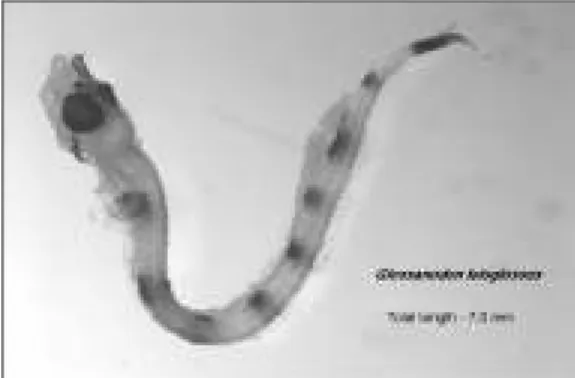
f. New record
During the identification of fish larvae a new record for the Azores fish fauna was encountered:
Glossanodon leioglossus (Valenciennes, 1848) synonym of Argentina leioglossa (Cuvier & Valenciennes, 1848), commonly known as small-toothed argentine (Fig. 6).
Table 4
Identified fish larvae with corresponding abundances (no of larvae/100m3) and proportions (%), for February and March and both mesh sizes. This list was organized by Families according to NELSON (1994). The genera and species are in alphabetical order and the scientific names were adopted from WHITEHEAD et al. (1989). Note: The taxa listed as A111, B3 and J5 were species with easily discernable individuals but not yet taxonomically identified.
* - taxa of commercial interest; ** - taxa of shallow waters.
February March
335µm 500µm 335µm 500µm
Taxa average no. of larvae/100m3
% of sample average no. of larvae/100m3 % of sample average no. of larvae/100m3 % of sample average no. of larvae/100m3 % of sample Anguillidae * ** Anguilla sp. Congridae * Conger conger 0.04 0.13 0.03 0.06 Gnathophis sp. Nettastomatidae Facciolella oxyrhyncha 0.03 0.06 Clupeidae * ** Sardina pilchardus 0.03 0.13 Argentinidae Argentina leioglossa 0.07 0.26 0.03 0.08 Bathylagidae unidentified 0.04 0.13 0.03 0.15 0.03 0.08 Gonostomatidae Cyclothone spp. 1.78 6.45 0.90 4.26 7.40 11.56 4.16 10.63 Ichthyococcus ovatus 0.03 0.06 0.06 0.17 Vinciguerria poweriae 0.07 0.11 0.06 0.17 Vinciguerria attenuata 0.53 0.85 0.48 1.25 Vinciguerria nimbaria 0.03 0.15 0.28 0.45 0.07 0.17 Vinciguerria spp. 0.40 0.62 0.45 1.16 Sternoptychidae Maurolicus muellerii 1.79 6.58 2.12 10.05 4.62 7.16 3.35 8.47 Sternoptyx sp. ? 0.04 0.13 0.03 0.15 Stomiidae Chauliodus spp. 0.10 0.39 0.06 0.30 0.53 0.85 0.78 1.99 Stomias spp. 0.11 0.17 0.06 0.17 Synodontidae * Synodus saurus Paralepididae unidentified 0.18 0.66 0.27 1.22 0.10 0.17 0.06 0.17 Myctophidae Ceratoscopelus madeirensis 0.10 0.17 0.03 0.08 Ceratoscopelus warmingii Ceratoscopelus spp. Diogenichthys atlanticus 0.04 0.13 0.06 0.30 1.57 2.54 0.74 1.91 Gonichthys coccoi 0.03 0.06 0.10 0.25 Lampanyctus pusillus 0.08 0.26 0.13 0.61 1.10 1.75 0.88 2.24 Loweina sp. Myctophum punctatum 1.91 7.11 1.13 5.33 4.92 7.84 2.90 7.48 Symbolophorus veranyi 0.20 0.79 0.13 0.61 0.11 0.17 0.03 0.08 unidentified 8.50 31.18 8.77 40.94 24.83 39.35 17.15 44.02 Macrouridae unidentified 0.26 0.92 0.13 0.61 0.85 1.35 0.55 1.41 Phycidae * Phycis phycis 0.35 1.32 0.26 1.22 0.07 0.11 0.13 0.33 Gadidae * Molva dipterygia 0.03 0.06 0.03 0.08 unidentified 0.76 2.89 0.43 1.98 0.07 0.11 Ceratiidae Cryptopsaras couesi 0.04 0.13 Macroramphosidae 4 Macroramphosus scolopax 2.61 9.61 1.45 6.85 0.03 0.06
Table 4 (cont.)
Identified fish larvae with corresponding abundances (no of larvae/100m3) and proportions (%), for February and March and both mesh sizes. This list was organized by Families according to NELSON (1994). The genera and species are in alphabetical order and the scientific names were adopted from WHITEHEAD et al. (1989). Note: The
taxa listed as A111, B3 and J5 were species with easily discernable individuals but not yet taxonomically identified. * - taxa of commercial interest; ** - taxa of shallow waters.
February March
335µm 500µm 335µm 500µm
Taxa average no. of larvae/100m3
% of sample average no. of larvae/100m3 % of sample average no. of larvae/100m3 % of sample average no. of larvae/100m3 % of sample Scorpaenidae * Helicolenus dactylopterus 1.39 4.87 1.06 5.02 2.50 4.00 2.23 5.73 unidentified 0.45 1.45 0.26 1.22 0.24 0.39 Serranidae * Serranus cabrilla Callanthiidae Callanthias ruber ? 0.89 3.03 0.67 3.04 0.57 0.90 0.65 1.66 Carangidae * ** Trachurus picturatus 0.25 0.39 0.23 0.58 * unidentified 0.03 0.06 Scaridae * ** Sparisoma cretense 0.03 0.15 Callionymidae ** Callionymus reticulatus Trichiuridae * Lepidopus caudatus 0.04 0.13 0.08 0.11 0.03 0.08 Tetragonuridae Tetragonurus cuvieri 0.04 0.06 Tetragonurus spp. 0.03 0.15 0.03 0.08 Bothidae
** Bothus podas madeirensis 0.06 0.30
Arnoglossus imperialis Arnoglossus sp. 0.03 0.15 A111 0.04 0.13 0.03 0.15 1.32 2.03 0.33 0.83 B3 0.88 3.29 1.00 4.72 0.10 0.17 0.06 0.17 J5 0.04 0.13 0.03 0.15 0.14 0.23 0.03 0.08 Undetermined 4.56 17.76 2.16 10.20 10.16 16.01 3.46 8.89 Number of taxa 26 26 34 30
Table 5
Identified fish larvae with corresponding abundances (no of larvae/100m3) and proportions (%), for May and June and both mesh sizes. This list was organized by Families according to NELSON (1994). The genera and species are in alphabetical order and the scientific names were adopted from WHITEHEAD et al. (1989). Note: The taxa listed as
A111, B3 and J5 were species with easily discernable individuals but not yet taxonomically identified. * - taxa of commercial interest; ** - taxa of shallow waters.
May June
335mm 500mm 335mm 500mm
Taxa average no. of larvae/100m3 % of sample average no. of larvae/100m3 % of sample average no. of larvae/100m3 % of sample average no. of larvae/100m3 % of sample Anguillidae * ** Anguilla sp. 0.04 0.02 Congridae * Conger conger 0.05 0.22 Gnathophis sp. 0.05 0.22 0.04 0.02 Nettastomatidae Facciolella oxyrhyncha Clupeidae * ** Sardina pilchardus Argentinidae Argentina leioglossa Bathylagidae unidentified 0.04 0.03 Gonostomatidae Cyclothone spp. 2.19 10.11 1.72 10.58 13.59 7.25 7.29 6.46 Ichthyococcus ovatus 0.10 0.44 0.09 0.56 0.11 0.10 Vinciguerria poweriae 0.10 0.44 0.09 0.56 0.04 0.02 0.15 0.13 Vinciguerria attenuata 1.33 5.93 1.33 8.08 2.61 1.42 2.83 2.51 Vinciguerria nimbaria 0.24 1.10 0.23 1.39 0.77 0.43 0.34 0.30 Vinciguerria spp. 2.19 10.33 0.32 1.95 3.15 1.74 2.08 1.84 Sternoptychidae Maurolicus muellerii 0.14 0.66 0.26 1.67 Sternoptyx sp. ? 0.05 0.02 Stomiidae Chauliodus spp. 0.32 1.54 0.08 0.56 0.08 0.07 Stomias spp. 0.04 0.28 0.04 0.03 Synodontidae * Synodus saurus 0.78 0.41 0.20 0.17 Paralepididae unidentified 0.06 0.22 0.05 0.28 0.57 0.29 0.30 0.27 Myctophidae Ceratoscopelus madeirensis 1.43 6.59 0.18 1.11 55.41 29.67 42.08 36.97 Ceratoscopelus warmingii 0.05 0.22 6.44 3.48 2.87 2.55 Ceratoscopelus spp. 0.49 2.20 38.59 20.46 15.29 13.43 Diogenichthys atlanticus 3.15 8.35 1.12 6.96 1.22 0.68 1.02 0.94 Gonichthys coccoi 0.23 1.10 0.23 1.39 0.25 0.14 0.26 0.23 Lampanyctus pusillus 0.31 1.32 0.50 3.06 0.92 0.52 1.44 1.31 Loweina sp. 0.29 1.32 0.04 0.28 0.09 0.05 0.12 0.10 Myctophum punctatum 2.15 9.89 1.54 9.47 3.04 1.74 3.18 2.88 Symbolophorus veranyi 0.05 0.22 0.22 1.39 0.53 0.29 0.53 0.47 unidentified 2.31 10.33 4.49 27.86 10.58 5.65 11.47 10.25 Macrouridae unidentified 0.04 0.02 0.04 0.03 Phycidae * Phycis phycis Gadidae * Molva dipterygia unidentified
Table 5 (cont.)
Identified fish larvae with corresponding abundances (no of larvae/100m3) and proportions (%), for May and June and both mesh sizes. This list was organized by Families according to NELSON (1994). The genera and species are in alphabetical order and the scientific names were adopted from WHITEHEAD et al. (1989). Note: The taxa listed as
A111, B3 and J5 were species with easily discernable individuals but not yet taxonomically identified. * - taxa of commercial interest; ** - taxa of shallow waters.
May June
335mm 500mm 335mm 500mm
Taxa average no. of larvae/100m3
% of sample average no. of larvae/100m3 % of sample average no. of larvae/100m3 % of sample average no. of larvae/100m3 % of sample Ceratiidae Cryptopsaras couesi Macroramphosidae Macroramphosus scolopax Scorpaenidae * Helicolenus dactylopterus 0.10 0.56 unidentified 0.08 0.44 0.21 1.39 0.30 0.16 0.04 0.03 Serranidae * Serranus cabrilla 1.39 0.72 0.84 0.74 Callanthiidae Callanthias ruber ? 0.05 0.22 Carangidae * ** Trachurus picturatus 0.04 0.03 * unidentified Scaridae * ** Sparisoma cretense 0.04 0.02 Callionymidae ** Callionymus reticulatus 0.26 0.14 0.77 0.67 Trichiuridae * Lepidopus caudatus Tetragonuridae Tetragonurus cuvieri 0.05 0.22 0.05 0.28 Tetragonurus spp. 0.08 0.05 0.07 0.07 Bothidae
** Bothus podas madeirensis
Arnoglossus imperialis 0.04 0.02 Arnoglossus sp. 0.35 0.20 0.19 0.17 A111 B3 J5 Undetermined 5.68 26.37 3.10 19.50 44.18 24.37 19.39 17.21 Number of taxa 24 21 28 28
Table 6
Proportion (%) of three groups of interest in the fish larvae community abundance, for both mesh sizes.
February March May June
335µm 500µm 335µm 500µm 335µm 500µm 335µm 500µm Myctophidae and Gonostomatidae 68.7 76.1 78.1 86.5 72.5 77.7 73.9 80.4 Taxa “island dependant” * 10.9 11.3 6.1 8.5 1.3 2.2 1.7 1.9 Taxa with commercial interest 6.6 6.2 4.8 6.8 0.2 0.6 0.7 0.8 * - Neritic, demersal and shallow-water elements.
Fig. 5. Average proportion (in descending order) of the most abundant taxa of the fish larvae community, for each month and for both mesh sizes.
Fig. 6. Glossanodon leioglossus larva captured in February at station 3.2, 335µm mesh size (photo: Sobrinho-Gonçalves).
DISCUSSION
The short time data series and the limitations in the spatial scale and number of stations impose a preliminary and indicative character to the obtained results.
a. Quantitative differences between mesh sizes The higher harvests obtained with the 335µm mesh size (compared to the 500µm) were naturally associated with its lower rate of small organism extrusion and escapement. The results allow us to state that, for this study area, mesozooplankton and larval fish surveys should preferably use a 335µm mesh (compared with a wider one) as it collects more material with higher diversity without severe net clogging problems.
b. Monthly distribution
The most striking biomass/abundance variation pattern was clearly the monthly one. From the results it is reasonable to consider that the zooplankton biomass peak found in May corresponded to the spring “bloom” of that year, typical of temperate seas, following the thermal stratification of the water column, which is expected to occur in the Azores in April/May (ISIDRO 1996).
As stated previously, there are no available studies of the FL community of the Azores with
which we could compare our results; therefore we considered studies from other regions. The FL abundances showed in the present study are similar and higher than some values found in the Canary Islands (also a Macaronesian archipelago with ichthyologic affinities to the Azores) (SANTOS et al. 1997) and were not inferior to values found in the Iberian Peninsula continental shelf (European zone, biogeographically close to the Azores) (SANTOS et al. 1995). These results are surprising because, according to the classic biological oceanography concepts, we expected to find much lower FL abundances in the typical oceanic environment of Azores than in a corresponding continental shelf that is theoretically more productive.
c. Spatial distribution, relation with coastal distance and bathymetry
Coastal distance and bathymetry are considered important factors for the distribution and structure of any zooplanktonic community, being generally accepted as good describers of larval fish associations (BOEHLERT &MUNDY 1993; DOYLE
et al. 1993). Nevertheless, our results did not reveal the expected clear spatial density gradients with these two factors. The trends observed for both the PZ and FL are difficult to interpret with the amount of data provided by this study. Hydrographical studies of this region are mandatory.
Regarding the PZ, a significant part of the spatial variation of the biomass was associated simultaneously (in a complex way) with the variations of both environmental factors. In general terms, if we disregard the May data, this community showed higher densities at the most distant stations from the coast (5 and 10 nautical miles) with greater depths.
Regarding the FL, the variation of the abundance with the bathymetry seems to be relatively independent of the distance from the coast. In general terms, the results suggest that this community has higher densities at the stations with greater depths (5 nautical miles offshore). This is probably related to the dominance of mesopelagic and bathypelagic taxa in the samples.
d. Relationship between the fish larvae community and the zooplankton (PZ and TZ) Limited food availability and predation are normally considered as the main factors responsible for ichthyoplanktonic mortality. In this scenario, several authors consider it likely that negative relationships occur between the fish larvae abundance and the zooplankton biomass when the latter community reaches high densities, thus magnifying drastically the pressure of competition and predation (ALVARIÑO 1980; MCGOWAN & MILLER 1980; ALI KHAN & HEMPEL 1974).
In this study, we also found a general trend for a negative relations between the two communities that was, in graphical terms (Fig. 4), very similar to that reported by ALI KAN &HEMPEL (1974) and AFONSO (1989), in diverse environments. This result cannot be generalized for zooplankton as a whole because our methodology ignored an important component of the community, the microzooplankton, that escaped our nets and which include the majority of the fish larvae prey (e.g. eggs and larval stages of crustaceans). Furthermore, ALVARIÑO (1980) found a general negative relationship between fish larvae abundance and medusae, ctenophores, siphonophores and chondrophores. MILLS (1995) stressed the importance of these same groups as predators in oceanic environments. In this context, we can speculate that the high megaloplankton (MZ) biomass was the main cause for the minimum of FL occurring in our May samples. Regarding the May-June sub-set, we can also speculate about the occurrence, in Azorean waters, of a temporal asynchrony between the maximum abundance/ biomass of the annual cycles of each of these two groups. In order to clarify this last question, it will be necessary to develop this study, especially in terms of the ecologic and specific characterization of the whole macrozooplankton community. e. Fish larvae community characterization The higher specific richness (number of taxa) found in the March and May 335µm mesh samples can be explained by the effect of the
larger sample size (when compared with the 500 µm samples).
The FL community was clearly dominated by mesopelagic and bathypelagic elements (Myctophiformes and Stomiiformes) throughout all the sampling period. This is not surprising because of a series of factors: 1) the larval reality “reflects”, to a certain extent, the features of the adult ichthyologic fauna where the mesopelagic and bathypelagic species currently attains more than 35% of the total of fish species previously cited for Azorean waters (SANTOS et al. 1997); 2) the sampling period did not include the preferred spawning season of the shallow-water species (Summer); 3) relatively deep tows carried out at distances from the coast hardly reached by larval stages of several shallow-water species with larvae-retention strategies. In this context, it is reasonable to conclude that the larval fish community found off Faial island during this study fits the oceanic islands general model proposed by BOEHLERT & MUNDY (1993). In other words, it included some shallow water, neritic and demersal "island-dependant" elements in a clearly oceanic environment.
Larvae of a number of commercially important species were found in the samples but, with the exception of Helicolenus dactylopterus (in February and March) their abundance was always relatively low since the majority of these species are neritic and demersal.
Despite of the short time data series, several changes and fluctuations between and within the main groups of FL are visible, indicating a seasonal highly dynamic community. These results also help to define and understand the spawning periods of the identified taxa, indicating the existence of three groups:
1) Winter spawners, including species with larvae occurring mainly in February and March, e.g. Helicolenus dactylopterus, Macroramphosus scolopax, Phycis phycis, Lepidopus caudatus.
2) Spring spawners, including species with larvae occurring mainly in May and June, e.g. Serranus cabrilla, Synodus saurus, Ceratoscopelus madeirensis, Callionymus reticulatus.
3) Continuous spawners or with a very protracted spawning season, including species
with larvae effective presence in every month of the study, e.g. Cyclothone spp., Diogenichthys atlanticus, Lampanyctus pusillus, Myctophum punctatum.
Studies on fish eggs and larval development
(age/growth) should be conducted in order to develop this spawning season investigation in the future.
The very high abundances found for C. madeirensis, which include a large range of development stages (results not published), make it an interesting key-species for further detailed studies of biology and trophic ecology.
f. New record
Three individuals were identified as Glossanodon leioglossus (Valenciennes, 1848) following all the major features described by SCHMIDT (1918) and SANZO (in BERTOLINI et al. 1931-1956), mainly the characteristic pigmentation pattern. There is only one species of Argentinidae cited for the Azores (SANTOS et al. 1997), Argentina sphyraena, whose larva was described by the same authors. This species cannot be confused with G. leioglossus. The known distribution for this species is the Iberian Peninsula, southern Spain to Cape Blanc in Mauritania, West, North of the Mediterranean and the Aegean Sea
(PAPACONSTANTINOU & TSIMENIDIS 1979;
COHEN in WHITEHEAD et al. 1989). With this new record, the distribution becomes wider, with the Azores as the western limit in the Atlantic.
ACKNOWLEDGEMENTS
This work is integrated in two studies funded by the Praxis XXI program CLIPE – Climatic effects on the ecology of coastal fishes: A translatitudinal and phenological approach; Life history of two migratory Anguiliform species, Anguilla anguilla (L.) and Conger conger (L.), from the North Atlantic. This work was also supported by FCT with a BIC grant to Luis Sobrinho-Gonçalves.
REFERENCES
AFONSO, M.H.D. 1989. Ictioplâncton da zona Sudoeste da costa Portuguesa - estudo de uma área de postura de sardinha, Sardina pilchardus (Walbaum, 1792). Instituto Nacional de Investigação das Pescas, Lisboa. 140 pp.
AHLSTROM, E.H. & J.R. THRAILKILL 1962. Plankton volume loss with time of preservation. CalCOFI Report 9: 57-73. Note: reference obtained from CIECHOMSKY &SANCHEZ (1983)
ALI KAN &G.HEMPEL 1974. Relation of fish larvae and zooplankton biomass in the Gulf of Aden. Marine biology 28: 311-316.
ALVARIÑO, A. 1980. The relation between the distribution of zooplankton predators and anchovy larvae. CalCOFI Reports 21: 150-160.
BOEHLERT, G.W. & B.C. MUNDY 1993.
Ichthyoplankton assemblages at seamounts and oceanic islands. Bulletin of Marine Science 53 (2): 336-361.
CAMPBELL, R.C. 1974. Statistics for biologists. 2nd Ed. Cambridge University Press. 385 pp.
CHÍCHARO, L.M.Z. & M.A. TEODÓSIO 1990.
Contribuição para o estudo do Ictioplâncton da ilha do Faial (Açores). Expedição Açores 89- ecologia e taxonomia do litoral marinho- relatório preliminar. Parte 1, Volume 1. Univ. Açores, Horta: 93-104. CIECHOMSKY,J.D.&R.P.SANCHEZ 1983. Relationship
between ichthyoplankton abundance and associated zooplankton biomass in the shelf waters off Argentina. Biological oceanography. 3 (1): 77-102. COHEN, D.M. 1989. Argentinidae. Pp. 386-391 in: WHITEHEAD,P.J.,M.L.BAUCHOT,J.C.HUREAU,J. NIELSEN & E. TORTONESE (Eds). Fishes of the Northeast Atlantic and the Mediterranean. Vols. 1, 2 and 3. UNESCO, Paris. 1473 pp.
DOYLE,M.J.,W.W.MORSE &A.W.KENDALL JR. 1993. A comparison of larval fish assemblages in the temperate zone of the Northeast Pacific and Northwest Atlantic Oceans. Bulletin of Marine Science 53 (2): 588-644.
FING,D.P.F.&A.A.ROBERTSON 1978. An analysis of the variability in Bongo net catches of pilchard eggs off South West Africa. Fisheries Bulletin of South Africa 10: 15-26.
GRIOCHE,A.&P.KOUBBI 1997. A preliminary study of the influence of a coastal frontal structure on ichthyoplankton assemblages in the English Channel. ICES Journal of Marine Science 54: 93-104.
ISIDRO, E.J. 1996. Biology and population dynamics of selected demersal fish species of the Azores Archipelago. Doctoral Thesis. Univesity of Liverpool. 249 pp.
MCGOWAN, J.A. & C.B. MILLER 1980. Larval fish and zooplankton community structure. CalCOFI Reports 21: 29-36.
MILLS, C.E. 1995. Medusae, siphonophores and ctenophores as planktivorous predators in changing global ecosystems. ICES Journal of Marine Science 52: 575-581.
MOSER, H.G., W.J. RICHARDS, D.M. COHEN, M.P. FAHAY,A.W.KENDALL JR.&S.RICHARDSON 1984.
Ontogeny and systematics of fishes. American Society of Ichthyologists and Herpetologists Special Publication no 1. Allen Press, inc., Lawrence, Kansas. 760 pp.
NELSON, J.S. 1994. Fishes of the World (3rd Ed.). John Wiley & Sons, New York. 600 pp.
OMORI, M. & T. IKEDA 1984. Methods in marine zooplankton ecology. John Wiley & Sons, New York. 332 pp.
PAPACONSTANTINOU,C.&N.TSIMENIDIS 1979. Some uncommon fishes from the Aegean Sea. Cybium, 3rd series 7: 3-14.
POWLES, H., F. AUGER & G.J. FITZGERALD 1984. Nearshore ichthyoplankton of a North temperate estuary. Canadian Journal of Fisheries and Aquatic Sciences 41: 1653-1663.
RÉ, P. 1980. The eggs and newly hatched larvae of Abudefduf luridus (Cuvier, 1830) (Pisces: Pomacentridae) from the Azores. Arquivos do Museu Bocage, 2ª série, 7 (8): 109-116.
RÉ,P. 1984a. Ictioplâncton da região central da costa Portuguesa e do estuário do Tejo. Ecologia da postura e da fase planctónica de Sardina pilchardus (Walbaum, 1792) e de Engraulis encrasicolus (Linné, 1758). Doctoral Thesis. Universidade de Lisboa. 425 pp.
RODRÍGUEZ,J.M.&J.P.RUBÍN 1991. El ictioplancton y la biomassa del zooplancton en aguas del sur de Galicia en Abril de 1987. Boletin del Instituto Español de Oceanografia, 7 (2): 115-127.
SANTOS,R.S.,S.HAWKINS,L.MONTEIRO,M.ALVES & E. ISIDRO. 1995. Marine research, resources and conservation in the Azores. Aquatic Conservation: Marine and Freshwater Ecosystems 5: 311-354. SANTOS,R.S.,F.M.PORTEIRO &J.P.BARREIROS. 1997.
Marine fishes of the Azores. Annotated checklist and bibliography. Arquipélago. Life and Marine Sciences Supplement 1: 244 pp.
SANZO, A. 1931-1956. Argentinidae. Pp. 22-31 in:
BERTOLINI,F.,U.D’ANCONA,G.MONTALENTI,E. PADOA, S. RANZI, L. SANZO, A. SPARTÁ, E. TORTONESE & M. VIALLI. Uova, larvae e stadi giovanili di Teleostei. Fauna Flora Golfo Napoli. Monografia 38 (1-4):1064 pp.
SCHMIDT, E.J. 1918. Argentinidae, Microstomidae, Opisthoproctidae, Mediterranean Odontostomidae. Reports of Danish Oceanography Expeditions to the Mediterranean. 1908-1910. 2 (A5): 1-40. SIEBURTH, J.MCN., V. SMETACEK & J. LENZ 1978.
Pelagic ecosystem structure: heterotrophic compartments of the plankton and their relationship to plankton size fractions. Limnology and Oceanography 17: 327-340.
SIEGEL, S. 1956. Non-Parametric statistics. Mc
Graw-Hill Co. New York. 312 pp.
SMITH, P. & S.L. RICHARDSON 1977. Standard techniques for pelagic fish egg and larva surveys. FAO Fisheries Technical Paper 175: 1-100. WHITEHEAD, P.J., M.L. BAUCHOT, J.C. HUREAU, J.
NIELSEN &E.TORTONESE (Eds) 1989. Fishes of the Northeast Atlantic and the Mediterranean. Vols. 1, 2 and 3. UNESCO, Paris. 1473 pp.
ZAR, J.H. 1996. Biostatistical Analysis. 3rd Ed. Prentice-Hall, N.J. 662 pp.
APPENDIX 1 Total zooplankton (ml/100m3) n o o f s a m p le s (t o w s ) 0 1 2 3 4 5 6 7 5 15 25 35 45 55 65 75 85 95 105115125135145155165175185 Mesh 335µm Mesh 500µm
Fig. A. Histogram of the total zooplankton biomass distribution by no of samples (tows).
Fish larvae/100 m3 n o o f s a m p le s (t o w s ) 0 1 2 3 4 5 6 7 8 10 30 50 70 90 110130150170190210230250270290310330350370390 Mesh 335µm Mesh 500µm
APPENDIX 2
Taxa that were identified but not yet quantified. Bathylagidae
Bathylagus bericoides (Borodin, 1929) or B. longirostris Maul, 1948 ? Gonostomatidae Unidentified Gonostomatidae Stomiidae Aristostomias sp.? Paralepididae
Lestidiops sp and/or Macroparalepis sp. ? Evermannellidae
Coccorella atlantica (Parr, 1928) Myctophidae
Diaphus spp.
Lampanyctus crocodilus (Risso, 1810) synonym of L. gemmifer (Goode & Bean, 1879)
Lobianchia dofleini (Zugmayer, 1911) or L. gemellarii (Cocco, 1838) ?
Hygophum reinhardtii (Lütken, 1892) ?
Hygophum hygomii (Lütken, 1892) Hygophum spp.
Notoscopelus resplendens (Richardson, 1845) or N. kroyerii (Malm, 1861) ?
Notoscopelus bolini Nafpaktitis, 1975 Gadidae
Gaidropsarus spp. ? Scorpaenidae Scorpaena spp. Serranidae
Epinephelus marginatus (Lowe, 1834) Unidentified Serranidae
Pomatomidae
Pomatomus saltator (Linnaeus, 1758) ? Blenniidae
Coryphoblennius galerita (Linnaeus, 1758) Unidentified Blenniidae
Bothidae
Arnoglossus rueppelli (Cocco, 1844) ? - Uncertain identification