A Work Project, presented as part of the requirements for the Award of a Master Degree in Economics /
Finance / Management from the NOVA – School of Business and Economics.
Keeping up with the market: The birth of a new digital
segment
ANA SOFIA MELO JÚDICE CRESPO CONSOLADO&
33940&VASCO DIAS PINHEIRO&33936
A Project carried out on the Master in Finance Program, under the supervision of:
Francisco Antunes da Cunha Martins
Abstract
The Walt Disney Company is a multinational diversified company that
operates in 5 different segments: Media Network, Parks and Resorts, Studio
Entertainment, Consumer products and interactive media and
Direct-to-consumer and International. Since this firm entered in the latter business unit
during the fiscal year of 2019 there is still some uncertainty concerning the
future of Disney’s stock price.
This thesis presents an application of two different valuation methods,
Discounted Cash Flow and Multiple analysis, to infer this company’s price by
the end of 2020. Since Disney is a complex company with different core assets
for both methods it was necessary to segregate by segment having in mind
different value drivers and future expectations. This project aims to present
projected financial results that support our final recommendation.
Keywords (up to four)
Value Drivers, Discounted Cash Flow, Comparable-firms, CAPEX investments
MASTER IN FINANCE
THIS REPORT WAS PREPARED EXCLUSIVELY FOR ACADEMIC PURPOSES BY [INSER STUDENT’S NAME], A MASTER IN FINANCE STUDENT
OF THE NOVA SCHOOL OF BUSINESS AND ECONOMICS.THE REPORT WAS SUPERVISED BY A NOVA SBE FACULTY MEMBER, ACTING IN
A MERE ACADEMIC CAPACITY, WHO REVIEWED THE VALUATION METHODOLOGY AND THE FINANCIAL MODEL.
(PLEASE REFER TO THE DISCLOSURES AND DISCLAIMERS AT END OF THE DOCUMENT)
▪ In Fiscal Year 2019 Disney completed the $71.3 billion
acquisition of certain businesses of 21stCentury Fox. The estimated
3-year cost saving for this merger is $2.5 billion.
▪ The main impact of this acquisition was a 43% increase on
domestic subscribers from 21CF’s cable channels, 81.25% growth in
film production capacity for the Studio. Direct-To-Consumer segment benefited from the full control of 2 streaming platforms: Hulu and Hotstar.
▪ Disney entered in DTC segment with 4 streaming services
and it is estimated that this segment’s market share will reach 11% by 2026. The global size of this market is $36.64 billion in 2018 with a nominal CAGR of 12.14% until 2026. This is a highly competitive market where Netflix has 30% of global subscribers.
▪ Despite the 21CF acquisition impact in Disney’s film releasing
capacity, the Box to Office performance is expected to decrease by 58% due to historical lower outcomes from Fox’s movies.
▪ Disney’s CAPEX investment for the Parks & Resorts segment
is expected to totalize $24 billion between 2020 and 2026, which is translated to an increase of 28% in this segment’s PPE.
▪ The Media segment faced a decrease of 4% in domestic
cable subscribers due to cord-cutting. To tackle this, Disney will increase its operating costs by 24.33% driven by the creation of original content.
Company’s description
Disney is a US global entertainment company that is expected to be worth $292,612 million by 2020, resulting in a 12% total shareholders’ expected return and an EPS of 6.62.
DISNEY
C
O
.
C
OMPANY
R
EPORT
E
NTERTAINMENT
3
J
ANUARY2020
A
NAS
OFIAC
ONSOLADO&
V
ASCOD
IASP
INHEIRO 33940@novasbe.pt/33936@novasbe.ptKeeping up with the market
The birth of a new digital segment
Recommendation: BUY
Vs Previous Recommendation HOLD
Price Target FY20: $162.23
Upside/Downside +12%
Price (as of 5-Jan-20) $146.88 Bloomberg: DIS US Equity
52-week range ($) 106.01-150.68
Market Cap ($ in million) 292,345
Outstanding Shares (in million) 1,802
Source: Nova SBE Equity Research
Source: Bloomberg
(Values in € millions) 2019 2020E 2021F
Revenues 71,528 78,801 80,424
EBITDA 14,698 18.559 18,889
Net Profit 10,913 11,951 12,192
EPS 6.06 6.62 6.77
P/E 21.52 24.82
“DISNEY CO.” COMPANY REPORT
Table of Contents
MEDIA NETWORK ... 4
MARKET OVERVIEW ... 4
Cable and Broadcasting segment:... 4
Market competition: ... 5
DISNEY’S MEDIA NETWORK SEGMENT: ... 6
Cable Networks: ... 7
Broadcasting: ... 8
▪ Valuation ... 9
PARKS AND RESORTS ... 9
MARKET OVERVIEW ... 10
Parks and Resorts segment: ... 10
Market competition: ... 10
DISNEY’S PARKS AND RESORTS SEGMENT: ... 11
Parks: ... 11 Resorts: ... 13 Cruises: ... 14 ▪ Valuation ... 14 STUDIO ENTERTAINMENT ... 14 MARKET OVERVIEW ... 14
Studio Entertainment segment: ... 14
Market competition: ... 15
DISNEY’S STUDIO ENTERTAINMENT SEGMENT: ... 15
Theatrical Distribution: ... 16
Home Entertainment: ... 17
TV SVOD Distribution and other: ... 17
▪ Valuation ... 17
CONSUMER PRODUCTS ... 18
MARKET OVERVIEW ... 18
Consumer Products and Interactive Media segment: ... 18
Market competition: ... 19
DISNEY’S CONSUMER PRODUCTS AND INTERACTIVE MEDIA SEGMENT: ... 19
Licensing, Publishing, and Games: ... 20
Retail: ... 20
▪ Valuation ... 20
DIRECT-TO-CONSUMER & INTERNATIONAL ... 21
MARKET OVERVIEW ... 21
Direct-to-consumer and Cable International Channels segment ... 21
Market competition ... 21
DISNEY’S DTC&INTERNATIONAL: ... 22
Direct-to-Consumer: ... 22 International: ... 23 ▪ Valuation ... 24 FINANCIALS ... 24 VALUATION METHODOLOGY: ... 24 MULTIPLES ... 26 APPENDIX ... 27 FINANCIAL STATEMENTS ... 27 REPORT RECOMMENDATIONS ... 30
“DISNEY CO.” COMPANY REPORT
Company overview
The Walt Disney Company is a worldwide entertainment firm that operates with a team of 223,000 employees, with offices in 46 different countries and with operations in five different segments: Media Network, Parks and Resorts, Studio Entertainment, Consumer Products & Interactive Media and Direct to Consumer
international. The company has operations worldwide, with a strong position in
the U.S and Canada, representing 73% of its total revenues, followed by Europe with 12%, Asia with 11%, Latin America and others representing 4% of the total revenues (figure 1). This largest share of revenues from the U.S. and Canada has remained stable over time, due to high domestic revenues of the Parks and Resorts, together with a stronger investment in U.S. local television channels and a focus on the consumer and interactive products segment.
During the Fiscal Year of 2019, Disney created a new segment that includes streaming services and International Cable Channels. With this new business unit, the company changed its revenues recognition, where the sales generated by those channels and digital platforms, stopped being recorded in the Media segment and started being recorded in the DTC&International. Consequently, the Media Network segment presented a lower percentage of total generated revenues (from an average of 43% between 2014 and 2018, to 35% in 2019) while DTC and international segment generated 13% in 2019. Additionally, Parks and Resorts segment was responsible for 30%, Studio Entertainment for 16% and Consumer Products and Interactive media for 6% of the total revenues (fig.2). The new DTC segment includes four streaming services Hulu, Hotstar, ESPN+, and Disney+. In the fiscal year of 2019, the company had more than 40 million paid subscribers from the 3 digital platforms: Hulu, ESPN+, and Hotstar. By contrast, the major players in this segment are Netflix, with 158 million subscribers, and Amazon Prime Video with 97 million. To differentiate from its competitors, Disney’s goal during FY2020 is to succeed with the introduction of the new streaming platform, Disney+, and to invest 6$ billion in original content. This new segment net income is only expected to reach a breakeven point in 2024, presenting a negative EBIT margin of -19% in 2019. The level of EBIT margin for the remaining segments in 2019 was 30% for Media, 23% for Parks and Resorts, 24% for the Studio and 38% for consumer products & IM (Figure 3). Looking on a strategic perspective, Disney’s vision statement specifies leadership for the Entertainment industry and focus on creating long-term returns for its shareholders (fig.4), through tactical acquisitions: in 2006, with the purchase of Pixar Animation Studios ($7.4Billion acquisition), and in 2009 when the acquisition of Marvel Entertainment ($4.24Billion) was completed. In 2012, Disney spent $4.05 Billion to acquire Lucasfilm and since then, the four Start
Figure 1-Source: Disney’s Annual Report
Figure 3-Source: Disney’s Annual
Report
Figure 2-Source: Disney’s Annual
Report
“DISNEY CO.” COMPANY REPORT
Wars Movies generated over $4.8Billion at the box office, plus revenues from licensing agreements, merchandising, toys, home entertainment formats, and new park environments. The company continues to follow Robert Iger strategic mindset and entrenched its position with the acquisition of the 21CF in March 2019. This deal had a significant impact on Disney’s performance, especially due to the 21CF Film and Television Studios, Fox’s international television business, and multiple cable networks. The acquisition totalized $69.5 billion, where $35.7 billion were paid in cash and $33.8 billion in shares (307 million shares at $110.00 per share). The first-year results from this acquisition were not very positive for shareholders since they saw a reduction on the dividend yield (from 1.48% to 1.24%) and in earnings per share (from $8.40 in 2018 to $6.68 in 2019)
both the biggest reductions over the past years. For this acquisition, Disney
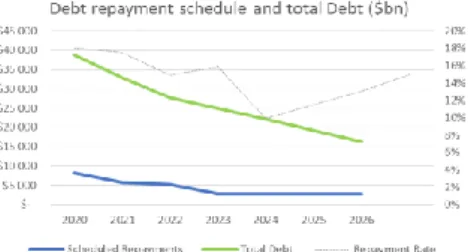
issued $37.5 Billion in debt which led to an indebtedness increase, reducing its flexibility to respond to business and economic condition changes. Moreover, the aforementioned level of debt reduced the available funds for capital expenditures, dividends, and other activities, even resulting in a higher probability of default from the changes in the net debt to EBITDA ratio (an increase of 195.36% in 2019, fig.4). For these reasons, Disney is now focused on recovering its debt ratios and has announced that it will not repurchase shares until the levels are re-established. With the acquisition of 21CF, Disney also obtained 30% interest on Hulu (previously owned by the former), making it the majority shareholder of this streaming service, with a 67% interest. Subsequently, Disney assumed full control of the Hulu operation with a future agreement, with Comcast and NBCUniversal, to acquire the remaining Hulu’s interest by 2024.
Media network
Market overview
Cable and Broadcasting segment:
The media network revenue is generated by charging affiliate fees, selling commercial-time and programming/distribution services which, by comparison with the growth of streaming services, faces some competitive challenges. It is now possible to get nearly every cable’s channel content for a lower price which implies a cord-cutting on cable subscriptions. The mentioned trend affects the ability to generate revenues, especially from affiliate fees, and it is expected to
continue at a CAGR1 of 12.36% until 20232 (fig.5). Consequently, companies are
charging higher contractual rates and investing high amounts on content to offset
this trend. On the Broadcasting segment, the revenues generated by “affiliate
fees” correspond to the rates charged to television stations affiliated with a
1Compounded annual growth rate 2
EMarketer US cord-cutting forecast Figure 5- Source: EMarketer
Figure 4-Source: Disney’s Annual
“DISNEY CO.” COMPANY REPORT
broadcast network for the right to deliver its programs. This segment is expected
to increase at a nominal CAGR of 6.76%3 (real CAGR of 4,53%) until 2024.
There are some obstacles to tackle on the advertising sales side since the U.S. TV market growth is slowing down due to the rise of ad-free platforms, which are taking viewership on traditional TV, thus, decreasing the penetration rate of commercials. Additionally, there is a lot of offers that imply a lower cost for advertisers, especially with digital advertising, which is expected to increase at a
nominal CAGR of 15.42% (a 14,19% real annual growth rate) until 20214 (fig.6).
It is foreseeable that advertising sales on this market will benefit from a slower
compounded real annual growth rate of 0.3% until 20235 since media companies
are reducing the number of advertising-minutes sold but charging higher commercials rates. The television production and distribution segment depends on the licensing fees and other revenues from the right to use television programs and productions and from content transactions with other company segments. The domestic licensing of rights to television programs has been presenting a nominal CAGR of 3.3% (real CAGR 0.7%) from 2014 until 2018 and it is estimated that the charged retrains fees will increase at a similar rate for the next years (fig.7).
Market competition:
The ability to survive in this market depends on the quality and quantity of original content produced by the players. In this line of thought, media companies are merging and acquiring players that enable them to leverage their competitive
advantages on the supply of content. The main competitors for this Disney’s
segment are AT&T company, Discovery Inc, Comcast, ViacomCBS, Netflix, Apple, Amazon, Facebook, and YouTube. It is relevant to mention that some of these big market players were involved in M&A deals during the last three years, namely: the $14.6 billion acquisition of Scripps Networks by Discovery Communications, the AT&T’s $85 billion acquisition of Time Warner Company, the $39 billion acquisition of Sky by Comcast in 2018, and the 2019 Disney's $70 billion acquisition of 21Century Fox and the merger between CBS and Viacom. These M&A deals allow companies to take advantage of synergies (fig.8) that lead to an increase in competition from the current market players and an increase of the barriers to entry on new companies that want to integrate this market. Companies like Netflix, Amazon, Apple, ViacomCBS, and AT&T are investing in content and can offer almost every cable’s channel programs, together with a wide library at an affordable price, leading to an increase in the
market competition and on cord-cutting. Additionally, Disney’s competition is
represented by other big players like Facebook (including its acquired social
3 https://www.spglobal.com/marketintelligence/en/news-insights/research/retrans-projections-update-sub-rates-continue-to-rise 4
EMarketer US advertising spending 5
PWC Media outlook report Figure 6-Source: EMarketer
Figure 7-Source: Statista
Figure 8- Source: Companies’ Reports
“DISNEY CO.” COMPANY REPORT
media platforms: Instagram), Twitter, Snapchat and YouTube that have been
increasing its AARPU6 (fig.9).
Disney’s Media Network Segment:
On FY2019, Media Network generated 35% of Disney’s total revenues and its
EBIT margin7 was 30%. Additionally, it presented a nominal CAGR growth rate
for revenues of 1.64% for the last 5 years and a ROIC of 18% in 2019, higher
than the WACC 6.9%8, meaning that it created value during this year. In figure 10
it is presented estimations for the ROIC until 2026 versus the weighted average
cost of capital 6.79%9 estimated for that period. The ROIC from 2019 was
significantly lower than in the previous years due to the consolidation of some businesses of 21CF especially driven by an increase in the goodwill and
intangible assets (namely MVPD10 agreements and Character/franchise
intangibles, copyrights and trademarks) (fig.11). It is estimated that the ROIC for the remaining years will be higher than the return on invested capital for 2019 due to a higher nominal CAGR of 4.63% (a real CAGR of 2.38%) on the core result of media network, for the period between 2019 and 2026, than in the total invested capital on this segment (0.37%). The expected ROIC for the perpetuity
on this Disney’s segment is around 13% and it will have the highest invested
capital weight11 representing 36% of the total invested capital in core in 2019 and
31% in 2026 due to a large portion of invested capital, allocated on the DTC&International segment. A significant part of the media networks invested capital is the TV costs and advances and, to estimate those, it was used the average cost per film released, completed and in-process/in development from 2019 together with the expected number of films released, completed and in-process/in development by year until 2026. One can assume FY2019 as a benchmark for the cost per film, which was the year with the higher marginal costs, reaching $75 million per release, $11 million per film completed and $17 per film in-process, since it is expected that this type of investment will keep
stable due to the improvement of content’s quality. This value is estimated to
continue growing at the expected US inflation rate (2.24%) whereas, the operating expenses and selling, general and administrative costs on this segment were forecasted as a percentage of revenues equal to the 2019 level. The estimated operating expenses for this segment were $19 billion by 2026 (fig.12) (which represents 62% of revenues generated). These expenses include programming and production costs, participation and residual costs, technical support, operating labour and distribution costs. Regarding selling, general and
6 Average advertising revenue per user 7 EBIT/revenues
8 From Bloomberg at 17/11/2019 9 From Nova SBE Equity Research 10 Multichannel Video Programming Distributor 11 (Invested capital in media/ total Invested Capital in core) Figure 10-Source: Nova SBE Equity
Research
Figure 11-Source: Disney’s Annual
Report
Figure 12-Source: Nova SBE equity
“DISNEY CO.” COMPANY REPORT
administrative costs will be around $3 billion at the end of 2026 ( 10% of Media’s revenues).
Cable Networks:
Disney’s primary cable networks are ESPN, Disney, and Freeform. Additionally, the company acquired certain cable networks of 21CF namely National Geographic and FX networks. The revenues from Cable networks totalized 66% of the entire revenues from the Media Network segment in 2019. This segment was segregated by revenues from affiliate fees, ad sales, and TV/SVOD programming and distribution. On the first sub-segment, the ability to generate revenue is directly linked to affiliate fees charged and to the number of subscribers by channel. Due to cord-cutting, it is possible to notice a constant decrease in the number of US subscriptions where, from 2014 until 2019, ESPN domestic had a total decrease of 19%, Disney of 12% and Freeform of 10% (fig.13). By contrast, the number of subscribers on international channels has been increasing along with the affiliate fees charged on domestic and international channels, allowing this sector to benefit from a positive growth rate. In FY2019, the company changed its segment structure and the international channels were recorded on the new segment DTC&International. Despite the change in the recording system, revenues from affiliate fees increased in 2019 due to higher contractual rates charged and new channels acquired from 21CF (fig.14). For forecasting purposes, this document proceeds with the estimation of subscribers using the historical average-variation for each cable channel’s penetration rate in the US TV-households. In 2019 the US penetration rate was 86.2% for ESPN, 89.3% for Disney Channel, 70.6% for Freeform, 89% for National Geographic and 90% for FX and it is expected that these percentages will decrease at a CAGR of -2% for ESPN and -1% for the remaining ones,
based on the historical average of these percentages’ variations. The basis to
estimate these penetration rates was the number of cable TV households in the
US, which is expected to decrease at a CAGR of 1% until 202612 (fig.15). For
2026, it is assumed a penetration rate of 72% for ESPN, 79% Disney channel, 58% for Freeform, 82% for National Geographic and 83% for FX channel. Despite the US facing a high rate of cord-cutting, it is believed that Disney will be able to offset this trend and increase its revenue by a nominal CAGR of 3.37% (1.13% in real terms) by charging higher affiliate fees since it is investing in the creation of original content, that allows its channels to differentiate from its competitors. These costs are included in Media’s operating expenses (that include programming and production costs) and are expected to increase until $19 billion in 2026 (versus $15 billion in 2019).
12 Nielsen Estimates US Figure 15-Source: Nielsen Estimates
Figure 13 -Source: Disney’s Annual Report
“DISNEY CO.” COMPANY REPORT
The price charge for commercial time is directly linked to the program’s rating,
which reflects the market acceptance, and the size and nature of the audience. The decrease in revenues from ad sales on FY2019 occurred to the consolidation of international channels on the DTC&International segment, which implied a lower average commercial time, per hour, in minutes, and a reduction on the charged price directly linked to lower global penetration rate, since it only reaches the US audience. The average minute per hour of advertising, on the channels previous owned by 21CF, is expected to decrease at an accelerated rate of -10% until 2026. This decline is based on Fox’s announcement, in 2018, where it was expressed the intention of reducing commercial time to 2 minutes per hour. The group estimates that this goal will take some time to be achieved so the estimations for 2026 are 3.35 minutes per hour for National Geographic and 4.78 for FX network. Additionally, it is expected Disney’s branded channels and ESPN to have a slower reduction of -0.05% per year reaching 6.18 and 9.32 minutes per hour in 2026, respectively, and -5% for Freeform attaining 4.22 minutes per hour by 2026. Moreover, the revenues from ad sales will benefit from an increase of CAGR of 0.43% until 2026 (higher than the growth rate of 0.3%
expected for this market) due to an average increase of 3%13 on prices charged
per commercial time sold until 2026. Despite the challenges on this market, Disney is investing in better targeting capabilities that will allow the company to reduce the number of ads, while charging higher prices to advertisers, and create a service that is more valuable for them and the costumers. For the revenues generated by TV/SVOD programming and distribution, it is estimated that it will benefit from a nominal CAGR of 3% (0.76% in real terms).
Broadcasting:
The company owns 8 domestic TV stations in New York, Los Angeles, Chicago,
Philadelphia, Houston, San Francisco, Fresno, and Raleigh-Durham.
Furthermore, Disney has affiliation agreements with 240 US local TV station reaching almost 100% of US television households. Broadcasting revenues represented 34% of total Media’s revenue in 2019 and one may divide them into the same sub-segments as the cable business unit. The first subsegment, affiliate fees, is dependent on the number of the local TV station with affiliate agreements with the company and the corresponding charged fees. The number of local televisions with affiliation agreements decreased by approximately 2%
during 2019 but it was offset by an increase of 7.5%14 on fees charged. It is
assumed that Disney will maintain the same 240 local televisions with affiliate agreements, during the next six years, and the annual price, charged per affiliate, of $8.37 million in 2019, will increase at the US inflation rate until 2026. The
13 https://www.emarketer.com/content/emarketer-total-media-ad-spending-worldwide-will-rise-7-4-in-2018 14 The Walt Disney Company: Form 10-K 2019
“DISNEY CO.” COMPANY REPORT
nominal CAGR for this Disney’s broadcasting segment is 2.34% (0.1% in real terms). The reduction on advertising in 2019 (fig.16) was linked to a decrease of
viewership directly dependent on a reduction of 3% on US television household15
penetration on the areas of Disney’s owned domestic television stations, leading to a lower price charged per second of $539. It is presumed, that the total of Disney's Households will decrease at 1% a year (fig.17). However, the value charged per second of 2019 will increase at a nominal CAGR of 4% leading to a real CAGR of 2.26% (4.5% in nominal terms) for ad revenues until 2026. The increase in the TV/SVOD programming and distribution sub-segment was a result of the consolidation of TFCF sales. For estimating purposes, it was inferred the number of program hours and the distribution/ programming costs of one hour. In 2019 the broadcast segment produced 57.5 hours of programs and it charged $49.9 million per each hour, leading to revenue of 2,871 million dollars. To forecast the revenues generated in TV programming/distribution it was estimated the total of program hours per year and the distribution/programming price per hour increasing at the US inflation rate using the price charged in 2019, as a benchmark. The nominal CAGR for TV/SVOD distribution and programming revenue is 2.31% and the real CAGR is 0.08%. The revenues from media network segment are expected to present a nominal CAGR of 3.261%, which is translated to a real CAGR of 1.02%
▪ Valuation
The estimation of this business unit Enterprise Value was done through the Discounted Cash Flow Method using the WACC estimations presented on the section Valuation Methodology DCF, in this report. The expected growth rate used in this analysis (2.05%) was computed by multiplying the Return On New
Invested Capital16 (31%) by the reinvestment rate on new capital17 (7%). Relying
on these assumptions, the estimated Enterprise Value for this segment was $127,128 million. Additionally, it was conducted a sensitivity analysis between the RONIC and the RR in order to measure the impact on the growth rate of 1% error and it was estimated an interval between [1.68%,2.44%] for the growth. Having this in mind, it was conducted an additional sensitivity analysis between the growth rate and the WACC where the interval for the EV was estimated between [101,676;172,517] (in million USD).
Parks and Resorts
15 Nielsen Research: US TV household 16 (NOPLAT
t ― NOPLATt-1)/(Invested Capitalt ― Invested Capitalt-1) 17 (Invested Capital
t-1 ― Invested Capitalt-2)/ NOPLATt-1 Figure 17-Source: Nielsen’s Research US
TV Household
Figure 19-Source: Statista
Figure 18-Source: Nova SBE Equity research
Sensitivity analysis between RONIC and RR
2.05029% 5.56% 6.56% 7.56% 30.28% 1.68% 1.98% 2.29% 31.28% 1.74% 2.05% 2.36% 32.28% 1.79% 2.12% 2.44% Sensitivity analysis with g and wacc
127,128
$ 1.68% 2.05% 2.44%
6%$ 149,842 $ 159,795 $ 172,517 7%$ 121,208 $ 127,128 $ 134,400 8%$ 101,676 $ 105,483 $ 110,038
“DISNEY CO.” COMPANY REPORT
Market overview
Parks and Resorts segment:
In 2018 the number of international tourist arrivals worldwide reached 1,401 million an increase of 57% when compared with 2009. This global outbound tourism has a direct impact on this segment and is expected to continue rising at
3.3% in the Americas, 3.5% in Europe and 4.7% in Asia Pacific until 202118.
The global market of amusement parks is forecasted to increase by a nominal
CAGR of 9.12% (6.88% in real terms) reaching $84 billion19 in 2026 (fig.19) while
the revenue for this industry is expected to reach $21.20 billion in the United
States by 202320. The amusement parks’ attendance has been increasing, where
the 25 amusement/theme parks benefited from a growth rate of 3.3%21 worldwide
attendance from 2017-2018, reaching 250 million attendees in 2018. On the
Resort global market, the hotel’s occupancy rate has been increasing, reaching
72% in the Americas, 66% in Europe and 71% in Asia Pacific in 2018 (fig.20). Aligned with this trend, this market has been showing an increase in revenue per room, where at the end of 2018 Americas presented a value of $85.83, Europe of $100.92 and Asia Pacific a value of $75.53. In the US the average revenue per available room increased by 1.1% in 2019 and it is expected to increase by 1% by 2020. Lastly, it is relevant to mention that the revenue from the global cruise industry is expected to reach $55 billion by 2026 benefiting from a nominal CAGR of 4.2% (1.96% in real terms) until 2027.
Market competition:
The biggest Disney’s competitors, considering the Parks industry, are Universal
Studios, with themed parks in the US, in Japan and Singapore; Six Flags Entertainment Corporation, which operates 25 properties throughout North
America; Europa Park, with 54 attractions in Germany; Cedar Fair with 12 amusement parks in the US and Canada. As can be noticed in figure 21 Disney had 4 of its parks in the top 5 of attendance in 2018, with Universal Studios aso being part of these high attendance parks. Additionally, this segment faces competition from other types of vacation companies like hotels and cruise-ships. On the hotel's side, Disney competes with strong global brands like Hilton Hotels & Resorts (that generated $7.4 billion in 2019), Marriot ($5.04 billion) and Holiday Inn ($3.95 billion). The cruise competition is mainly constituted by Carnival Corporation with a market share of 44%, Royal Caribbean with 24% and MSC cruises with 7%.
18 Statista: https://fesrvsd.fe.unl.pt:2099/statistics/274011/outbound-visitor-growth-forecast-worldwide-by-region/ 19https://www.verifiedmarketresearch.com
20 Statista: industry revenue of “amusement and theme parks in the U.S. from 2011 to 2023” 21 Theme Index Report: https://www.aecom.com/wp-content/uploads/2019/05/Theme-Index-2018-4.pdf
Figure 20-Source: Statista
“DISNEY CO.” COMPANY REPORT
Disney’s Parks and Resorts Segment:
Parks and Resorts segment was responsible for 30% of Disney’s total revenues and its EBIT margin was 23% in 2019. It presented a nominal CAGR of 7.51% (which is translated into a real growth rate of 5.27%) for the last 5 years. This segment created value in 2019 since it presented a ROIC of 15%, higher than
the WACC 6.9%22. In figure 22 it is illustrated the ROIC estimations until 2026
versus the weighted average cost of capital 6.79%23 estimated for that period.
The group estimate that the ROIC for perpetuity will be 15% due to an increase on invested capital versus 2019 (fig.23). The weight of invested capital for this business unit was 16% of the total Invested Capital in core in the fiscal year 2019 and this weight will increase to 19% of the total IC in core by 2026 due to the constant CAPEX investments. The caption with a higher weight on the Invested Capital segment is the Parks, Resorts and other properties which, in 2019,
represented 107%24 of Disney’s Parks and Resorts’ Invested Capital. To
estimate this caption, the group analyse Disney’s future investments for this
segment, its competitors and the market general opinion. It was also created a timeline of the expected future investments for this sector represented in figure 24. In the following sections of this report, it is presented the investment in CAPEX with more detail, segregated by sub-segment. Those values of
investments were added to the CAPEX of the previous years since Disney’s
Parks, Resorts and other property are carried at historical cost.
The expenses and selling, general and administrative costs on this segment were forecasted as a percentage of revenues equal to the 2019 level. The estimated operating expenses for this segment are $16.957 billion by 2026 (which represents 52% of revenues), including operating labor, costs of goods sold, infrastructure costs, supplies, commissions, and entertainment offerings. Concerning selling, general and administrative costs one may forecast that they will reach a value of around $4 billion at the end of the fiscal year of 2026.
Parks:
Disney operates parks in the US, Europe, and Asia. In the Domestic Parks segment, the company has 4 parks in Florida: Magic Kingdom, EPCOT,
22 From Bloomberg at 17/11/2019 23 From Nova SBE Equity Research 24 Nova SBE Equity research Figure 23-Sources: Nova SBE Equity
Research, Theme ParX, and Annual Report
Figure 22-Source: Nova SBE Equity
Research
Figure 25-Source: Nova SBE Equity
Research
“DISNEY CO.” COMPANY REPORT
Hollywood Studios, and Animal Kingdom and 2 parks in California: Disneyland and Disney California Adventure. In the international parks, Disney operates Disneyland and Walt Disney Studios in Paris, Disneyland Park in Hong Kong, Disneyland in Shanghai and Disneyland and Disney Sea in Tokyo.
To estimate revenues generated by Disney’s parks, they were separated into Domestic and International Parks. For both, it is considered as value drivers, the average guest spending and the number of attendees. It was used the average number of attendees per themed area, in 2019, as a benchmark and the historical annual growth rate was employed to estimate the future years. Additionally, it was forecasted for each year the number of themed areas in each park (based on market perspectives and information disclosed by Disney) and multiply those with the estimated number of attendees per area. On the Domestic Parks, it was estimated an average of attendees per themed area for each park in 2019 and the respective annual growth rate until 2026 (fig.26). By this year, is estimated that the sum of all the themed areas in domestic parks equals 41 and the total attendance of these 6 parks reaches 113 million (fig.25). Additionally, it is expected that the average guest spending increases at the US inflation rate until 2026 leading to a revenues’ nominal CAGR of 5.34% (3.1% real CAGR) for
the domestic parks
(
fig.26). On the international Parks, the average attendeesper themed area for each park during FY2019 are presented in figure 27. In 2026 it is expected that the total of themed areas in international parks equals 45 (fig. 28). One trend that is included in the CAGR for the Hong Kong Disneyland is the anti-government protests that have been happening since June 2019, which are
expected to have an impact for the next few years. This country’s tourism
reduced by 40% when compared with 2018, and the group believes that it will slowly recover its levels due to political, social and economic uncertainty. For the average guest spending, it was used the 2019 value as a benchmark and the growth rate used for each year was the average of France, China, and Japan inflation. The expected nominal CAGR for revenues from the international parks is 4.15% until 2026 (fig.27) where, in this year, it is predicted a total of 72 million attendees. The predicted investment in CAPEX for Domestic Parks is as follows: 4 themed areas in EPCOT by 2023, which will be the largest remodulation in a Disney park, which will totalize $2billion; a new themed area, Marvel Land, in Disneyland California Adventure by 2020, that has a budget of $1 million. For International Parks, The Walt Disney Studio will benefit of a total investment of $2.5 billion in 3 new themed areas: Marvel Land in 2021, Star Wars in 2023 and Frozen in 2025, Hong Kong Disneyland will also benefit from an investment of $700 million on 2 new themed areas: Frozen Land in 2021 and additional themed area in 2023, the Disneyland Shanghai will also have an additional themed area, Zootopia in 2024, that has a budget of $700 million. Additionally, Tokyo Figure 29- Source: Nova SBE Equity
Research and Annual Report
Figure 28-Source: Nova SBE Equity
Research
International Parks Attendees ('000) CAGR
Disneyland Paris 1974 0.3% Walt Disney Studios Park (Paris) 1389 3.0% Hong Kong Disneyland 861 -2.0% Shanghai Disneyland 1719 2.0% Tokyo Disneyland 2583 1.0% Tokyo DisneySea 2115 1.0%
Domestic Parks Attendees ('000) CAGR
Magic Kingdom 3,477 2%
Epcot 6,344 2%
Disney's Holywood studios 1,657 2% Disney's animal kingdom 2,006 2% Disneyland California 2,379 3% Disney california adventure 1,693 2%
Figure 26-Source: Nova SBE Equity
Research
Figure 27-Source: Nova SBE Equity
“DISNEY CO.” COMPANY REPORT
Disneyland and Tokyo Disney Sea will benefit from an investment of $3.5 billion between 2020 and 2022, with 2 new themed areas.
Resorts:
On Disney’s Resort segment, the group segregate the revenues from domestic and international resorts, and it was considered occupancy rate, per room guest spending and available room nights. For forecasting the available room nights available, it was used a historical average of available nights per room and it was multiplied by our estimations of the number of rooms per year until 2026, using the available information on the Parks, Resorts and cruises CAPEX projects estimation included in the Disney’s Parks and Resorts Segment section.
On the Domestic segment, the company has 3 resorts: The Walt Disney Resort Florida (with 18 hotels with 22,500 rooms), Disneyland California (with 3 hotels with 2,400) and Aulani Hawaii (with 1 hotel with 351 rooms) (fig.29). The historical average of available nights per room is 406, the occupancy rate (88%) was estimated using an average of the last 5 years and the per room guest spending was projected to grow at the US inflation rate until 2026. It is expected that the Domestic Resort segment will benefit from a nominal CAGR of 3.27% until 2026 (fig.30). On the international Resort segment, Disney has Disneyland Paris with 7 hotels Disneyland Hong Kong with 3 hotels, Shanghai Disney Resort with 2 hotels and Tokyo Disney Resort with 4 hotels (fig.31). The average available of nights per room on this segment is 278 and it was multiplied by the number of rooms on each Resort. We segregate these values since it is important to distinguish between geography segments to capture the impact of the different exchange rates: EUR/USD, CNY/USD and JPY/USD and the different inflation rates for each geography in the value of per room guest spending. The occupancy rates were estimated as a historical 5-year average and it is 78% for Disneyland Paris, 79% for Hong Kong, 88% for Shanghai Disney Resort and 78% for Tokyo Disney Resort. This international segment will present a nominal CAGR of 3.88% in revenues until 2026 (fig.30). In this segment the CAPEX estimation was based on the following investments: in Walt
Disney World Florida Resort where the company will invest $35025 million in the
construction of a new hotel with 900 rooms (Disney Lakeside Lodge in 2022); in Disneyland California on a new Luxury Hotel with 700 rooms by 2021, estimated in $1,000 million. For the international Resorts, Disney will invest $200 million on the remodulation of NY Hotel located in Disneyland Paris and will invest $7.5 billion from 2023 until 2026 in the expansion of Hotels in Disneyland Paris by building two new hotels that will add 1,856 rooms until 2026 and in Tokyo Disney will invest $1million on a new hotel with 475 rooms by 2025.
25 https://forums.wdwmagic.com/threads/reflections-%E2%80%93-a-disney-lakeside-lodge-project-89-development-near-fort-wilderness.938671/page-19 Figure 30-Source: Nova SBE Equity Research
Figure 31-Sources: Nova SBE Equity
“DISNEY CO.” COMPANY REPORT
Cruises:
Disney Cruise Line is a 4-ship vacation cruise line: Disney Magic and Disney Wonder with 875-stateroom ships and the Disney Dream and the Disney Fantasy
are approximately 1,250-stateroom ships. The Company is expanding its cruise
business by adding 3 new ships in 2021, 2022 and 2023. The new ships will have approximately 1,250 staterooms and according to Disney’s annual report, the investment for those will be $1,200 million for the cruise acquired in 2021 and $1,320 for the cruises acquired in 2022 and 2023. The estimation of revenues for
this segment is based on the total staterooms (4,254 in 2019) and the “per
stateroom” guest spending ($241 in 2019). Using the future new ships to
estimate the additional staterooms and relying on the assumption that the “per
stateroom” guest spending will grow at the US inflation rate it is estimated that this segment will have a nominal CAGR of 11.98% until 2026.
▪ Valuation
The expected growth rate for this segment (4.43%) was computed multiplying
the RONIC (20%) by the RR on new capital26 (22%). Relying on these
assumptions the estimated Enterprise Value for this segment was $136,077. Additionally, it was conducted a sensitivity analysis between the RONIC and the RR in order to measure the impact on the growth rate of 1% error and it was estimated an interval between [4.02%;4.87%]. It was also conducted a sensitivity analysis between g and the WACC where the interval for the EV was estimated between [90,590;298,288] (in million USD).
Studio Entertainment
Market overview
Studio Entertainment segment:
The number of tickets sold worldwide presented low volatility over the past 10 years, with a CAGR of around -0.5%, which has been offset by an increase in the global ticket price with a CAGR of 1.6% (-0.4% in real terms) for the same period (fig.33). This is a segment that presents 4 revenue sources: box office (in 2D and 3D formats, fig.34), home distribution (trough TV licensing, online distribution and physical formats), licensing on streaming platforms and advertising in movies. In the box office market, the 3D format does not present future growth expectations, remaining in the 20% level of revenues. For cinema advertising, it is expected to grow at a CAGR of 3.6% (1.4% in real terms) from 2018 to 2023, to annual revenues of $1.1Billlion. There were 800 movies released in 2019 but since this is a very concentrated market, 1/3 of the total revenue in box office came only from 10 movies. Despite having worldwide revenues, the companies must focus as well, on domestic markets for producers and distributors, since over the past
26 (Invested Capital
t-1 ― Invested Capitalt-2)/ NOPLATt-1 Figure 34-Source: IMDb
Figure 32-Source: Nova SBE Equity
Research
Sensitivity analysis between RONIC and RR
4.43387% 19% 20% 21%
21% 4.02% 4.24% 4.45%
22% 4.21% 4.43% 4.66%
23% 4.40% 4.63% 4.87%
Sensitivity analysis with g and wacc 136,077
$ 4.02% 4.43% 4.87%
6%$ 185,072 $ 224,899 $ 298,228 7%$ 121,861 $ 136,077 $ 156,901 8%$ 90,590 $ 97,340 $ 106,314
“DISNEY CO.” COMPANY REPORT
five-year around 33% of revenues from this market result from the movies’
domestic performance. For the U.S., this market registered $10.3 Billion in box to office, also showing a noticeable concentration of revenues, since in 2019 36% were provided by 8 movies from 3 different Studios. This is a segment that on a domestic perspective is expected to grow on a slow and steady paste with a CAGR for 2023 of 0.8%. The growth in Streaming services has flattened the growth in movies’ theatrical distribution, resulting in a reduction of movie theatres growth in the U.S. (fig.35).
Market competition:
In 2019 Disney holds 36% of market share for the Studio Entertainment segment, followed by Warner Bros Studios (14.9%), Universal Picture (12.1%) and Sony Pictures (9.6%). Has mentioned before, this is a highly concentrated market, with over 113 operating domestic Studios, 88% of revenues coming from theatrical distribution are concentrated in only 7 different market players.
The Walt Disney Studio has been setting the bar for other competitors since, in the past years, its movies have been leading in worldwide performance where, in 2019, it has presented 4 movies on the top five performance charts. This is also reflected in their average performance per release, approximately $154.8 million, followed by Sony Pictures with $58.5 million per movie. This industry is facing the return of pirate streamers which is showing a major impact on this segment since, in 2018, 24% of U.S consumers watched a movie on a piracy platform, while it was still in theatres. The large offer in the streaming platform is pushing consumers to piracy streamers, but higher control mechanisms are being implemented by governments and regulatory mediators, so this impact will be reduced over time.
Disney’s Studio Entertainment Segment:
The Studio Entertainment segment can be divided into three business units: Theatrical Distribution (43% of total revenue), Home Entertainment (17%) and TV Service Video on Demand and others (40%). In 2019 it represented 16% of Disney’s total revenue with an EBIT margin of 24%, lower than historical records, due to higher operating expenses. This reduction on EBIT margins resulted from the acquisition of Fox’s Studios, that historically presented lower box office revenues per movie (-41%) and had a 22.5% increase in film production expenses. Additionally, this segment presented a CAGR of revenues of 7.33% for the last 5 years (figure 37) and a ROIC of 13% (figure 38) in 2019, higher than
the WACC 6.9%27, therefore being able to create value during that period.
On the total of Disney’s Invested Capital, this segment had a share of 19.6% in 2019, which represented over $31billion in this account. The biggest percentage of this value comes from film production costs, which has mentioned having
27 From Bloomberg at 17/11/2019 Figure 37-Source: Nova SBE Equity
Research and Annual Report
Figure 36-Source: IMDb Figure 35-Souce: Statista
“DISNEY CO.” COMPANY REPORT
increased in the past year due to the acquisition of 21CF. These costs can be segregated in released (47% of total), completed (9%), in-process (41%) and pre-production (3%) and for forecasting purposes it was used FY2019 has a benchmark since on released costs and in-process costs there were major increases this year, which we believe it is the result of different quality standards in Disney and Fox distribution and production processes. For these accounts, we estimated continuous growth at the inflation rate and depending on the number of movies in each stage. For the completed and pre-production costs we forecasted growth at the average of the former years due to its historical low volatility. As for selling, general and administrative costs, Disney’s acquisition of 21CF resulted in a low impact and historically it represented 29% of Disney’s revenues every year. Depreciations and amortizations are very insignificant in this segment and were forecasted based on historical values. Having this in mind, we expect that, for 2026, Disney’s operating expenses will be 43% of revenues, with theatrical film costs of $11 billion that year.
In figure 38 it is presented our estimations for the return on invested capital until
2026 versus the weighted average cost of capital 6.79%28 estimated for that
period. The CAGR for core result will be 4.08% for the Studio Entertainment segment and it is expected that synergies from Fox Acquisition will result in a reduction of the 5-year CAGR on operating expenses (from 10.6% to 5.4%),
leading to an expected ROIC for this segment perpetuity of 10.5%.
Theatrical Distribution:
In the Studio Entertainment market, the performance of a company is as good as the performance of their movies firstly on the theatres and later on the at-home
platforms (both digital and physical). Due to unpredictability regarding movies’
performance, it was elaborated a revenue forecast based on 2 factors: the number of movies released on the theatrical distribution segment and the average revenue per movie, eliminating, this way, the volatility from movie’s performance. Starting from the number of movies released estimation, it was analysed the historical releases of Fox and Disney’s Studios (figure 39). Looking at the past 5 years, we saw that the number of movies released adds low volatility (going around 10 movies from Disney Studios and 15 from Fox). After the acquisition, Disney announced that Fox would, from now on, only release half of the movies, mainly to avoid competition from the films and due to expected synergies from the Studios. At the same time, Disney already announced some future movies until 2026, which was also taken into consideration. With these three factors in mind, it was estimated the movies that will be released, going from 21 to 17 movies launched each year. For the average revenue per film, historically Disney has much higher returns per movie than Fox (figure 40) and
28 From Nova SBE Equity Research Figure 38-Source: Nova SBE Equity
Research and Annual Report
Figure 39-Source: Nova SBE equity
research and Annual Report
“DISNEY CO.” COMPANY REPORT
after this acquisition, despite a better performance from higher capacity, the average individual performance of each movie went down by 41% in 2019. Operating on the Entertainment Industry, which is not a basic need, Disney is highly dependable on the availability of its consumers to spend resources on secondary needs. Therefore, we forecasted that our average revenues would grow at the U.S. Consumer Price Index taking as benchmark FY19 average revenue per movie released. According to our forecasting plan, Disney is expected to present a CAGR of 2.38% (0.14% in real terms) for the Theatrical distribution segment.
Home Entertainment:
In this segment, Disney presents distribution in digital and physical formats (DVD and Blu-ray). Due to market replacement of physical formats with digital (figure 41), the latter formats presented a CAGR of 22% (18% in real terms), for the last 5 years, while physical a CAGR of -12%. Disney started focusing their physical formats on their Signature Collection (a slot of their best performing films) and in Blu-Ray formats, that currently are holding the physical format market (83%) and invest mostly in digital formats. For forecasting purposes, it was assumed Disney would launch each movie produced in a digital format since there are not many costs associated. For the physical formats, we looked at the previous publications of their DVD Signature Collection and Blu-ray formats, and with the same reasoning as in Theatrical Distribution, it was considered the announced releases and forecasted possible ones based on historical variation (2 to 5 releases per year in DVD and 10 to 14 in Blu-ray). Once more, Fox’s movies showed lower performance on digital formats than Disney’s and it implied a decrease in revenues per release of -37% in 2019. Taking this as a starting point for our forecast (figure 42), we estimated a continuous growth for revenues per release according to the Consumer Price Index, resulting in a CAGR until 2026 of 4.71% (2.49% in real terms).
TV SVOD Distribution and other:
Disney operates in this segment by licensing its movies on DTC platforms, a market that has been growing up to two digits in the past years (figure 43). Resulting from overall market growth, in the past five years, Disney has shown a CAGR of 8.9% in this business unit. For forecasting purposes, we looked at estimations on the growth of SVOD revenue and the number of subscribers until 2024, showing an average growth rate of 16.03% and 11.09% respectively. Using these market measures and Disney historical performance as a benchmark, we estimate that Disney’s TV/SVOD distribution and others will present a CAGR of 8.26% (6.03% in real terms) until 2026.
▪ Valuation
Figure 42-Sources: Nova SBE equity
research and annual report
Figure 41-Source: MPAA
“DISNEY CO.” COMPANY REPORT
The expected growth rate for this segment (3.18%) was computed multiplying the
RONIC (20%) by the RR on new capital29 (16%). Relying on these assumptions
the estimated Enterprise Value for this segment was $63,307million. It was conducted a sensitivity analysis between the RONIC and the RR in order to measure the impact on the growth rate of 1% error and it was estimated an interval between [2.83%;3.55%]. Additionally, it was done a sensitivity analysis between g and the WACC where the interval for the EV was estimated between [48,358;94,994] (in million USD).
Consumer products
Market overview
Consumer Products and Interactive Media segment:
For the consumer products and Interactive Media segment, we will be looking at
three different markets related to Disney’s business operations: Toys, Gaming,
and Publishing. The Toy industry has been presenting a stable growth in the past years at a global level (5-year CAGR of 2.7%) and the U.S. (5-year CAGR of 3.8%) (figure 45). For the U.S. this growth is highly correlated with the disposable income levels from consumers since toys represent a second level need for customers. Also, when looking at the number of toys exported from the U.S., there has been a continuous growth and it is expected a CAGR of 3.84% until 2024. Currently, China manufactures over 70% of global toy demand and present $40 Billion in revenues in 2018 (5.6% growth for the year).
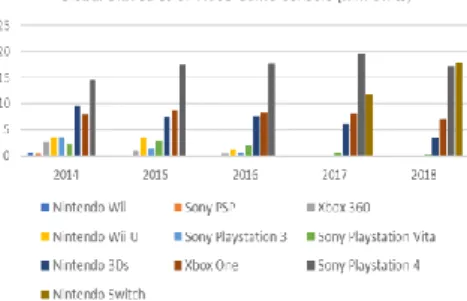
Physical console games show a negative performance on a 5-year past analysis (-1.82%) (figure 46), as for video game consoles (-0.51%). In this segment, companies have invested large amounts in Virtual Reality, showing in 2018 53% of the total investment in this industry. Players such as Sony have already started releasing some innovation in this area, expecting a market value of $6Bilion by 2023. Digital Gaming advertising and streaming video-game multiplayer competition is the new main source of revenue for this market, since every year the number of players increase (expected CAGR of 4.3% until 2021, 2.03% in real terms)) and consequently, the fees for this revenue sources.
Looking at the publishing industry, there has been a constant decrease in physical publishing revenues, which has been offset by a constant growth in digital consumption of published content. This market is expected to grow with a 5.96% 5-year CARG (3.73% in real terms) for epublishing revenues worldwide (figure 47).
29 (Invested Capital
t-1 ― Invested Capitalt-2)/ NOPLATt-1 Figure 45-Source: The NPD Group
Figure 46-Source: PWC
Figure 47-Source: WePC
Figure 44-Source: Nova SBE Equity
Research
Sensitivity analysis between RONIC and RR
3.18041% 18.71% 19.71% 20.71%
15.14% 2.83% 2.98% 3.13%
16.14% 3.02% 3.18% 3.34%
17.14% 3.21% 3.38% 3.55%
Sensitivity analysis with g and wacc 63,307
$ 2.83% 3.18% 3.55%
6%$ 78,767 $ 85,622 $ 94,994 7%$ 59,898 $ 63,307 $ 67,657 8%$ 48,358 $ 50,286 $ 52,648
“DISNEY CO.” COMPANY REPORT
Market competition:
For the Consumer Products and Interactive Media segment, Disney faces a strong and wide market competition, with substitute products coming from players that operate in completely different segments.
Looking at Toy’s industry, it is led by Mattel with 35.25% and 12.5% market share at domestic and international markets respectively, followed by Hasbro with 12.7% and 5.68%. Operating as retailers, this market had over 145,000 in 2019. As for the video game console market, it is noticeable how innovation plays a decisive factor for companies to succeed, with a short life-cycle for innovations. This market is highly dominated by Sony Interactive Media Entertainment (PlayStation), Nintendo and Microsoft (Xbox) (figure 48). Amazon is the top global retailer in all markets that Disney operates with a market share of 17%., of which 59% comes from domestic sales and 41% from international.
Disney’s Consumer Products and Interactive Media Segment:
The consumer products sector is the smallest business unit of Disney since it is a sector that is highly dependent on the other segments' performance. This business unit focus on producing and selling Toys, Video-Games and books through Disney stores, licensing and retailers.
In 2019 it represented 6.5% of Disney’s total revenue with the highest EBIT
margin for Disney’s segments (38%). This level of margin has been increasing
each year, mainly because of administrative cost optimization (figure 49).
Additionally, the Consumer Products segment presented a CAGR of revenues of -2.6% for the last 5 years, but a ROIC of 17% in 2019, higher than the WACC
6.9%30, meaning it created value in 2019. This means that Disney is focusing its
resources on cost optimization rather than increasing revenues, a mindset we expect them to swap in future periods. As observed in the previous segments, Disney has significantly increased its Invested Capital due to new service/product development and long-term investments. Despite this, on the Consumer Products, we analysed an opposite movement, with a lower percentage of invested capital injected in this segment, year after year (Figure 50). In 2019 the segment represented only 5.3% of the total invested capital, coming from an
investment of $8,487 billion in the year in question. From a cost perspective,
consumer products and interactive media have a continuous investment in their branded stores, production of merchandise, toys and video games and storage facilities. It is also continuously investing in new product development related to the movies released. These operating expenses have shown to fluctuate as a percentage of revenue between 45% to 39% and we forecasted them to close this interval between 40% and 43.5% due to past cost optimization approach
(fig.51). Disney developed standardized contractual procedures for companies
30 From Bloomberg at 17/11/2019 Figure 48- Source: WePC
Figure 49-Source: Disney’s Annual
Report
Figure 50-Source: Disney’s Annual
Report
Figure 51-Sources: Nova SBE Equity
“DISNEY CO.” COMPANY REPORT
that want to license their brands and products, resulting in reductions in selling and administrative costs on the previous year. Now, with the acquisition of Fox,
we expected these costs to rise again because Disney’s portfolio increased with
21CF brands. We forecasted that this increase in Disney’s Brand Equity will take these operational expenses to a rate of 19% on total revenues for consumer products. We forecasted ROIC to remain in approximate levels until 2026 of 18%. It is also expected a CAGR for the core result of 2.31% (0.08% in real terms), as a result of revenues’ increase.
Licensing, Publishing, and Games:
When looking at the Consumer Products and Interactive Media sector, as said before, Disney not only produces, but it also licenses its brands to other Toy, merchandising and game development companies which leads to thousands of Disney products being currently commercialized worldwide, making it impossible to estimate the number of current products on the market and of future products on the market. We were also able to examine from the annual report that the main reasons for the performance of this sector were due to the performance of merchandise related to movies (which is directly related to the Studio Entertainment performance) and from the performance of the retail chains in promoting and commercializing Disney products. For forecasting purposes, we studied the markets where Disney presents business units and how they are expected to grow in the future. We look at the Retail industry, the Toy industry, and the gaming industry and recall data from past and future growth rates of these markets. With these data we calculated the correlation of Disney’s past growth on this sector (figure 52), with the past performances of these businesses and reach four main factors that could explain Disney’s performance: The Global Unit Sales of Current Generation Video Game Console, the value of physical console games, U.S. Toy market value and U.S Exported Toys. Taking future expectations on these indicators, we forecasted a CAGR for the Licensing, Publishing, and Gamming of 1.22% (figure 53).
Retail:
The Retail segment is increasing its weight on Disney’s sales, year-after-year. In 2019 it represented 34% of Disney’s total revenue in this segment, while in 2014
only 31%. We expect this to keep increasing and we forecast the sales’
percentage to grow at an average rate of 2.6% until 2026 where it reaches 40.6% of total revenues. We also expect Disney’s retail for consumer products to grow based on the market analysis presented for Licensing, Publishing, and Gamming. Having this in mind, it is expected that this business unit will have a CAGR of 4.68% until 2026 (2.25% in real terms) (figure 54).
▪ Valuation
P value
Global Unit Sales of Current Generation Video Game
Console 0.122
Physical console games 0.063 U.S. Toy market value 0.091
U.S Exported Toys 0.136
Figure 52-Source: Nova SBE Equity
Research
Figure 53-Source: Nova SBE Equity
Research
Figure 54-Source: Nova SBE Equity
“DISNEY CO.” COMPANY REPORT
The expected growth rate for this segment (2.37%) was the result of multiplying the RONIC (30%) by the RR on new capital (8%) and the estimated Enterprise Value for this segment was $29,639 million. On top of these, it was conducted a sensitivity analysis between the RONIC and the RR in order to measure the impact on the growth rate of 1% error and it was estimated an interval between [2%,2.76%]. Moreover, it was conducted a sensitivity analysis between g and the WACC where the interval for the EV was estimated between [24,601;39,099].
Direct-to-consumer & International
Market overview
Direct-to-consumer and Cable International Channels segment
The Streaming market has been growing at an accelerated rate presenting a nominal growth rate of 31% from 2018 to 2019 and it is expected to reach a global revenue level of $87 billion by 2024 (figure 56) with many global
subscribers of 947 million31. Currently, 56% of American consumer of streaming
platforms have more than one subscribed service32 and this trend is expected to
continue rising due to an increase in competition offering new services with exclusive content. For the International Channels segment, the Chinese and Indian markets are expected to present a nominal CAGR from 2019 until 2023 of 2% and 11% respectively. However, the European market is expected to present a nominal CAGR for the same period of -1%. (figure57)
Market competition
There are several different competitors in this market. Currently, Netflix owns 23% of global SVOD’s subscribers and is one of the biggest contributors to cord-cutting, due to the quality and diversity of content at an affordable price which leads to consumers' migration from traditional TV services to streaming platforms. Thanks to the rapid growth of this market mature companies like Amazon, Apple, Disney and other broadcast companies like ViacomCBS and Comcast entered this segment. In 2019 Amazon Prime Video was the service with a wider range of content. Nonetheless, Netflix is the one that has the content
with more quality according to market perspectives33. However, Amazon will be
able to keep up with competition like Netflix due to the affordable prices charged for high video quality and due to the Student’s discounts, that gives an advantage over its competitors (figure 58). During FY2019 ComcastCBS integrated this market with the streaming service BET+ with 2 original series and 1 film. During
the FY2020 Apple TV+ and Disney+ joined the market with $6 billion34 and $1
billion35 on the original content’s budget. Additionally, the competition from this
31 Statista: https://www.statista.com/statistics/949391/svod-subscribers-world/ 32 https://today.yougov.com/topics/media/articles-reports/2019/10/30/how-many-streaming-services-are-americans-willing-33https://www.digitaltrends.com/home-theater/best-on-demand-streaming-services/ 34 https://9to5mac.com/2019/08/19/apple-original-content-spending/ 35 https://www.slashfilm.com/disney-plus-costs/
Figure 55- Source: Nova SBE Equity
Research
Sensitivity analysis between RONIC and RR
2.37% 28.62% 29.62% 30.62%
7.00% 2.00% 2.07% 2.14%
8.00% 2.29% 2.37% 2.45%
9.00% 2.58% 2.67% 2.76%
Sensitivity analysis with g and wacc 29,636
$ 2.00% 2.37% 2.76%
6% $ 33,532 $ 35,953 $ 39,099 7% $ 28,169 $ 29,639 $ 31,463 8% $ 24,601 $ 25,576 $ 26,750
Figure 56-Source: Statista
Figure 57-Source: PWC Media Outlook and
Statista
Figure 58-Source: Statista
Price Video Quality
Netflix Basic $ 9.00 Low Standard $ 13.00 Medium Premium $ 16.00 High Amazon Prime standard $ 12.99 High