RELATIONSHIPS BETWEEN CLIMATE INDICES,
PHENOLOGY AND BERRY COMPOSITION OF TOURIGA
NACIONAL IN THE DÃO WINE REGION
Peter Melville Birks
Dissertação para obtenção do Grau de Mestre em
Vinifera EuroMaster – European Master of Sciences of Viticulture
and Oenology
Júri:
Presidente: Olga Maria Carrasqueira Laureano, Investigadora Coordenadora do Instituto Superior de Agronomia da Universidade Técnica de Lisboa.
Vogais:- Doutora Pilar Baeza Trujillo, Professora da Universidad Politécnica de Madrid.
- Doutor Carlos Manuel Antunes Lopes, Professor Associado do Instituto Superior de Agronomia da Universidade Técnica de Lisboa.
Acknowledgements
I would like to express my sincere gratitude and appreciation to:
• Professor Carlos Lopes of the Department of Sciences and Engineering of Biosystems (DCEB) of ISA, UTL, for his help and patience on the supervising of this thesis.
• The Centro de Estudos Vitivinicolas do Dão for providing the Touriga Nacional data and all the team of the research project SIAMVITI (Portuguese Foundation for Science and Technology funded project: PTDC/AAC-AMB/105024/2008) for having invited me to work with them.
Abstract
Despite the expansion and increasing popularity of Touriga Nacional in Portugal, there has not been extensive research into the variety’s response to different climate characteristics. The objective of this research was to test the relationships between different climate indices and berry composition and Phenology in Touriga Nacional in the Dão winegrowing region of Portugal. From the available data we can also explore any evolution of the climate, berry composition and phenology during the recorded years.
Climate and plant data were analysed from records collected at the ‘Centro de Estudos Vitivinícolas do Dão’ in the Dão wine region of northern Portugal between 1963-2010. Six common climate indices were calculated from the climate data for each year of the recorded period. Berry composition and phenology records of Touriga Nacional planted at the research centre from the same period were also analysed. Any trends or changes in climate or plant data were analysed over the recorded period. All climate indices were correlated against the plant data results to investigate any relationships.
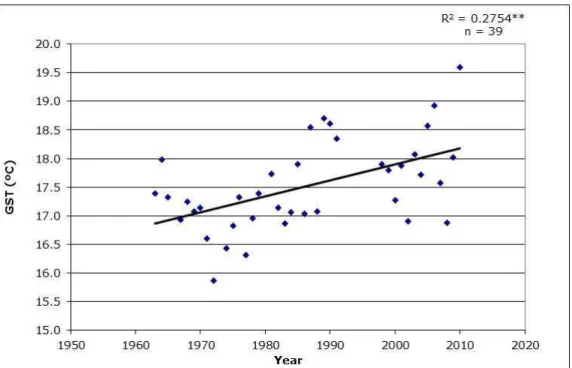
An increase in the Growing Season Temperature Index (GST) during the studied period was observed that agreed with studies over a similar period in other parts of Europe. Various climate indices had some correlations with grape and vine parameters; generally acidity showed a reduction with increases in temperature-based indices. Budburst and harvest dates were confirmed to be hastened by higher temperatures. Also yield had a positive correlation with the Huglin Index (HI). HI had a better correlation with plant parameters because it is calculated over a 6-month (instead of 7-month) period.
Understanding the relationship between Touriga Nacional and climate indices can help producers maximise the potential of this important Portuguese variety, as well as aid its expansion into other Portuguese regions and other regions throughout the world.
Resumo
Apesar da expansão e popularidade crescente de Touriga Nacional em Portugal, não foi efectuada ainda uma extensa pesquisa relativamente à resposta da casta a diferentes condições climáticas. O objetivo deste trabalho foi testar as relações entre os índices bioclimáticos, a fenologia e a composição da uva da casta Touriga Nacional na região vitícola do Dão, Portugal. A partir dos dados disponíveis pretende-se ainda estudar a evolução do clima, da fenologia e da composição da uva ao longo de várias anos.
Os dados de clima e planta foram analisadas a partir de dados colhidos no periodo 1963-2010 no ‘Centro de Estudos Vitivinícolas do Dão’, em Nelas, na região viticola do Dão, Portugal. Seis índices bioclimáticos foram calculados a partir dos dados climáticos em cada ano do periodo considerado. No mesmo período foram analisados as principais datas fenológicas e a composição da uva á vindima. Os índices bioclimáticos foram correlacionados com a composição da uva à vindima. Verificou-se um aumento do índice GST (Growing Season Temperature) ao longo do período estudado o que está de acordo com estudos efectuados noutras regiões da Europa. Verificou-se que diversos índices bioclimáticos se apresentaram correlacionados com os dados da maturação. Em geral a acidez total apresentou uma relação negativa com os índices baseados na temperatura. As datas de abrolhamento e vindima foram antecipadas em situações de elevadas temperaturas. O rendimento também apresentou uma correlação positiva com o Índice de Huglin.
O conhecimento das relações entre os índices bioclimáticos e o comportamento da casta Touriga Nacional permitirá maximizar o potencial desta importante casta portuguesa, bem como, ajudar à sua expansão para outras regiões do Mundo.
Contents
Acknowledgements……….. a Abstract (English)………. b Abstract (Português)……… c
Contents……….… i
List of Figures……… iii
List of Tables………. v
List of Equations………vii
1. Introduction………. 1
1.1 Climate and the grapevine………. 1
1.1.1 Climate……… 2
1.1.2 Overview of vine physiology in a viticultural season……… 4
1.2 Phenological Events……….. 5 1.2.1 Budburst……….. 5 1.2.2 Flowering……… 6 1.2.3 Post-setting to Veraison………. 7 1.2.4 Veraison to Harvest………. 8 1.3 Berry Development……… 9 1.3.1 Sugar accumulation………. 9 1.3.2 Acidity……….…….10
1.4 Wine and Must Parameters……….…12
1.4.1 Titratable Acidity………12
1.4.2 pH……….12
1.4.3 Alcohol……….13
1.5 Climate Indices………13
1.5.2 Growing degree days (GDD)………15
1.5.3 Huglin Index (HI)……….16
1.5.4 Biologically effective degree-days (BEDD)………17
1.5.5 Cool night index (CI) ……….18
1.5.6 Dryness Index (DI) ……….18
1.6 Climate Change………...19
1.7 Dão Wine Region………20
1.8 Touriga Nacional……….23
2. Materials and Methods………..24
2.1 Touriga Nacional (Technical description)………...24
2.2 The Vineyard Site………24
2.3 Climate Data………25
2.4 Missing Data………25
2.5 Analysis of Data………..27
3. Results and Discussion……….28
3.1 Climate Variables………28
3.1.1 Evolution of Climate Indices……….……28
3.1.2 Growing Season Temperature-derived Indices……….28
3.2 Phenology, Yield And Berry Composition………...34
3.2.1 Phenology...34
3.2.2 Yield and Berry Composition... 37
3.3 Relationships between climate indices and agronomic variables...…… 42
4. Conclusion………...52
5. References………..54
List of Figures
Figure 1. Diagram showing relative size and colour of berries at 10-day intervals after flowering, passing through major developmental events (rounded boxes). Also shown are the periods when compounds accumulate, the levels of juice ºbrix, and an indication of the rate of inflow of xylem and phloem vascular saps into the berry. Illustration by Jordan Koutroumanidis,
Winetitles……… 11
Figure 2. Monthly averages of observed values from 1971 to 2000 a) Average monthly temperatures b) Average monthly precipitation levels.
(www.meteo.pt)……… Figure 3. Evolution of Growing Season Temperature (GST) over 39 years between
1963-2010……… 29
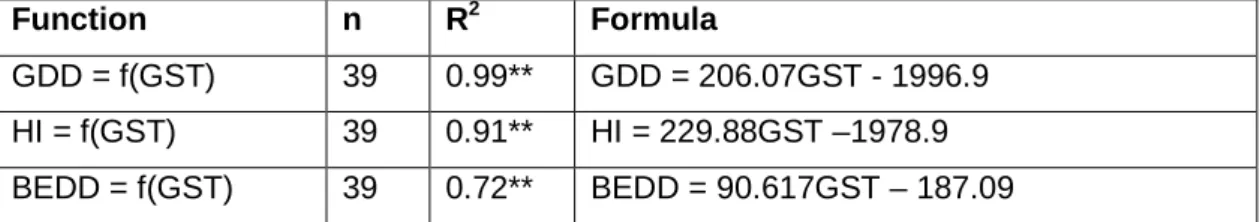
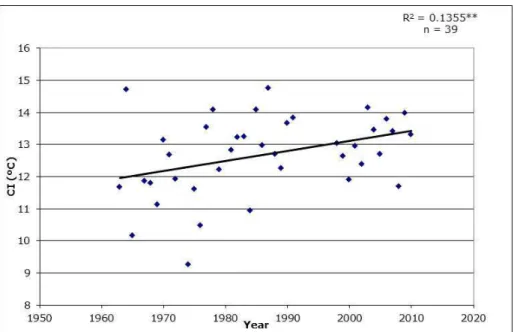
Figure 4. Relationships between different growing season temperature based climate indices. a) Linear relationship between Growing Degree Days (GDD) and Growing Season Temperature (GST). b) Linear Relationship between Huglin Index (HI) plotted against Growing Season Temperature (GST). c) Linear Relationship between Biologically Effective Degree Days (BEDD) against Growing Season Temperature (GST)... 31 Figure 5. Evolution of Cool Night Index (CI) (Tonietto, 1999) over 39 years between
1963-2010..………... 32 Figure 6. Evolution of the estimated soil water at the end of each viticultural season
(considering 200mm as the available soil water reserves at budburst) over 39 years between 1963-2010... 33 Figure 7. Annual dates of the main phenological events between 1961-2010; budburst
dates, flowering dates, veraison dates, harvest dates……… …………. 35 Figure 8. Relationship between budburst date (independent value) and harvest date (dependent value)... 36 Figure 9. a) Potential alcohol (% v/v) plotted against year (1961-2010).
b) Potential alcohol (% v/v) plotted against year (1961-1987).
c) Potential alcohol (% v/v) plotted against year (1995-2010)... 38
Figure 10. Potential alcohol (% v/v) per year for different rootstocks in vineyard plot ‘folha 3’ – 110R, 161-49, 3309C, 420A, 99R... 39
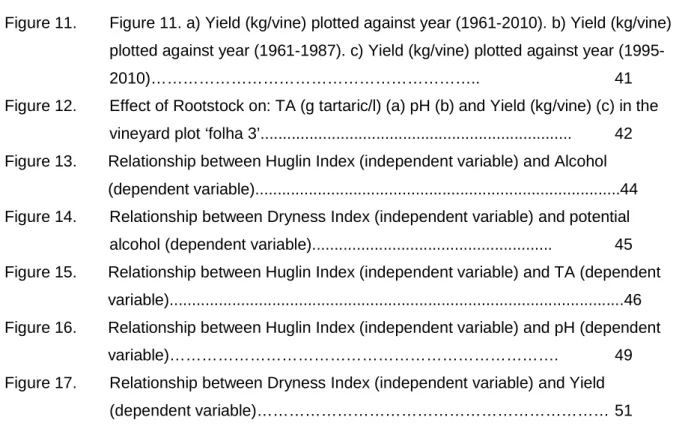
Figure 11. Figure 11. a) Yield (kg/vine) plotted against year (1961-2010). b) Yield (kg/vine) plotted against year (1961-1987). c) Yield (kg/vine) plotted against year
(1995-2010)……….. 41
Figure 12. Effect of Rootstock on: TA (g tartaric/l) (a) pH (b) and Yield (kg/vine) (c) in the vineyard plot ‘folha 3’... 42 Figure 13. Relationship between Huglin Index (independent variable) and Alcohol
(dependent variable)...44 Figure 14. Relationship between Dryness Index (independent variable) and potential
alcohol (dependent variable)... 45 Figure 15. Relationship between Huglin Index (independent variable) and TA (dependent
variable)...46 Figure 16. Relationship between Huglin Index (independent variable) and pH (dependent
variable)………. 49
Figure 17. Relationship between Dryness Index (independent variable) and Yield (dependent variable)……… 51
List of Tables
Table 1. Growing Season Temperature class limits taken from Hall and Jones
(2010)...15
Table 2. GDD limits defined by Winkler (1974)... 16
Table 3. Huglin Index climate class limits (Hall and Jones, 2010)... 17
Table 4. Too cool and too hot class limits for viticulture (Jones and Hall, 2010)... 18
Table 5. Main vine varieties grown in the Nelas area, used to create wines with DO ‘Dão’ status. (IVV, 2011)... 21
Table 6. Sample Size, coefficient of determination (R2) and formula for each model describing relationships between the different indices. Growing Degree Days, Huglin Index and Biologically Effective Degree Days (dependent variables) with Growing Season Temperature (independent variable)... 30
Table 7. Sample size, coefficient of determination (R2) and formula for each model describing relationships between annual values of each climate index; Growing Season Temperature, Growing Degree Days, Huglin Index, Biologically Effective Degree Days, Cool night Index, Dryness Index (dependent variables) and year (independent variable)... 33
Table 8. Degrees of freedom, coefficient of determination (R2) and formula for each model describing linear relationships between annual Phenological dates (Julian day) (dependent variable) and year (independent variable). NS indicates trends that are not significant and *, **, and *** indicate significance at the 0.05, 0.01 and 0.005 levels respectively...36
Table 9. Relationships between different berry composition parameters; potential alcohol (%v/v), TA (g tartaric/l), pH and yield (kg/vine) (dependent variables) and the years of recorded data (independent variable). NS indicates trends that are not significant and *, **, and *** indicate significance at the 0.05, 0.01 and 0.005 levels respectively... ……….40 Table 10. Sample size (n), coefficient of determination (R2) and formula for each model
describing relationships between Alcohol (%v/v) (dependent variable) and different indices (independent variables): Growing Season Temperature (GST), Growing Degree Days (GDD), Biologically Effective Degree Days (BEDD), Huglin Index (HI), Cool Night Index (CI) and Dryness Index (DI). NS indicates trends that are not
significant and *, **, and *** indicate significance at the 0.05, 0.01 and 0.005 levels respectively...43
Table 11. Relationships between Titratable Acidity (TA) (g of tartaric acid/l) (dependent variable) and different climate indices (independent variables): Growing Season Temperature (GST), Growing Degree Days (GDD), Biologically Effective Degree Days (BEDD), Huglin Index (HI), Cool Night Index (CI) and Dryness Index (DI). Sample size (n), coefficient of determination (R2) and formula for each model describing the relationship. NS indicates trends that are not significant and *, **, and *** indicate significance at the 0.05, 0.01 and 0.005 levels respectively...46
Table 12. Relationships between Titratable Acidity (TA) (g tartaric acid/l) (dependent variable) and different indices with adjusted growing season length (independent variables): Growing Season Temperature (GST, months), Growing Degree Days (GDD, 6-months), Biologically Effective Degree Days (BEDD, 6-6-months), Huglin Index (HI, 7-months). Sample size (n), coefficient of determination (R2) and formula for each model describing the relationship. NS indicates trends that are not significant and *, **, and *** indicate significance at the 0.05, 0.01 and 0.005 levels respectively...48
Table 13. Relationships between pH (dependent variable) and different indices (independent variables): Growing Season Temperature (GST), Growing Degree Days (GDD), Biologically Effective Degree Days (BEDD), Huglin Index (HI), Cool Night Index (CI) and Dryness Index (DI). Sample size (n), coefficient of determination (R2) and formula for each model describing the relationship. NS indicates trends that are not significant and *, **, and *** indicate significance at the 0.05, 0.01 and 0.005 levels respectively...48
Table 14. Relationships between Yield (kg/vine) (dependent variable) and different indices (independent variables): Growing Season Temperature (GST), Growing Degree Days (GDD), Biologically Effective Degree Days (BEDD), Huglin Index (HI), Cool Night Index (CI) and Dryness Index (DI). Sample size (n), coefficient of determination (R2) and formula for each model describing the relationship. NS indicates trends that are not significant and *, **, and *** indicate significance at the 0.05, 0.01 and 0.005 levels respectively...50
List of Equations
Equation 1……… 12 Equation 2……… 14 Equation 3……… 15 Equation 4………16 Equation 5………17 Equation 6………17 Equation 7………18 Equation 8………18 Equation 9………18 Equation 10………..19 Equation 11………...19 Equation 12………19 Equation 13……….191.
Introduction
Touriga Nacional is one of, if not the most important grape varieties in Portugal today. Due to its increasing importance in the wine industry in Portugal and throughout the world it is becoming more and more widely planted. Touriga Nacional was traditionally planted mainly in the Portuguese wine regions of Douro and Dão in the North of the country. There has been little research conducted on the suitability of this variety in various geographical and climatic zones, especially when compared to famous international varieties such as Cabernet Sauvignon, Merlot and Chardonnay (Bohm 2007).
Wine regions worldwide are typically classified in climate-terms using a number of different climate indices, created by several different researchers. Six of the more common climate indices include Growing Season Temperature (GST), Growing Degree Days (GDD), Biologically Effective Degree Days (BEDD), Huglin Index (HI), Cool Night Index (CI) and Dryness Index (DI) (Hall and Jones 2010).
Despite the expansion and increasing popularity of Touriga Nacional in Portugal, there has not been extensive research into the variety’s response to different climate characteristics.
The objective of this research was to test the relationships between different climate indices and berry composition and Phenology in Touriga Nacional in the Dão winegrowing region of Portugal. From the available data we can also explore any evolution of the climate, berry composition and phenology during the recorded years. This research is part of a Portuguese research project on climate changes entitled "SIAMVITI - Climate change in Viticulture: Scenarios, Impacts and Adaptation Measures" funded by the Portuguese Foundation for Science and Technology (Proj. PTDC/AAC-AMB/105024/2008).
1.1 Climate and the grapevine
There are many factors which affect the growth of the grapevine of the Vitis vinifera cultivar and its production of wine grapes. Exterior conditions such as rainfall, wind, sunlight, temperature, soil type, nutrient availability, cultural practices, pests and diseases vary greatly across vine growing regions and countries throughout the world.
These external conditions can have varying effects on wine grape quality and yield. These effects are also dependent on the great variation of internal attributes of a grapevine, such as variety, rootstock and the susceptibility of the plant to pests and diseases.
With such a combination of factors to consider, the grape vine and its main products; grapes and wine, are part of a complicated and diverse system.
When considering the commercial production of wine from grapes, it is necessary to take into account these various and complicated parameters, in order to best meet the requirements of a project in any given location.
1.1.1 Climate
The term ‘climate’ encompasses several important external influences on the grapevine. Climate can be defined as ‘the composite or generally prevailing weather conditions of a region, as temperature, air pressure, humidity, precipitation, sunshine, cloudiness, and winds, throughout the year, averaged over a series of years’ as found on the online dictionary (www.dictionary.com).
The effects of climate on viticulture can be separated into temperature, rainfall, sunlight, wind and humidity. These different components can result in varying responses from a grapevine which are being continually studied to aid in the production of quality grapes. Temperature is the most important factor for vegetative growth and berry maturation. Prescot (1965), when describing areas suitable for grape production reported: ‘the mean temperature of the warmest monthly period must be in excess of 19ºC and that of the coldest monthly period must be in excess of 1ºC.’ Although this is not a strict rule, it is however suggesting that grapes are native to the warm temperate zone. Phenology describes the processes and timing of a vine’s development through dormancy, budburst, flowering, setting, veraison and ripening. The evidence is now clear that vine phenology is controlled by temperature alone (Coombe and Dry 2004). Vines require a dormant period during winter which is initiated when mean temperatures are consistently less than 10ºC. Grapevines can suffer damage during dormancy if exposed to temperatures below –15ºC, and can die below –20ºC (Winkler, 1962). During the vegetative period, warm temperatures promote the growth of shoots and leaves, warmer soils promote root growth which also favours leaf area development. Vine phenological
processes respond more or less linearly from a mean temperature of about 10ºC (below which no growth occurs) to perhaps 16-17ºC, after which the response slows. A large canopy of leaves can provide more potential for photosynthesis, which is also more rapid in warm temperatures. Photosynthesis is vital for vine and berry development, and will determine the ripening of grapes and harvesting time. Warmer temperatures around flowering has proven to provide a greater fruit-set, resulting in higher grape yields. In hotter regions, when water is in short supply and temperatures exceed 35ºC the stomata in the leaves may close in order to prevent further loss of water, in turn photosynthesis is arrested and berry maturity is retarded. This is also dependent on the available water, which we will discuss next. High temperatures can also result in sunburn on berries. Rainfall is important to replenish soil water. The roots of the vine take up the water via the xylem vessels to the leaves to take part in transpiration and photosynthesis. Photosynthesis will produce carbohydrates for the development of structural and chemical components of the vine and grape berries. When temperatures are high, the cooling effect provided by transpiration keeps the leaves from drying as the water evaporates from the stomata. These are the principle functions that makes rain important for the wellbeing of the grapevine. If rain occurs in excess it can promote favourable conditions for fungal diseases such as downy mildew and botrytis. If the vine is very vigorous, that is, it has many shoots and leaves it will also provide still, humid conditions for fungi and rot. If there is insufficient rain, the vine can suffer water stress. With severe water stress vines will shut down, photosynthesis stops and leaves will senesce. Depending on the time of the season heat stress can affect flowering, berry growth, photosynthesis and sugar accumulation (Greer and Weston, 2009).
Light intensity has a positive correlation with sugar accumulation until a point of saturation, where further increase in light will have no effect (Spayd et al., 2002). Although light is related to temperature, for certain functions it plays an exclusive role. Light always has a positive effect on polyphenol production (Spayd et al., 2002). Light can also have some effect on sunburn necrosis of berries (Genovese et al., 2010). Wind can cause damage to young shoots, as well as destroying inflorescence before fruit-set when too strong. Mild winds can help reduce the risk of fungal disease and frost damage. Wind also has various influences on temperature.
The various climate factors; Temperature, rainfall, hail, wind, and sunlight have different effects on the grapevine and how it could affect wine grape quality.
1.1.2 Overview of vine physiology in a viticultural season
The ripening of the berry is the final physiological process in a series of important biochemical transformations. Although the climate during the ripening period plays an important role. The weather for the whole annual vine cycle has various effects on berry composition. It is important to consider the main phenological stages and how different weather factors can affect them (Riou et al. 1994).
The identification of growth stages is critical to the study of grapevine phenology. For this reason, there have been several descriptive systems developed, such as those by Baggiolini (1952, 1993), Eichhorn and Lorenz (1977), Lorenz et al. (1994), Coombe (1995). However the important general phenological stages are Budburst, Flowering/ Fruit-set, Veraison and harvest.
During winter, buds remain dormant. No growth occurs in the vine and canes are generally pruned back to limit the number of buds per vine. At the end of winter/beginning of spring buds progress from post-dormancy, they begin to swell and leaf tissue emerges. As the buds swell inflorescence primordia growth resumes with further branching, branch elongation and flower formation (May 2000, May 2004). The shoots begin shooting slowly followed by the ‘grand period of growth’ towards the end of spring that results in a massive growth of vegetative tissues (Coombe et al. 2004). The inflorescences become visible some weeks after budburst. The flowers are clumped into compact groups, before they develop further and separate.
Cap-fall follows, this is when the caps on the flowers loosen as the base of the petals detach and roll backwards. The caps then are released and the stamens are freed, and the flower is more recognisable, this is termed flowering. Pollination of the flower occurs after this. Vitis Vinifera have hermaphrodite flowers, thus they can self-fertilise. The pollen from the male part (stamens) is released into the female part (pistil) to begin the pollen development. When the ovule is fertilised, the stamens will fall and it will develop into a berry. This stage is termed fruitset. Fruitset is in addition a process that quantitatively determines how many of the ovaries become berries (May, 2004).
Berry development occurs after fruitset as the weather generally becomes warmer and is divided into two growth stages, which are separated by a lag phase. The first stage, berry formation, involves an increase in the size of the hard green berries, through cell
division and enlargement. After this is the lag phase where little berry growth occurs and berries reach their highest levels of acidity. Veraison comes next, this is where the berries soften and begin sugar accumulation, veraison is also where red grapes undergo colour change from green to red. Some white varieties also undergo subtle colour changes.
During summer, after the berries have reached the veraison stage, shoot growth slows and eventually the shoot tips abscise, causing shoot lengthening to cease. It is this stage that the latent buds enter a pre-dormant state.
Berries continue to undergo sugar accumulation and flavour development as well as a reduction in organic acids up until the time of harvest that occurs between one to two months after veraison.
Shoots start to lignify in Autumn and some basal leaves are lost. Latent buds enter dormancy completely during this stage. The leaves will fall as winter approaches and the latent buds remain dormant until the following spring, when they will burst.
1.2 Phenological Events
1.2.1 Budburst
There is evidence that temperatures during the latter part of winter influence the budburst date. It is shown in both cases, whether calculated as daily maximum (Antcliff et al. 1955; Baldwin, 1966; McIntyre et al., 1982) or as daily means (Alleweldt and Hofäcker, 1975; Pouget 1967) that higher temperatures hasten the budburst date. The minimum temperatures during the 10 days prior to budburst accounted to some extent for variation in budburst dates and to a greater extent the average maximum temperature between 1 August and 10 days prior to budburst (Southern Hemisphere) (Due et al., 1993).
The onset of budburst is earlier when soil temperatures at 0.2m depth are warmer (Alleweldt and Hofäcker, 1975). In another study in Germany, growth appeared to start only when soil temperature at a depth of 0.2m exceeded 8ºC, even when air temperatures exceeded 15ºC (Wolfart et al., 1988). This is not conclusive in all areas, for example Blaha (1969) questioned whether the small differences encountered in soil temperature could have important effects on budburst. It could be that soil temperature
was more significant in Germany as the winter temperatures are much more extreme and limiting than more temperate Mediterranean zones.
Grape varieties differ in their timing of budburst, with late-bursting varieties requiring higher temperatures to break dormancy. All budburst in warm, maritime climates is at temperatures above those absolutely needed, but varietal differences in timing appear largely preserved (Coombe et al. 2004).
1.2.2 Flowering
Flowering time is crucial for vine fruitfulness and yield. Flowering coincides in part with bud formation for the next season’s cropping shoots, including the primordia of the bunches they will carry (Coombe et al. 2004). There is ample evidence that temperatures during individual bud formation influence their fruitfulness the following season, i.e. the proportion of the shoots developed from them carrying bunches and the number of bunches on each (Baldwin 1965, Buttrose 1970,1974, Sommer et al. 2000, MacGregor 2002). Some evidence (Dunn and Martin 2000) suggests a further influence on bunch size. Fruitfulness and large bunch size result from warmth during bud formation and an ample supply of cytokinins from warm, well aerated roots. High temperatures (25ºC, Pouget 1981 or 28ºC, Ezzeli 1993) have been shown to have a reduction in the number of flowers produced when compared to vines exposed to 12ºC. Grape varieties differ greatly in their fruitfulness and the temperatures during bud initiation needed to achieve it (Buttrose 1970).
Weather around fruit set in the current season also has an important influence on yield. Poor fruit set is generally attributed to weather conditions. Vines need warmth and sunshine during and around flowering for best fruit set. Wet, cold and cloudy weather results (to varying degrees according to grape variety) in either or both of two conditions: poor set or coulure, where many of the berries fall off when small, and ‘hen and chicken’ or millerandage, in which small, seedless berries or berries with incompletely formed seeds accompany normally-seeded larger berries on the same bunch (Coombe, 1988). Coulure appears to be caused by lack of assimilate within the bunch, often from competition by vigorous growth under ample water and nitrogen supply as well as low sunshine. Millerandage, by contrast, results directly from low air temperature just before
and during flowering. This interferes with ovule development and pollen function, and with normal development of the resulting seeds and hence berries (Ebadi et al. 1996). Most cell divisions of a grape’s fleshy tissue (pericarp) occur before flowering, with just one to two more generations in the three weeks or so after (Coombe, 1976) during which the berries are sensitive to environmental stresses. High temperatures (Hale and Buttrose 1974) and water stress (McCarthy, 2000) at this time both irrevocably reduce potential for final berry size. Ojeda et al. (2001) present evidence that this is due to reduced extensibility of the newly forming cell walls, rather than to curtailment of the final cell divisions.
1.2.3 Post setting to Veraison
After the fruit set, the berries of grapes enlarge very rapidly. Before Veraison, berries proceed through two periods. The first stage of berry growth is rapid, the pericarp and seed increase in size and weight while the embryos remain small (Winkler, 1962). In the pericarp there is a period of rapid cell division lasting 3 to 4 weeks after anthesis, which is followed by rapid cell enlargement (Harris et al., 1968). The berries remain green and firm and are characterized by rapid acid accumulation, a high rate of respiration and a respiratory quotient value of 1 or less. This period usually last 5 to 7 weeks in most grape varieties.
In the second period the overall growth rate of the berry has slowed down, in this stage the seeds develop but the berries remain small and hard. The berries reach their highest level of acidity and begin to accumulate sugar during this period. The berries lose their chlorophyll and begin to undergo a colour change. This period generally lasts 2 to 4 weeks (Winkler, 1968).
Environment and management can also influence the duration of this stage. Both low and especially very high temperatures tend to prolong the second stage (Hale and Buttrose 1974), as do a heavy crop load or factors leading to it. During this stage the berries and vine are very tolerant to heat and water stress.
Unfortunately records of veraison date are rather rare and subject to uncertainty because of differences between recorders in the method of its determination (Coombe, 2004).
Previous recordings suggest that veraison dates are not as focused as are dates of flowering. Season-to-season comparisons of juice ºBrix curves extrapolated back in time suggest that veraison date greatly influences harvest date (Coombe and Iland 1987).
1.2.4 Veraison to Harvest
As with most stages of grapevine phenology, temperature again is a major factor influencing grape ripening and harvest dates. Harvest dates are less clear-cut phenological indicators because the timing is decided by humans. Therefore, adaption for different end-uses, eg. wine-style, can alter the timing of harvest. Within regions where varieties are used for more uniform styles of wine from year to year, harvest dates can still be considered important in terms of phenological records.
Some results from research between the effects of temperature functions and harvest dates from Coombe (2004) are summarized as follows:
• mean January (southern hemisphere) temperature correlated with the harvest date of 4 varieties (Smart, 1979)
• mean November-December (southern hemisphere) temperatures predicted veraison date and hence harvest date of Grenache in 4 years (Coombe and Iland, 1987);
• temperature predicted harvest date for late varieties but not for early varieties;
• cumulative daily air temperature difference was the most reliable predictor of the interval flowering to harvest (McIntyre, 1982);
• the greater the number of days above 25ºC and 30ºC for the intervals flowering to veraison and veraison to harvest, respectively , the earlier the harvest (Jones and Davis 2000);
• variety, year and region accounted for 57% of the variation in harvest date; the inclusion of the minimum temperatures for the epochs, (1) 1 January to 11 of January prior to harvest, (2) 10 days prior to harvest and (3) flowering to harvest, and the maximum temperature 10 days prior to harvest, accounted for a further 32% of the variation in harvest date (Due et al. 1993).
Grape composition and the concentration and balance between sugars and acids are fundamental indicators for harvesting times. To better understand the climates influence
on harvest times, sugar and acid development needs to be considered with berry ripening.
1.3 Berry Development
Berry Development is generally described by a double-sigmoidal growth pattern (see Fig. 1) (Kanellis and Roubelakis-Angelakis, 1996) characterised by three successive phases: Phase I is the green or herbaceous stage immediately after flowering. The berries are hard and green, and undergo a short period of cell division and cell enlargement resulting in rapid expansion of the berry (Kanellis and Roubelakis-Angelakis, 1996; Terrier et al., 2001). Characteristic of Stage I is the increase in vacuolar size of the grape berry cells due to the rapid storage of L-malic and L-tartaric acid (Fillion et al.,1999; Pratelli et al.,2002). Stage II comprises a short lag phase during which berry growth ceases and berry acidity reaches a maximum due to the continued accumulation of L-malic and L-tartaric acid. Following the lag phase, there is a second period of ‘berry growth’(Stage III). The entry into Stage III begins with the sudden onset of ripening or “véraison”, which generally starts between 6 to 8 weeks after flowering and lasts for 35 to 55 days depending on the grape cultivar (Coombe, 1992; Pratelli et al., 2002; Ribéreau-Gayon et al., 2000).
During the ripening period berry size increases significantly and the accumulation of sugar, aroma and flavour compounds occurs as well as anthocyanins in coloured varieties, at the same time acid levels decline.
1.3.1 Sugar accumulation
From the initiation of ripening until harvest (stage III), the berries become the primary sink for sucrose transported from the leaves as a result of photosynthesis. When sucrose reaches the berry it is separated into its constituent sugars glucose and fructose.
Along with berry enlargement is the termination of water flow into the berry via the xylem vessels (Coombe 2004). The supply of water and nutrients is then limited to the sugary sap of the phloem, obviously having a significant effect on berry composition. As the berries grow from this stage, sugar concentration shows a steady rise. Calculations of
sap flow rates based on rates of sugar input per berry, and the per cent sucrose estimated to be in such sap, show that the idea is sustainable provided allowance is made for the daily loss of water transpired through the skin of berries (Coombe and McCarthy, 1999). Higher temperatures around the ripening period can result in faster sugar accumulation leading to higher sugar levels at harvest and consequently higher alcohol levels in wine.
1.3.2 Acidity
The most prominent organic acids in grapes and wine are L-malic acid and tartaric acid (Boulton et al., 1996). Although L-malic and L-tartaric acids have similar chemical structures, they are synthesised from glucose via different metabolic pathways in grape berries. L-Malic acid is formed via glycolysis and the TCA cycle, while ascorbic acid is the principle intermediary product of L-tartaric acid biosynthesis. Slight differences in grape acidity among different grape varieties are usually found, affecting especially the ratio between L-tartaric acid and L-malic acid in different grape cultivars (Kliewer et al., 1967). L-Tartaric acid is usually present in grapes at average concentrations of 5 to 10 g/L (Ruffner, 1982), while mature grapes contain between 2 and 6.5 g/L L-malic acid (Boulton et al., 1996; Ribéreau-Gayon et al., 2000). Excessive amounts of malic acid (15 to 16 g/L) may be present in grapes harvested during exceptionally cold summers in the cool-climate viticultural regions of the world (Gallander, 1977). Although tartaric acid is often found at higher concentrations than L-malic acid and is the stronger acid of the two, its concentration is relatively constant. It is the fluctuating concentration of L-malic acid that usually poses problems to winemakers (Margalit, 1997).
In a particular year, a must’s total acidity and acid composition depend mainly on geography, soil conditions, and climate, including soil humidity and permeability, as well as rainfall patterns, and, above all, temperature. Temperature determines the respiration rate, i.e. the combustion of tartaric and, especially, malic acid in grape flesh cells. The predominance of malic acid in must from cool-climate vineyards is directly related to temperature, while malic acid is eliminated from grapes in hotter regions by combustion. The rate of respiration of L-malic acid is significantly slower in cold climates, resulting in “immature grapes” at harvesting, containing a high titratable acidity (TA) content and low pH.
acidity and even the acid composition of the grape juice during ripening. Leaf-thinning and trimming the vine shoots restrict biosynthesis and, above all, combustion, by reducing the greenhouse effect of the leaf canopy. Another way of controlling total acidity levels is by choosing the harvesting date (Ribéreau-Gayon et al., 2000).
Figure 1. Diagram showing relative size and colour of berries at 10-day intervals after
flowering, passing through major developmental events (rounded boxes). Also shown are the periods when compounds accumulate, the levels of juice ºbrix, and an indication of the rate of inflow of xylem and phloem vascular saps into the berry. Illustration by Jordan Koutroumanidis, Winetitles. (Kennedy 2002).
1.4 Wine and Must Parameters
1.4.1 Titratable Acidity
The titratable acidity is basically the total acidity in the must or wine, determined by neutralisation with a basic solution of sodium hydroxide of known normality.
The titratable acidity takes into account all types of acid i.e inorganic acids such as phosphoric acid, organic acids such as tartaric, malic, citric, succinic etc. as well as amino acids whose contribution to titratable acidity is not very well known.
Titratable acidity is usually measured in grams of tartaric acid per litre, although in France it is measured in grams of sulphuric acid per litre. As mentioned in the previous section (1.3.2), titratable acidity is likely to maintain higher values in grapes grown with a cooler ripening period. Because titratable acidiy is a measure of the total acidity, it generally has an inverse relationship with temperature, as higher temperatures increase the respiration rate of organic acids during berry ripening.
1.4.2 pH
pH is the measure of the concentration of hydrogen ions (H+) in a solution. Numerically it is the negative logarithm of that concentration expressed in moles per litre (M). Defined mathematically as negative log subscript ten of the concentration of hydronium ions in a solution (Nelson et al. 2005).
PH = -log10[H3O +
] (equation 1)
The importance of pH in must and wine is made more confusing because it is an abstract, theoretical measurement with no units. However it plays an important role in the microbiological properties of must and wine (Ribéreau-Gayon et al., 2000).
The total acid of a wine consists of two portions, the ‘free acid’ which is measured as pH and a ‘bound’ form. Only a small proportion of the total acid is present as ‘free acid’ (about 0.2-2%), but it is the latter form which is important to wine stability. Should the small amount of free acid be consumed, say be titrated with alkali, then some of the bound acid releases some more ‘free acid’ to restore roughly the same ratios of ‘free acid’ to ‘bound acid’ as existed previously. This action is known as buffering and acts to keep wine pH fairly stable (Birks et al., 1978). It is this buffer capacity of wine that makes it hard to relate directly with titratable acidity, and thus it’s relationship with temperature may also be less predictable. The pH of wine is usually between 3.0 and 4.0. White wines usually have lower pH values than red wines.
1.4.3 Alcohol
Besides water, ethanol (ethyl alcohol) is the most plentiful compound in wine. A wine’s strength is expressed in terms of alcohol content, or the percentage of alcohol by volume. As ethanol has a density of 0.79, a wine with an alcohol content of 10% vol contains 79 g/l of ethanol by weight. The alcoholic strength of wine is generally 100 g/l (12.6% vol), although it may exceptionally be as high as 136 g/l (e.g. an alcohol content of 16% vol).
Due to the low density of ethanol, dry wines, containing negligible amounts of sugar, have densities below that of water (1.00), ranging from 0.91 to 0.94. This value decreases as the alcohol content increases. Ethanol in wine is mainly produced by the alcoholic fermentation of sugar in must. As approximately 18 g/l of sugar is required to produce 1% vol of ethanol during alcoholic fermentation, grape must has to contain 180, 226 and 288 g/l of sugar to produce wines with 10, 12.6 and 16% ethanol by volume. The latter is considered to be the maximum ethanol content yeast can survive, although, under certain laboratory conditions, some strains have been found capable of resisting up to 18% vol. Some types of wine may, of course, have even higher alcoholic strengths, but this results from the addition of ethanol. Temperature can effect alcohol levels because higher temperatures around the ripening period can result in faster sugar accumulation leading to higher sugar levels at harvest and consequently higher alcohol levels in wine.
1.5 Climate Indices
Much work has gone into developing various climatic indices in order to better classify viticultural regions in terms of climate. The objective of this is to better understand the potential of current viticultural areas for varietal suitability, as well as having a tool to predict potential viticultural areas that are not yet planted. These indices can also be used with climate change models to predict future changes in viticultural areas (Hall and Jones, 2008).
There are many different climate indices, some of the more common ones include ‘Growing Season Temperature’ (GST), ‘Growing Degree Days’ (GDD), ‘Huglin Index’ (HI), ‘Biologically Effective Degree Days’ (BEDD), ‘Cool Night Index’ (CI) and ‘Dryness Index’ (DI). These Indices are then used to classify regions in terms of climate. The
classification of regions makes it easier to compare conditions between areas in different parts of the world.
Climate indices are developed using different indicators. Several indicators have been used to try and predict grape quality such as heat accumulation, length of the growing season, sunshine hours, rainfall, diurnal temperature range, evapotranspiration and humidity. There are numerous different climatic indices that focus on each, or several of such indicators, in an effort to better explain grapevine and grape development.
Temperature is widely accepted as being the primary climatic factor affecting the quality of viticultural production (Winkler et al.. 1974, Gladstones 2004). Because temperature is considered such an important indicator, most of the climate indices are temperature based. However, due to the relative simplicity of universal indices they are unable to take into account more complicated phenomena such as ‘terroir’ factors and cultural practices (Hall and Jones 2010).
Some site characteristics such as slope and aspect can change solar-radiation-loading at a particular site, also there are different cultural practices that evolve in regions to deal with hot or cool climate conditions.
1.5.1 Growing season temperature (GST)
Growing season temperature (GST) is the most simple of the temperature based climatic indices. GST is established by calculating the sum of the mean air temperature of all days between 1st April and 31st October (northern hemisphere) (Winkler et al. 1974). Mean daily air temperature is calculated as an average of the minimum and maximum daily temperatures. This may vary slightly from the average of a constantly recorded temperature (Hall and Jones 2010) which may skew results. The simplicity of GST, means that it is easy to understand and requires little data to be calculated. However because of its simplicity it doesn’t have any adjustments to emphasise parameters that may have more important effects on plant physiology, as do some of the more complex indices. Average GST =
∑
[
+]
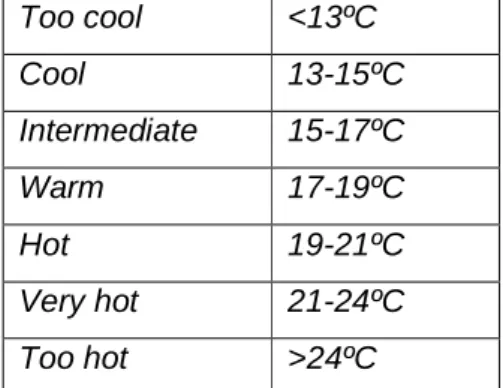
10 / 31 04 / 1 min max T T (equation 2)Table 1. Growing Season Temperature class limits taken from Hall and Jones (2010). Too cool <13ºC Cool 13-15ºC Intermediate 15-17ºC Warm 17-19ºC Hot 19-21ºC Very hot 21-24ºC Too hot >24ºC
1.5.2 Growing degree days (GDD)
Growing degree days (GDD) is a measure of heat accumulation. It is calculated by subtracting a base temperature (10ºC for wine grapes) from the average temperature recorded each day from 1st of April to 31st October (Northern Hemisphere). This heat unit was first extensively used by Winkler et al. (1974). While the degree days index has been commonly used, it has significant limitations. Reliance on GDD may have been responsible for the late arrival of grapes in such cool areas as Tasmania, Australia (Coombe and Dry 1988).
The base temperature of 10ºC has been chosen because little to no growth occurs below this temperature, however other authors believe other temperatures are possible, also depending on the growth period (Boehm 1970). Some upper and lower boundaries for this index were set by Hall et al. (2010) as follows: if GDD totals are below 850ºC-days they fall in the too cold class for viticulture, a too hot class was suggested for GDD totals above 2700ºC-days.
GDD=
∑
[
(
+)
−]
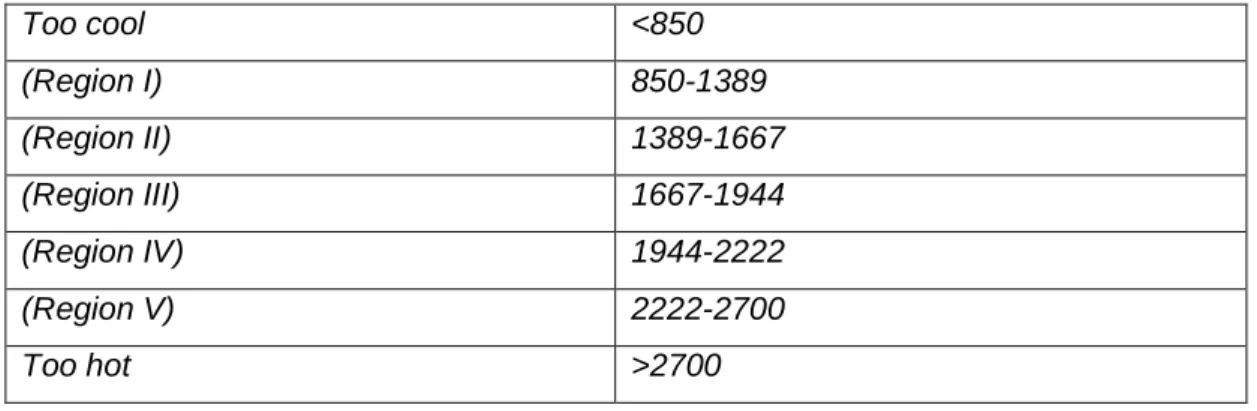
10 / 31 04 / 1 min max /2 10,0 max T T (equation 3)Table 2. GDD limits defined by Winkler (1974). Too cool <850 (Region I) 850-1389 (Region II) 1389-1667 (Region III) 1667-1944 (Region IV) 1944-2222 (Region V) 2222-2700 Too hot >2700
1.5.3 Huglin Index (HI)
Huglin Index (HI) is an altered version of GDD. The HI takes the temperature accumulated during the daylight rather than a whole 24 hour period. This is because, it is the daylight period where photosynthesis occurs. There is also a length of day coefficient, ‘k’, that varies between 1.02 and 1.06 at 40º to 50º latitude. Unlike most of the other climatic indices the HI is measured over a 6 month period instead of 7 months. In areas where there is a large annual temperature variation, the 7th month will be the coolest and can distort the results to give a lower than expected index value for the region when compared with a region that is considered cooler but has less variation between summer and winter temperatures. For example, a highly continental area may have a very hot growing season and early harvest, followed by a significantly cooler 7th month at the end of the season. If this 7th month is included in the summation of a climate index, the area may show a similar climate index value to a region that had a much cooler growing season but maintained higher temperatures over the 7th month than the other more variable region. Sometimes (in warmer regions) this 6 month period may more closely match the growing season of the grapevine, hence being more relevant for obtaining the information required, such as viticultural potential of the region and varietal suitability.
HI =
∑
[
(
Tmean− + Tmax−)
]
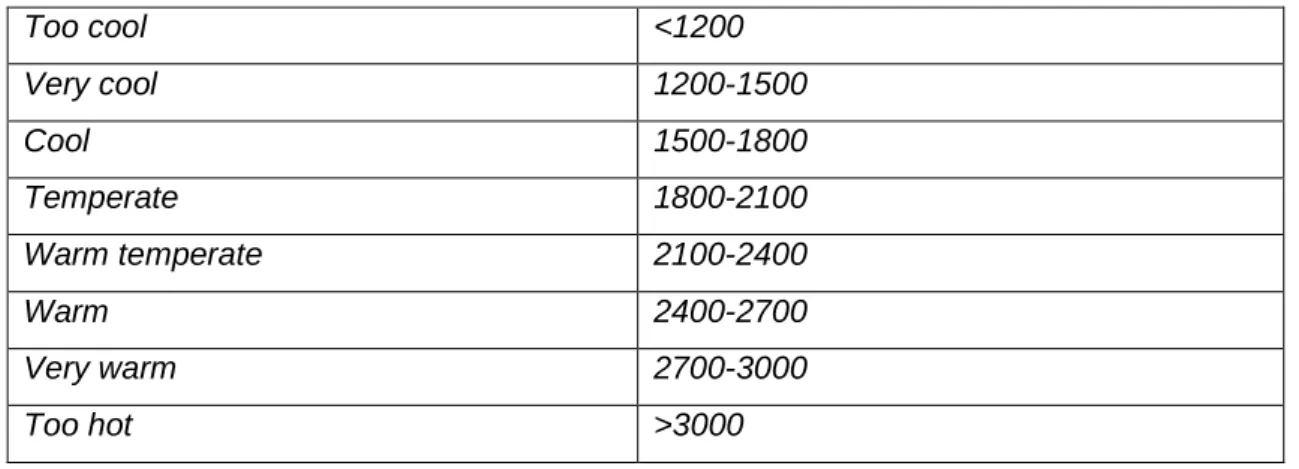
K 09 / 30 04 / 1 2 / 10 ( ) 10 (equation 4)Table 3. Huglin Index climate class limits (Hall and Jones, 2010). Too cool <1200 Very cool 1200-1500 Cool 1500-1800 Temperate 1800-2100 Warm temperate 2100-2400 Warm 2400-2700 Very warm 2700-3000 Too hot >3000
1.5.4 Biologically effective degree-days (BEDD)
Biologically effective degree-days (BEDD) uses similar adjustments as the Huglin Index, however with a different emphasis. For example it uses an adjustment to estimate diurnal temperature range as well as adjusting for day length. The factor for diurnal temperature is adjusted upward if the range is greater than 13ºC and adjusted downward if the range is less than 10ºC. The day length coefficient ranges from 1.000 to 1.045 at 40º to 50º latitude. The interval of effective heat summation is considered between 10ºC (base temperature) and 19ºC (upper threshold) i.e all further increases in mean temperature above 19ºC are disregarded). Unlike the Huglin Index, BEDD maintains the 7 month growing season model, instead of 6 months. As discussed, if there is a large temperature range in an area, this can distort values.
BEDD =
[
(
[
T T]
)
]
DTRadj.K 10 / 31 04 / 1 min max /2) 10,0],9. (max[ min∑
+ − (equation 5) Where 0.25 [DTR-13], [DTR] >13 (equation 6) DTRadj= 0, 10 < [DTR] < 13 0.25 [DTR-10], [DTR] < 10DTRadj is the diurnal temperature range adjustment and K is an adjustment for
Table 4. Too cool and too hot BEDD class limits for viticulture (Jones and Hall, 2010).
Too cool <1000
Too hot >2000
1.5.5 Cool night index (CI)
Cool night index (CI) is a night coolness variable which takes into account the mean minimum night temperature during the month when ripening usually occurs.
In the northern hemisphere it is the mean minimum temperature of the month of September (March in the southern hemisphere). This variable has been used to give a better indication of potential quality of a region in terms of secondary metabolites such as aroma and polyphenols as well as colour development (Kliewer and Torres, 1972; Kliewer, 1973; Tomana et al., 1979).
In the Northern Hemisphere:
CI = minimum air temperature in the month of September (mean of minima), ºC. (eq. 7) In the Southern Hemisphere:
CI = minimum air temperature in the month of March (mean of minima), ºC. (eq. 8)
1.5.6 Dryness Index (DI)
Dryness index (DI) is based on the water balance model of Riou (Riou et al., 1994, eq. 9). This model can predict the potential water available to the vines in an area by taking into account soil reserves, the transpiration of the vine, soil evaporation, runoff and the rainfall of an area. The Dryness index is calculated using the same 6 month period as the Huglin index (April -September).
W = 01.04 30.09
∑
Wo + P - Tv – Es (equation 9)Where, W is the estimate of soil water reserve at the end of a given period, Wo the initial available soil water reserve, which can be accessed by the roots, P the precipitation, Tv the potential transpiration in the vineyard, Es the direct evaporation from the soil.
Tv = ETPk (equation 10)
ETP is the potential evapotranspiration (montly total), using the Penman method (Penman, 1948), k the coefficient of radiation absorption by vine plant (which is in relation to transpiration and depends on vine architecture)
Es = [ETP/N] (1-k)JPm (equation 11)
N is the number of days in the month, JPm is the estimated number of days of rainfall per month.
K values adopted were as follows:
• In the Northern Hemisphere, k = 0.1, for April, 0.3 for May and 0.5 for the months from June to September. (equation 12)
• In the Southern Hemisphere, k = 0.1 for October, 0.3 for November and 0.5 for the months from December to March. (equation 13)
W can be negative, for expressing the potential water deficit, but should not be greater than Wo. The index is calculated month by month, based on monthly values of P, ETP, Tv and Es. DI is called the value of W obtained at the final moment following the rules above and adopting Wo = 200mm.
Climate indices that focus on other indicators other than temperature, can complement temperature indices and provide a more thorough explanation of grapevine development. For example Carbonneau and Tonietto (2004) combined three climatic indices (DI, HI and CI) to create a multi-criteria climatic classification.
1.6 Climate Change
Climate change is arguably one of the most studied and debated scientific issues of our day. Observed trends and potential future changes in temperatures have and will continue to exert a strong influence on virtually every form of agriculture where production viability may be altered due to changes in winter hardiness potential, frost occurrence, growing season lengths, and heat accumulation for ripening potential. Viticulture is included as one of these forms of agriculture that is effected by such changes. Extreme weather events such as hard winter freezes, spring or fall frosts, and hail can result in major losses in a given vintage, while long-term changes in climate can result in changes in production viability and wine styles.
Throughout the history of wine production, it has been a very regional product, with the adaption of different varieties to different regions where the conditions match closely with the requirements of the variety. This means that many varieties are planted in regions where conditions are within quite a narrow range for them. These scenarios make viticulture very sensitive to even small changes in climate.
Over the last 50 years research has shown that many of the world’s wine regions have experienced a decline in frost frequency and timing and warmer growing seasons with greater heat accumulation (Jones 2006).
An examination of climate and phenology trends over the last 30–50 years for nine locations across a range a climate types in Europe (cool to warm) and for 16 varieties shows that warming has occurred across most seasons, but is strongest in the spring and summer (Jones 2006). Growing seasons have warming across Europe by 1.7°C on average with most of the warming coming at night. Heat accumulation has increased as well with degree days rising by 250–300 units (in °C units) while precipitation frequency and amounts have not changed significantly. The grapevine’s phenological timing has showed strong relationships with the observed warming with trends ranging six to 25 days earlier over numerous varieties and locations. Changes are greatest for veraison and harvest dates which typically show a stronger, integrated effect of a warmer growing season. Interval lengths between the main phenological events have also declined with bud break to bloom, veraison, or harvest dates shortening by 14, 15, and 17 days, respectively. Averaged over all locations and varieties, grapevine phenology shows a three to six-day response per 1°C of warming over the last 30–50 years (Jones 2006).
1.7 The Dão Wine Region
The region of Dão is located in central Portugal. A research centre for viticulture is located in the region within the smaller demarcation of Nelas. The vineyards of Dão can usually produce about 500 000 hectolitres of wine depending on the seasonal conditions. The designated area of IG ‘Terras do Dão’ is divided into two DO areas; DO Dão and DO ‘Lafões’. The council of Nelas is located in the sub-region of Terras de Senhorim within the DO Dão demarcation. There are a range of varieties (Table 1.) that are grown within the area, and must be adhered to when producing DO Dão wines (IVV, 2011).
Table 5. Main vine varieties grown in the Nelas area, used to create wines with DO ‘Dão’
status. (IVV, 2011). Red:
Alfrocheiro, Alvarelhão, Aragonez (Tinta Roriz), Bastardo, Jaen, Rufete, Tinto Cão, Touriga Nacional and Trincadeira (Tinta Amarela).
White:
Barcelo, Bical, Cercial, Encruzado, Malvasia Fina, Rabo de Ovelha, Terrantez, Uva Cão and Verdelho.
The wine region is located primarily on a plateau that is sheltered on three sides by the granite mountain ranges of Serra da Estrela, Serra do Caramulo and Serra da Nave. This helps the area maintain its temperate climate away from the effects of the nearby Atlantic Ocean. The region experiences abundant rainfall in the winter months and long, warm dry summers leading up to harvest. The region’s vineyards are planted on sandy well-drained soil on top of granite rock (Robinson, 2006).
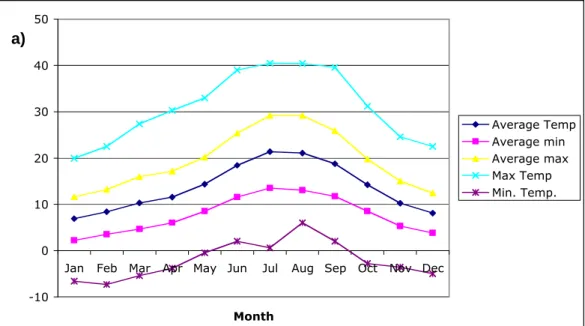
From the weather data collected at Viseu between 1971 to 2000 by the ‘Instituto de meteorologia, IP Portugal’ (Fig. 2), it is possible to obtain a reasonable understanding of the climate in the region. The temperatures are generally warm in summer with average maximum temperatures around July and August of 29.2ºC and average temperatures of 21.4ºC. Temperatures have also on occasions reached extremes of up to 40ºC in the months of June to September. The average minimum temperatures in the two hottest months are 13.5ºC and 13ºC in July and August respectively.
The winters are cool with a monthly average temperature falling to the lowest in January (6.9ºC). There have been occasions of temperatures falling below 0ºC at night, the lowest recorded temperature between 1971-2000 was –7.3ºC which occurred during February.
The region has a winter-dominant rainfall with the average monthly rainfall peaking in December (195.4mm). The summers are relatively dry with low average precipitation (July-19.2mm, August-17.9mm).
-10 0 10 20 30 40 50
Jan Feb Mar Apr May Jun Jul Aug Sep Oct Nov Dec
Month Average Temp Average min Average max Max Temp Min. Temp. 0 50 100 150 200 250
Jan Feb Mar Apr May Jun Jul Aug Sep Oct Nov Dec
Month
Avrg Precipitation Max daily Precipitation
Figure 2. Monthly averages of observed values from 1971 to 2000 a) Average monthly
temperatures b) Average monthly precipitation levels. Source: www.meteo.pt.
a)
Records from the meteorological database of Viseu and Nelas between 1961-1990 show that December and January are the months where frost occurrence is higher. In some years there is risk of spring frost in April and May, the highest risk time for frost-damage of vines in the region.
1.8 Touriga Nacional
Touriga Nacional has been recognised for its capability of producing high quality Port and table wines suitable for ageing. Due to the recognition of Touriga Nacional’s potential for quality, there has been an increase in the planting of the variety throughout the country, as well as internationally; in countries such as Spain, South Africa, Australia, USA and Brazil (Magalhhães, 2008).
Over the last twenty-five years in the Dão region alone, the planted area of Touriga Nacional has increased by 300%. From 422 hectares in 1983 to 1300 hectares in 2008 (CVR Dão 2008).
Reported oenological characteristics express that Touriga Nacional has the potential to produce quality wines. The variety can produce wines with a very high potential alcohol and high acidity but very balanced (Brites and Pedroso, 2000). Touriga is a very versatile variety (Magalhães, 2008).
The variety is capable of producing wines of intense colour, with violet tones when young. The aroma is equally intense, expressing very ripe black fruits, with something wild such as; blackberries, rosemary, lavender and pine needles. The palate is full, balanced and persistent with robust tannins and lots of fruit when young. Wines produced can have a good ageing potential. Magalhães (2008) and Bohm (2007) add that because of its aromatic complexity, structure and quality of phenolic compounds it is an excellent variety for the production of single varietal wines as well as blends. It is also highly recommended for quality port wines.
Despite the reported big expansion of Touriga Nacional to other terroirs, to our knowledge, very little is known about its responses to climate variability.
2. Materials and Methods
2.1 Touriga Nacional (Technical Description)
Touriga Nacional is a vigorous variety with a tendency for downward shoot growth. The variety is susceptible to water-stress and is prone to the loss of leaves around the fruit-zone in such conditions. Budburst is moderate, but with high fertility, including from basal buds. Production levels are medium to high with selected plant material and adequate conditions, however without such conditions, Touriga is typically a low-yielding variety. Touriga Nacional has small to medium sized bunches containing small, lightly compacted berries.
For further ampelographical and phenological information on Touriga Nacional See appendix 1.
2.2 The Vineyard Site
All data was collected in three vineyard plots from the ‘Centro de Estudos Vitivinícolas do Dão’, Quinta da Cale, Nelas (Latitude 40 ° 31 'N, longitude 7 ° 51'W, Elevation 440 m).
The viticultural data from 1961 to 1987 was collected from a vineyard plot labeled ‘Folha 3’. This vineyard was planted in 1946 with 26 varieties and 15 different rootstocks for a study of the affinity between different rootstocks and varieties. The experimental design is a factorial design with two factors: variety x rootstock but in this work we have used only data from one variety. The elemental plot comprises 28 vines distributed over four adjacent rows of seven vines each. The rootstocks used were: 420A, 161-49, 3309 Couderc, 110 Richter, 99 Richter, 420 A and 161-49.
The density of planting is 5050 plants per hectare (row-spacing 1.80m x 1.10m).
The vines were trained to a vertical shoot-positioned trellis and pruned to a double ‘Guyot’ system. The height of the cordon is 0.6m from the ground.
The soil is porphyritic granite of coarse texture. It is an acidic soil with low organic matter content. The soil has a high hydraulic conductivity and a low water retention capacity. Records were taken from all 28 vines. Qualitative parameters were measured from juice samples made from each strain of rootstock.
Data collected from 1995 to 2008 was collected from a vineyard plot labeled ‘Folha 1C’ from the same research centre. The vineyard has a slightly different row-spacing (1.80m x 1.00m) and was spur pruned in a bilateral Royat cordon. The rootstocks used here were 1103P, SO4 and 99R.
Data collected from 2009 to 2010 was collected from ‘Folha 5’. The rootstocks used in this plot were 110R.
2.3 Climate Data
Climate data was collected from a weather station located in the research centre. Daily minimum and maximum temperatures and rainfall were collected for the period, with some periods of missing data as discussed below.
2.4 Missing Data
There were 39 years of complete data available over the recorded time period from 1963 to 2010 to calculate the various climate indices. In some years, where there was only partial missing data, it was still possible to calculate some of the indices; for example CI only requires the average minimum temperature values for September. However, these exceptions were excluded and only years where all indices were available were included in the final results for better comparability between indices. In total there were eight years where there was insufficient data to calculate all of the climate indices.
There was data between 1961 and 2010 that was available for phenology, yield and berry composition. However, all yield and berry composition information was missing from 1988 to 1994. In addition to these missing values Alcohol and pH values were also missing from 1998. TA was missing from 1999 to 2003, and yield values were missing from 1998 and 2001.
All veraison phenological dates were missing until 1982. Veraison dates from 1961 to 1982 were estimated based on the correlation between available Veraison date observations (1983-2010) and observations of flowering dates.
Budburst, Flowering and Veraison dates are missing in 1989, while only Budburst and Flowering dates are missing from 1990. Budburst dates are missing in 1993 and there
were no phenological results for 1998. The date of Veraison is missing from the 2005 records.
Phenological data from 1995 was removed because it was considered to be an outlier, as it showed a harvest date 20 days earlier than the next earliest year.
All data until 1987 was collected from the ‘folha 3’ vineyard plot. Because this plot was set-up originally as a study between rootstocks and varieties, there are results collected from five, sometimes seven different rootstocks (420A, 161-49, 3309 Couderc, 110 Richter, 99 Richter, 5BB and Rupestris du Lot). Although all of the vines are of the Touriga Nacional variety, the rootstock variation can lead to varying responses of the vine under different conditions. The yield and berry composition data varies between rootstocks, however phenological dates were all uniformly assigned for the whole vineyard, except for budburst dates which were recorded separately in different rootstocks from the years 1983 to 1988, the median values of these were used for these six years for better comparability.
When measuring the evolution of the plant characteristics it would be ideal to take data from vines of the same rootstock, as well as when measuring correlations with climate. Accepting this inconvenience, an attempt to display any variations in data due to differences in rootstocks in the samples will be made. Allowing the inclusion of all of the rootstocks provides a considerably larger sample size for a more thorough evaluation. The data available after 1987 was taken from 1995 to 2008 from an adjacent vineyard plot labeled ‘Folha 1C’. The rootstocks used here were 1103P, SO4 and 99R.
Finally, results from 2009 and 2010 were collected from ‘Folha 5’ from only one rootstock (110 Richter).
The database has the following missing values: • Alcohol: 1988-1994 and 1998;
• TA: 1988 to 1994 and 1999 to 2003; • pH: 1988 to 1994, as well as 1998; • Yield: 1988 to 1994, as well as 1998.