Examining exercise motives between gender, age and activity:
A first-order scale analysis and measurement invariance
Filipe Rodrigues1,2,3 &J. Moutão2,3&D. Teixeira4&L. Cid2,3&D. Monteiro2,3
# Springer Science+Business Media, LLC, part of Springer Nature 2019
Abstract
Conceptualizing an exercise program according to exercisers motives seems to be crucial. Thus, adequate and validated scale assessing motives for physical activity is necessary. This study aimed to translate and validate the Exercise Motives Inventory– 2 (EMI-2), a scale assessing fourteen motives for regular physical activity in Portuguese exercisers. In addition, comparison of motives between groups were made according to gender, age, and fitness activity. For scale validation, data from two independent samples were collected: calibration (n = 820; female = 499) and validation (n = 733; female = 451) participants. For scale reliability and mean difference analysis, data from a new sample was collected (n = 515; female = 342). Results showed that data did not fit the original 51-item model. After reviewing item loadings, two items were eliminated, since they presented factor loadings below acceptable. Hence, the revised model encompassing 49-item had an adequate fit. Convergent and discriminant validity was achieved in the revised model, displaying acceptable construct validity. In addition, invariance criteria were respected between female and male Portuguese exercisers. Regarding mean comparison analysis, differences were found be-tween gender, and across age and fitness activities. Nevertheless, in overall the majority of exercisers indicated“general health” and“physiological” motives as the most valued. The EMI-2 is a reliable scale assessing motives in Portuguese exercisers. This study suggests that exercise programs should be conceptualized considering motives, but also gender, age, and fitness activity.
Keywords Exercise . Motives . Confirmatory analysis . Measurement invariance . Mean differences
Physical activity and motives
“What drives you to exercise?” is possibly one of the most frequently asked questions by exercise professionals and peers when someone engages in physical activity for the first time. Research on understanding the motives for individuals to choose to exercise could be of great practical value (Markland and Hardy1993) and therefore conceptualizing an exercise program according to exercisers motives seems to be essential. Concerning exercising, goals of pleasure,
competence and self-regulation are conceptualized as internal motives and will have positive effects such as exercise persis-tence (Markland and Hardy 1993; Markland and Ingledew
1997). However, goals which pressure people to participate in physical activity can create anxiety and tension, hence, they are defined as external motives and may have adverse effects such as exercise withdrawal (Ingledew and Markland2008).
This notion of intrinsic and extrinsic motives has been keenly studied by Ryan and Deci (2017), suggesting that to behave in an informational manner leads to positive results, and that to regulate oneself in a controlling fashion lead to negative outcomes. In a theoretical manner, exercising by in-ternal motives (e.g., because of pleasure, enjoyment, revitali-zation) will influence intrinsic motivation and subsequent pos-itive outcomes (Sebire et al.2008). On the other hand, people engaging in exercise because of external drives (e.g., social recognition, appraisal, appearance) are more likely to experi-ence controlled motivation, resulting in higher rates of drop-out (Ryan et al.1997). Nevertheless, exercise may be adopted at first for external reasons such as body image and social recognition, but, as physical fitness and well-being increases, self-determined reasons may become more noticeable
* Filipe Rodrigues
1
Sports Science Department, University of Beira Interior, Covilhã, Portugal
2
Research Center in Sport, Health and Human Development (CIDESD), Vila Real, Portugal
3
Sport Science School of Rio Maior (ESDRM-IPSantarém), Av. Dr. Mário Soares nº110, 2040-413 Rio Maior, Portugal
4 University of Lusófona, Lisbon, Portugal https://doi.org/10.1007/s12144-019-00560-y
(Ingledew and Markland2008). Hence, motives may change over time as a response to being actively involved in regular exercise participation.
Individuals have different reasons for engaging in physical exercise. Some for increasing physical fitness (e.g., speed, strength, endurance), others for health-related outcomes (e.g., decrease diabetes side effects), and/or even for social acceptance (e.g., belong to a club). In this regard, individual’s characteristics could impact motives for exercise participation (Cid et al.2007; Klain et al.2015). For example Ingledew et al. (1998) suggest that women endorse in physical activity mainly for external reasons (e.g., body image, acceptance by others) and men mostly for internal reasons (e.g., enjoyment, health and self-esteem). Dacey et al. (2008) have shown that older people are more likely to participate in physical activity for health, physical fitness, and enjoyment. Therefore, under-standing what drives someone to exercise regularly seems paramount to actively keep follow-up their adherence.
Exercise Motives Measurement
When it comes to measuring motives, several instruments have been used in the exercise context: Duda and Tappe (1988) created the Personal Incentives for Exercise Questionnaire (PIEQ); Frederick and Ryan (1993) designed the Motivation for Physical Activity (MPAM), and Markland and Hardy (1993) developed the Exercise Motives Inventory (EMI). Looking individually at each instrument, the PIEQ is a 49-item questionnaire comprising seven subscales (i.e., mas-tery, competition, social affiliation, recognition, health bene-fits, coping with stress, and physical fitness). However, it has been suggested to suffer from a number of problems such as construct validity, influencing its applicability in the actual context (Markland and Hardy 1993; Molanorouzi et al.
2014). The original MPAM encompassing three motives (i.e., interest/enjoyment, competence, and body-related moti-vation) was later reviewed and expanded by Ryan et al. (1997) encompassing two more motives namely fitness and social aspiration. However, this instrument continues to be limited on measuring exercise related-goals compared to other instru-ments such as the EMI-2 which considers 14 motives (Markland and Ingledew2007). In this regard, the EMI and latter EMI-2 seems to hold higher validity compared to previ-ous reported scales and has been applied successfully in sev-eral research led in the exercise domain, specifically in older adults (Dacey et al.2008), in gym and health center clients (Klain et al.2015), and even in young adults (Ingledew and Markland2008).
Markland and Hardy (1993) created the EMI based on three sources: 1) open-ended responses provided by a sample of regular exercisers, stating three main motives on why they choose to exercise; 2) items rooted within the PIEQ, and; 3)
motives reported in the literature. The EMI-2 (Markland and Ingledew1997) was settled to extend the previous instrument, by reviewing the original one. This upgraded version contains 51 items defining 14 constructs, assessing a broader range of motives exercisers have. Thus, the EMI-2 measures the fol-lowing motives: stress management, revitalization, enjoy-ment, challenge, health pressure, ill-health avoidance, positive health, agility, strength and endurance, weight management, appearance, social recognition, affiliation, and competition. In addition, Markland and Ingledew (1997) proposed that these fourteen motives could be grouped into five second-order groups: psychological (stress management, revitalization, en-joyment, and challenge); interpersonal (affiliation, social rec-ognition, and competition); health (health pressure, positive health, and ill-health avoidance); physical condition (agility, strength and endurance), and body (weight management, appearance).
Since its validation, the EMI-2 has been translated in sev-eral different languages, namely: English, Spanish, Portuguese, German, Arab, and Slovenian, suggesting that this scale holds a broad appeal as a method of assessing exercise motives. Ingledew and Markland (2008) have shown this scale to be reliable on measuring exercise motives, hence, it appears useful to measure a broad display of intrinsic and extrinsic reasons.
Although several authors (Ortís et al.2007; Roberts et al.
2014) have determined high levels of applicability of the EMI-2, past research displays some issues that needs to be ad-dressed. First, to the best of our knowledge, no study has ever tested the 51-item scale encompassing all aspirations in one measurement model. Previous studies have conducted explor-atory analysis (Markland and Hardy 1993) or confirmatory analysis in each factor individually (Klain et al.2015). Other studies such as Baptista et al. (2014) adapted the instrument into a shorter version (14-item) considering only one item per factor, encompassing them into three motives (psychological and physical well-being, health, and social). However, this does not represent the EMI-2 true nature falling short on assessing adjusted psychometric properties. In addition, the model displayed adequate fit only after correlating standard errors between items from different factors, which is not rec-ommended by statistical guidelines for measurement model analysis (Hair et al.2014).
Looking at past literature, there seems to be a gap in the literature on testing a first-order model analysis considering all fourteen exercise motives. In other words, no measurement model considering all exercise aspirations has been tested and this is a gap that needs to be addressed to accept or reject adjusted psychometric proprieties of the EMI-2. Even the first authors of the EMI-2 came short since they had to eliminate four motives (i.e., challenge, ill-health avoidance, enjoyment, and revitalization) from the original scale to achieve accept-able results. In fact, Markland and Ingledew (1997)
recommended further analysis of this instrument to achieve model fit as close as possible to the original 14-motives. In addition, no study conducted till date with Portuguese exer-cisers measured invariance between different groups (e.g., gender). This presents a relevant gap that needs to been filled since invariance analyses are need to understand if the EMI-2 is equivalent among groups with different characteristics as suggested by Chen (2008).
Present Research
Considering limitations from previous studies and agenda for future research, current study (Study 1) aimed to validate the EMI-2 in a Portuguese sample considering all fourteen aspi-rations in one measurement model. Construct validity, internal consistency, convergent and discriminant validity, as well as measurement invariance analysis were performed on the EMI-2 to examine the psychometric proprieties and scale reliability. In addition, means between groups (i.e., gender, age, fitness activities) were compared to assess differences (Study 2). Understanding the dimensionality of the EMI-2 could give new insights on how fitness professionals should assign train-ing sessions to promote long-term exercise participation.
It is hypothesized that the EMI-2 would hold acceptable fit in Portuguese exercisers as it has presented in previous studies (Markland and Ingledew 2008; Dacey et al.2008). In addi-tion, we suspect differences in exercise motives among gender (Markland and Ingledew1997), age (Dacey et al.2008), and fitness activities.
Study 1
Methods
Participants and Procedures
In order to measure reliability, we collected data from two independent samples (i.e., calibration and validation). The calibration sample was composed by 733 Portuguese exer-cisers (female = 451) aged between 18 and 75 years (M = 34.73; SD = 11.66). Exercise experience ranged from 4 months to 166 months (M = 55.74; SD = 6.97) and endorsed activities generally were fitness group classes (n = 112), swim-ming pool activities such as water gymnastic (n = 100), and weightlifting/cardio training (n = 255).
In validation sample, 820 Portuguese exercisers (female = 499) aged between 18 and 76 years (M = 34.69; SD = 11.70) were enrolled for analysis. Exercise experience ranged from 3 months to 180 months (M = 60.49; SD = 8.54). Performed activities were mostly fitness group classes (n = 112),
swimming pool activities such as water gymnastic (n = 114), and weightlifting/cardio training (n = 102).
Research was approved by the Ethical Committee previous to data collection. Afterwards, sixteen managers from differ-ent Portuguese gym and health cdiffer-enters were contacted, studies objectives were explained, and agreement was obtained. By convenience at reception desk, individuals were approached before training sessions and asked to participate voluntary in this study. Thus, data collected from these first exercisers were considered for calibration sample. Six months later, new data was collected, representing validation sample. Information sheets were distributed for all potential participants and in-formed consent was signed before filling the questionnaire. Individuals took approximately 10–15 min to complete the demographic form and the EMI-2.
Measures
To assess exercise motives, the Exercise Motives Inventory - 2 Portuguese version (Alves and Lourenço 2003) was used. This scale encompasses 51 items, asking participants to an-swer on a 6-point scale with verbal anchors located at 0 (“not at all true for me”) and 5 (“very true for me”). Looking at factors (i.e., fourteen), five where composed by three items (revitalization, ill-health avoidance, health pressure, positive health, and agility) and the others by four items (stress man-agement, enjoyment, challenge, social recognition, affiliation, competition, weight management, appearance, and strength and endurance). Several studies (Ingledew and Markland
2008; Markland and Ingledew1997; Ortís et al.2007) support the use of this scale for measuring exercise motives.
Statistical Analysis
Descriptive statistics were calculated and data was screened for missing values previous to confirmatory analysis. Participants with more than 5% of missing values, univariate (z > 3) and multivariate (D2= p1 < .001, p2 < .001) outliers were excluded as recommended by Byrne (2016). Data from questionnaires with less than 5% of absent scores was imputed using the Full Information Maximum Likelihood estimation (FIML) (Cham et al.2017).
A Confirmatory Factor Analysis (CFA) to measure model fit was performed using IBM SPSS AMOS 23.0. Maximum Likelihood method was conducted since this estimation is a viable option for estimating factor models using continuous variables (DiStefano and Hess2016; Schmitt2011). Test for common method bias was tested prior to a fourteen measure-ment model, following Podsakoff et al. (2003) guidelines. Measurement model adequacy was verified by the traditional absolute and incremental indexes, namely: Comparative Fit Index (CFI), Non-Normed Fit Index (NNFI), Standard Root Mean Residual (SRMR), Root Mean Square Error of
Approximation (RMSEA), and its respective 90% Confidence Interval (90%CI). Cutoffs recommended by several authors (Byrne2016; Hair et al.2014; Marsh et al.2004) were used, namely: CFI and TLI≥ .90, and SRMR and RMSEA ≤ .80. We tested second-order CFA model using the same cutoffs fit indexes. However, according to some authors (Kenny and McCoach2003), in very complex models CFI tends to decline even if the model is properly specified. Therefore, these au-thors suggest accepting the model if the CFI is slightly lower as recommended, thus RMSEA needs to be acceptable. Models should be rejected if both CFI and RMSEA are below cutoffs (Kenny and McCoach2003). Composite Reliability (CR) was calculated using Raykov (1997) formula to test in-ternal consistency considering scores above .70 as acceptable. Convergent and discriminant validity were assessed to test if the items converged to the same factor and if factors are suf-ficiently distinct from each other, respectively. Average Variance Extracted (AVE) was calculated and values above .50 were defined as acceptable for convergent validity. Squared correlations across constructs should be below AVE scores to achieve discriminant validity as recommended by Hair et al. (2014).
Measurement invariance was conducted in order to test if the model would exhibit the same fit between calibration and validation sample, as well as between gender. This type of analysis enables to measure the equivalence of the measure-ment model between groups with different characteristics (Cheung and Rensvold2002; Meredith1993; Sass2011). A multi-group analysis was performed according to several rec-ommendations (Chen 2007; Cheung and Rensvold 2002), namely: i) the measurement model should have good fit in each group, and; ii) differences (Δ) CFI ≤ .01 for configural invariance,ΔSRMR<.03 and ΔRMSEA < .015 for metric in-variance, andΔSRMR < .01 and ΔRMSEA < .015 for scalar invariance. Residual invariance is considered optional since it difficult to achieve in the field of social sciences, as suggested by Byrne (2016).
Results
Preliminary Analysis
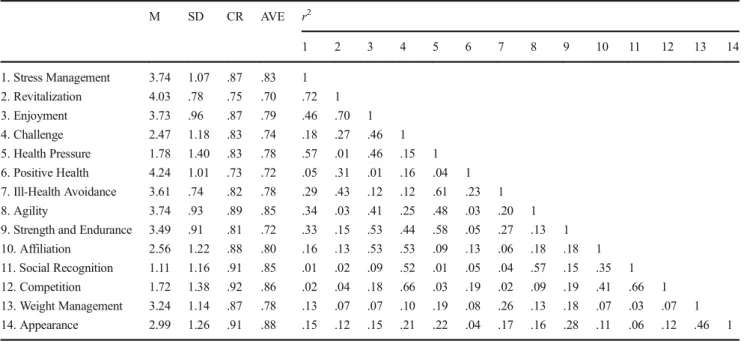
Concerning calibration sample, 29 participants were eliminat-ed since they presenteliminat-ed > 5% of missing values in all items. In addition, 11 univariate and 14 multivariate outliers were elim-inated for subsequent analysis. In validation sample, 24 indi-viduals with missing values > 5%, 12 univariate, and 5 multi-variate outliers were excluded from further analysis. Descriptive statistics revealed univariate distribution, since skewness and kurtosis were contained within cutoffs in both samples. Descriptive statistics for calibration and validation sample are displayed in Tables 1 and 2, respectively. Positive health motive presented the highest mean, whereas
social recognition showed the lowest mean in both groups. Exercise motives displayed CR coefficient above cutoffs, sug-gesting acceptable internal consistency.
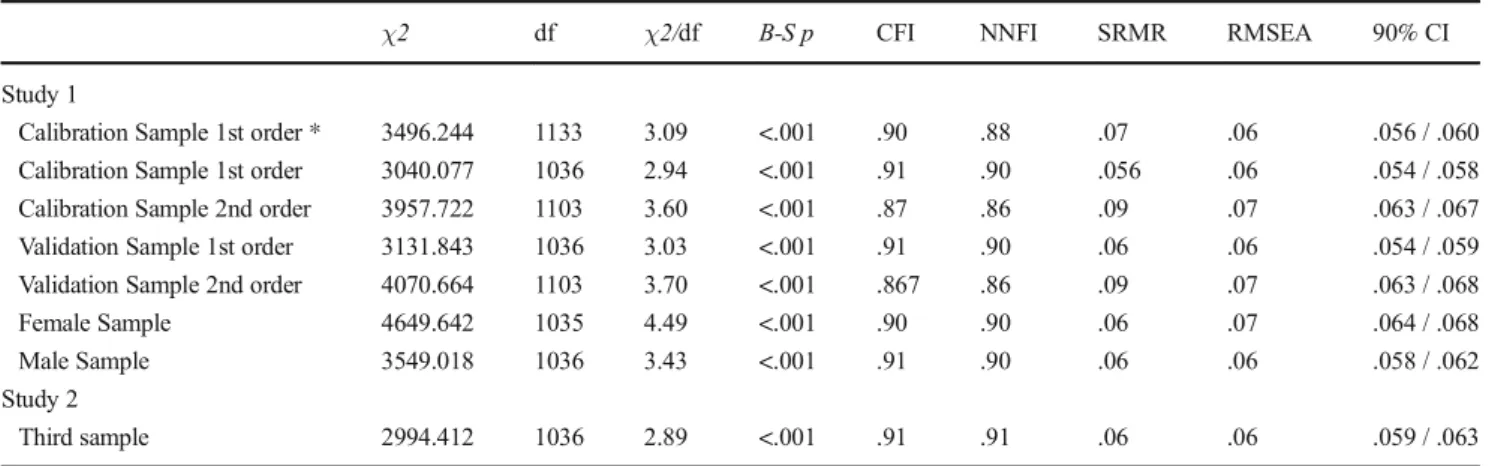
Confirmatory Factorial Analysis
Test for common method bias showed that total explained variance was below 50%. Thus, a measurement model con-sidering fourteen factors was analyzed. Multivariate normality was violated since Mardia’s coefficient exceeded cutoffs in both groups. In this regard, a Bollen-Stine bootstrap of 2000 samples was inserted as recommended by Nevitt and Hancock (2001). The measurement model using the original 51-item scale was close to fit the data as seen in Table 3. Hence, modification indexes and possible cross-loadings were exam-ined in detail. Results show that item 4 (i.e., appearance) and item 6 (i.e., stress management) presented factor loadings be-low cutoffs and were therefore eliminated.
The revised measurement model considering 49 items had an acceptable fit as displayed in Table3in both samples. Item loadings ranged from .55 (weight management) to .91 (competition) in calibration sample, and from .58 (positive health) to .91 (competition) in validation sample. Hence, fac-tor loadings explain at least 25% of latent facfac-tors variance (see Table4).
Then, a second-order model was tested according to previ-ous reported literature. Looking at traditional and incremental indexes, the second-order model did not fit the data. Once more, modification indexes and cross-loadings were analyzed to explain current results. All factor weights were above .50 and no significant cross-loadings were found. However, since model had a poor fit (i.e., CFI and RMSEA below cutoffs), the second-order model was rejected.
Convergent validity was achieved since AVE scores were above acceptable. Looking at discriminant validity, 90 of 91 interactions achieved expected results. Stress management and revitalization did not present discriminant validity. Nevertheless, the lack of discriminant validity in these factors was residual as see in Tables1and2.
Multi-Group Analysis
Results revealed that the measurement model is invariant be-tween samples and gender based on recommended criteria (see Table5). Specifically, the model fit in each sample and differences between indexes were below suggested cut-off values.
Discussion
The aim of the present study was to test and validate the original EMI-2, a 51-item instrument measuring 14 motives
for exercise participation, in a sample of Portuguese individ-uals. A CFA was conducted, considering the traditional and incremental indexes, convergent and discriminant validity, as well as internal consistency. We also tested a second-order model converging fourteen motives into five second-order factors as proposed by several authors (Markland and Hardy
1993; Markland and Ingledew 1997). To increase measure-ment reliability, measuremeasure-ment invariance analysis was con-ducted between two independent samples and gender.
Confirmatory Factor Analysis
The first step was to develop the first-order factor model of the EMI-2 and examine its validity. The first-order CFA of the 51-item instrument on both samples extracted fourteen correlated but distinct factor, measuring different motives for exercise participation. However, this model did not fit the data and thus modification indexes had to be analyzed to assess possible issues. No cross-loadings where found, but two items (item
Table 1 Descriptive statistics, composite reliability, average mean extracted, and squared correlation matrix in calibration sample M SD CR AVE r2 1 2 3 4 5 6 7 8 9 10 11 12 13 14 1. Stress Management 3.74 1.07 .87 .83 1 2. Revitalization 4.03 .78 .75 .70 .72 1 3. Enjoyment 3.73 .96 .87 .79 .46 .70 1 4. Challenge 2.47 1.18 .83 .74 .18 .27 .46 1 5. Health Pressure 1.78 1.40 .83 .78 .57 .01 .46 .15 1 6. Positive Health 4.24 1.01 .73 .72 .05 .31 .01 .16 .04 1 7. Ill-Health Avoidance 3.61 .74 .82 .78 .29 .43 .12 .12 .61 .23 1 8. Agility 3.74 .93 .89 .85 .34 .03 .41 .25 .48 .03 .20 1 9. Strength and Endurance 3.49 .91 .81 .72 .33 .15 .53 .44 .58 .05 .27 .13 1 10. Affiliation 2.56 1.22 .88 .80 .16 .13 .53 .53 .09 .13 .06 .18 .18 1 11. Social Recognition 1.11 1.16 .91 .85 .01 .02 .09 .52 .01 .05 .04 .57 .15 .35 1 12. Competition 1.72 1.38 .92 .86 .02 .04 .18 .66 .03 .19 .02 .09 .19 .41 .66 1 13. Weight Management 3.24 1.14 .87 .78 .13 .07 .07 .10 .19 .08 .26 .13 .18 .07 .03 .07 1 14. Appearance 2.99 1.26 .91 .88 .15 .12 .15 .21 .22 .04 .17 .16 .28 .11 .06 .12 .46 1 M Mean, SD Standard Deviation, CR Composite Reliability, AVE Average Variance Extracted, r2squared correlation, CFA model with 49-items
Table 2 Descriptive statistics, composite reliability, average mean extracted, and squared correlation matrix in validation sample M SD CR AVE r2 1 2 3 4 5 6 7 8 9 10 11 12 13 14 1. Stress Management 3.73 1.08 .87 .83 1 2. Revitalization 4.02 .79 .74 .73 .76 1 3. Enjoyment 3.71 .98 .87 .80 .46 .73 1 4. Challenge 2.44 1.18 .82 .73 .18 .28 .47 1 5. Health Pressure 1.75 1.39 .83 .78 .57 .77 .46 .17 1 6. Positive Health 4.23 .75 .72 .68 .05 .04 .01 .16 .61 1 7. Ill-Health Avoidance 3.59 1.01 .81 .77 .29 .42 .13 .12 .04 .25 1 8. Agility 3.71 .96 .89 .85 .35 .62 .43 .25 .50 .04 .22 1 9. Strength and Endurance 3.47 .95 .81 .72 .33 .56 .56 .44 .60 .06 .28 .59 1 10. Affiliation 2.55 1.22 .87 .80 .17 .15 .35 .52 .14 .14 .07 .10 .20 1 11. Social Recognition 1.08 1.16 .91 .84 .01 .02 .08 .53 .01 .32 .04 .03 .14 .34 1 12. Competition 1.69 1.38 .91 .85 .02 .04 .18 .68 .03 .20 .02 .05 .18 .40 .18 1 13. Weight Management 3.21 1.16 .87 .79 .14 .16 .08 .11 .19 .09 .27 .13 .18 .07 .09 .03 1 14. Appearance 2.96 1.27 .92 .85 .17 .29 .24 .28 .28 .04 .17 .20 .16 .14 .03 .08 .47 1 M Mean, SD Standard Deviation, CR Composite Reliability, AVE Average Variance Extracted, r2squared correlation; CFA model with 49-items
4 - appearance) and (item 6 - stress management) had factor loadings below cutoffs. Thus, according to several authors (Byrne2016; Hair et al. 2014) these items were removed. The revised model (49 items) had acceptable fit in both sam-ples and internal consistency was above acceptable. Also, convergent validity was achieved and discriminant analysis showed that 90 of 91 possible interactions were considered acceptable. In the present research, only stress management with revitalization did not exhibited discriminant validity. This could be explained by their representation of psychological motives for exercise. As stated by Markland and Ingledew (1997), both factors could converge into a second-order factor named“psychological”, since they explain perceptions of how they experience exercise in a personal manner. Nevertheless, squared correlation among these factors was residual com-pared to AVE scores.
In overall, results from this study measuring the psycho-metric proprieties of the EMI-2 are novel since it was the first time a research used all fourteen exercise motives in one mea-surement model. Current findings advance previous studies using this scale (Dacey et al.2008; Ingledew and Markland
2008; Markland and Ingledew1997) showing that this instru-ment has acceptable psychometric properties.
Looking at the second-order model specification encompassing all motives into five hypothesized groups (i.e., psychological, health, body image, physical fitness, and interpersonal), analysis was conducted according to theoreti-cal assumptions proposed by Markland and Ingledew (1997). The second-order model in the present study did not achieve fit. Although Kenny and McCoach (2003) suggest that CFI could suffer from complex models such as second-order con-firmatory analysis, and that scores proximal to cutoffs should be considered as acceptable if RMSEA is <.06, the present results are not close to being considered suitable. It is worth to mention that there is virtually no study that has ever tried a
second-order analysis on the EMI-2. In fact, past studies have only examined the psychometric properties of each factor in-dividually (Klain et al. 2015; Markland and Hardy 1993; Markland and Ingledew1997). Nevertheless, present findings suggest the EMI-2 to be a reliable instrument on measuring exercise motives in Portuguese exercisers.
Multi-Group Analysis
With respect to multi-group analysis between samples and gender, results support the equivalence of EMI-2 between groups since all invariance assumptions were met as sug-gested by several authors (Byrne2016; Chen2007; Cheung and Rensvold2002). Present findings exhibit that regardless of sample groups, all factors weights were invariant (configural invariance). In addition, items have the same im-portance for all factors (metric invariance) and are equally between samples and gender (scalar invariance). These results suggest that the measurement model is invariant between sam-ples and gender (Hair et al.2014).
However, differences between male and female exercisers can only be assessed comparing means between them. Vlachopoulos et al. (2013) suggest that there are differences when it comes to perceiving the“why’s” behind exercising. Latent mean differences analysis was not possible to perform since sample size was below minimum recommended (Hair et al. 2014). Specifically, following guidelines of 5 partici-pants per estimated parameter, sample size in this study (n = 1553) was below estimated parameters (n = 1036).
Several studies have shown mean differences between sample characteristics, stating the importance measuring exer-cise motives have when prescribing training sessions (Smith et al.1998). Hence, new data was collected in order to test scale reliability and to compare motives across groups with different characteristics (i.e., gender, age, and fitness activity).
Table 3 Fit adjustment of confirmatory factor analysis
χ2 df χ2/df B-S p CFI NNFI SRMR RMSEA 90% CI Study 1
Calibration Sample 1st order * 3496.244 1133 3.09 <.001 .90 .88 .07 .06 .056 / .060 Calibration Sample 1st order 3040.077 1036 2.94 <.001 .91 .90 .056 .06 .054 / .058 Calibration Sample 2nd order 3957.722 1103 3.60 <.001 .87 .86 .09 .07 .063 / .067 Validation Sample 1st order 3131.843 1036 3.03 <.001 .91 .90 .06 .06 .054 / .059 Validation Sample 2nd order 4070.664 1103 3.70 <.001 .867 .86 .09 .07 .063 / .068 Female Sample 4649.642 1035 4.49 <.001 .90 .90 .06 .07 .064 / .068 Male Sample 3549.018 1036 3.43 <.001 .91 .90 .06 .06 .058 / .062 Study 2
Third sample 2994.412 1036 2.89 <.001 .91 .91 .06 .06 .059 / .063 χ2 chi-square, df degrees of freedom, χ2/df normative chi-square, B-S p Bollen-Stine bootstrap (2000 samples), CFI Comparative Fit Index, NNFI Non-Normed Fit Index, SRMR Standardized Root Mean Square Residual, RMSEA Root Mean Squared Error of Approximation, 90% CI Confidence Interval of RSMEA; * = 51-item model, all other models were tested with 49-items (final model)
Study 2
Methods
Participants and Procedures
To support scale reliability, data from a third independent sample was collected. For analysis, 515 Portuguese exercisers aged between 18 and 74 years (M = 34.73; SD = 11.73) were considered. Exercise experience ranged from 4 months to 177 months (M = 58.47; SD = 7.98). Performed activities were fitness group classes (e.g., aerobics, total workout, step, Pilates), swimming pool activities (e.g., water gymnastics, hidrocycling), and weightlifting/cardio training.
We followed the same procedures as in Study 1 regarding data collection. However, in this study for inclusion potential participants needed to be actively taking part in one of the most reported gym activities in Study 1 (i.e., fitness group classes, swimming pool activities, and weightlifting/cardio training), aged equal or above 18 years, and participate vol-untarily in this study.
Measures
The previously tested and validated Portuguese version EMI-2 encompassing fourteen reasons for exercise participation and 49 items was used. The model displayed acceptable fit as seen in Table 3. Internal consistency was above cutoffs ranging from .71 (strength and endurance) to .83 (enjoyment).
Statistical Analysis
First, univariate of central tendency (mean) and dispersion (standard deviation) measures analysis was conducted. Second, we used t-test for independent samples to assess dif-ferences between female (n = 342) and male (n = 171), and a one-way ANOVA to compare means between age groups and exercise activities. Age groups were created as following: 1)
Table 4 Factor loadings of the 49-item model
Item Factor Calibration Sample Validation Sample
λ S.E. λ S.E. 1 WM .59 .34 .60 .36 2 ILL .69 .48 .69 .48 3 REV .60 .35 .60 .36 4 APP – – – – 5 SOC 82. .67 .81 .66 6 SM – – – – 7 PH .69 .48 .70 .50 8 SR .68 .46 .69 .47 9 JOY .77 .60 .78 .62 10 AFFI .82 .67 .82 .67 11 HPR .58 .33 .60 .36 12 COMP .82 .67 .82 .67 13 AG .77 .59 .77 .60 14 CHAL .71 .51 .70 .50 15 WM .84 .70 .84 .70 16 ILL .85 .59 .86 .74 17 REV .70 .49 .70 .49 18 APP .87 .76 .87 .76 19 SOC .84 .71 .84 .70 20 SM .73 .53 .73 .52 21 PH .82 .68 .82 .68 22 SR .78 .60 .77 .59 23 JOY .81 .66 .82 .67 24 AFFI .76 .57 .76 .57 25 HPR .67 .44 .67 .45 26 COMP .91 .83 .91 .83 27 AG 89. .78 .88 .78 28 CHAL .80 .64 .81 .28 29 WM .88 .84 .87 .71 30 ILL .77 .48 .77 .60 31 REV .80 .64 .80 .64 32 APP .90 .77 .90 .81 33 SOC .88 .75 .88 .78 34 SM .87 .76 .87 .82 35 PH .83 .68 .83 .69 36 SR .77 .60 .77 .59 37 JOY .85 .72 .84 .70 38 AFFI .78 .61 .78 .61 39 HPR .80 .59 .80 .60 40 COMP .86 .73 .86 .75 41 AG .90 .81 .89 .78 42 CHAL .68 .74 .69 .48 43 WM .84 .71 .84 .71 44 APP .88 .77 .88 .78 45 SOC .86 .75 .86 .74 46 SM .90 .81 .90 .82 47 SR .65 .42 .64 .41 Table 4 (continued)
Item Factor Calibration Sample Validation Sample
λ S.E. λ S.E.
48 JOY .75 .57 .74 .54
49 AFFI .84 .70 .85 .72
50 COMP .86 .70 .84 .70
51 CHAL .74 .55 .75 .54
JOY Enjoyment, SOC Social Recognition, AFFI Affiliation, COMP Competition, WM Weight Management, SR Strength and Resistance, CHAL Challenge, SM Stress Management, APP Appearance, ILL Ill-Health Avoidance, PH Positive Ill-Health, HPR Ill-Health Pressure, AG Agility, REVI Revitalization
young adults from 18 to 35 years (n = 123); 2) middle-age adults from 36 to 60 years (n = 240), and; 3) elderly from 61 years and beyond (n = 152) based on Petry (2002) stereo-type classification. Regarding exercise activities, participants were grouped in: i) fitness group classes (n = 145), ii) water activities (n = 124); or, cardio/resistance training (n = 246).
ANOVA was supplemented with the Tukey post-hoc test if the Levene’s test revealed homogeneity within sample, as suggested by Ho (2014). The significance level was set at p≤ .05 to reject the null hypothesis, and IBM SPSS STATISTICS 23.0 for statistical analysis was used. The d Cohen (1988) was calculated to obtain the correspondent ef-fect size for t-test analysis, considering: trivial (0–.19); small (.2–.49), average (.5–.79) and large (greater than or equal to .80) andη2was measured for ANOVA analysis to observe the effect size between groups, considering: small (.1–.06), medi-um (.06–.14) and large (greater than .14).
Results
Gender Differences
There were significant differences between male and female exercisers in nine of fourteen motives: stress management, revitalization, positive health, agility, strength and endurance, social recognition, competition, weight management, and ap-pearance, as seen in Table6. Thus, d value exhibited small to average effect size in these factors, except for strength and endurance showing trivial effect.
Age and Exercise Activity Differences
Differences between age groups and exercise activities are displayed in Tables7and8, respectively. The most significant differences were found between young and middle-aged adults in revitalization, enjoyment, health pressure, strength and endurance, and appearance. No differences were found
between middle-aged adults and elderly, thus elderly exhibited differences with young adults in the health pressure motive. Partial eta squared show small to medium effect, being health pressure the factor with the highest effect size. Regarding exercise activities, fitness group classes show differences in stress management, challenge, and competition with water activities. Results found differences between water activities and cardio/resistance training in health pressure, ill-health avoidance, strength and endurance, and appearance. Partial eta squared show zero to small effect size between these groups.
Discussion
In this second study we aimed to compare means across gen-der, age, and exercise activities, thus, results showed differ-ences among all groups. As explained by Vlachopoulos et al. (2013), distinct characteristics between individuals could lead to different motives for exercise participation. Results corrob-orate with this statement and will be discussed according to past literature.
Participants in current study listed stress management, re-vitalization, enjoyment, positive health, and agility as their top motives for engaging in regular exercise. This results are sim-ilar to previous research (Egli et al.2011; Ferrand et al.2008; Smith et al.1998), showing that psychological motives (stress management, revitalization, enjoyment), general health (posi-tive health), and agility (physical fitness) are among the top reasons for people to endorse in regular exercise. However, male and female practice for different reasons. In fact, only five of fourteen motives had no significant differences be-tween gender, namely: enjoyment, challenge, health pressure, ill-health avoidance, and affiliation. As stated by Vlachopoulos et al. (2013), women are more often motivated to endorse in exercising due to body image perception or social interaction compared to men. On the other hand, it
Table 5 Measurement invariance between samples and gender
χ2 df Δ χ2 Δdf B-S p CFI ΔCFI RMSEA ΔRMSEA SRMR ΔSRMR Calibration and Validation sample
Configural 8350.874 2070 – – <.001 .907 – .052 – .054 – Metric 8350.914 2100 .04 30 <.001 .906 .001 .054 .002 .054 .000 Scalar 8351.078 2210 .20 140 <.001 .906 .001 .054 .002 .055 .001 Residual 8351.296 2260 .42 190 <.001 .904 .003 .056 .004 .058 .004 Female and Male sample
Configural 8199.312 2070 – – <.001 .904 – .055 – .055 – Metric 8281.198 2100 81.89 30 <.001 .903 .001 .053 .002 .058 .003 Scalar 8588.247 2210 388.92 140 <.001 .901 .003 .054 .001 .063 .008 Residual 9048.644 2260 849.33 190 <.001 .896 .008 .065 .010 .065 .010 B-S p Bollen-Stine level of significance,ΔCFI differences in CFI, ΔRMSEA differences in RMSEA, ΔSRMR differences in SRMR
seems that men prefer exercising for competition, physical fitness, and health equated to women. As results show, male exercisers are more intrinsically oriented for physical activity practice, whereas female do it for extrinsic reasons. Intrinsic motives are related to self-determined motivation, explaining that individuals who act on a certain behavior for the pleasure of doing it so are more likely to experience positive outcomes (Ryan & Deci,2017). On the other hand, it seems that indi-viduals who engage in exercise for extrinsic reasons are more endeavor to withdrawal (Sebire et al.2008). Therefore, under-standing why male and female engage in exercise is of upmost importance (Craft et al.2014).
Results showed that young adults are more interested in pleasure, strength and endurance, and appearance compared to middle-aged adults. These results contradict past findings (Brunet and Sabiston2011; Molanorouzi et al.2015) showing that young individuals interest in others perception of self-image, enjoy exercising, and want to improve physical fitness. Looking at middle-aged adult aspirations for exercising, health pressure and revitalization represented the top reasons.
The increase of non-communicable disease related to aging, physical inactivity, sedentary behaviors, as well as profession-al pressure could explain present findings (Brooks and Ferro
2012; Din et al. 2015). Last, elderly rank highly general health, enjoyment, and revitalization supporting past literature (Gutierrez et al.2018; Kolt et al.2004) investigating the rea-sons in older adults for regular exercise. Thus, it is rational to expect present results would show more concern for physical and psychological health, since it impacts more their decisions to engage in exercise over time. Current results suggest chang-es in motivchang-es during life-span, based on several studichang-es (Buhler1967; Ingledew et al.1998).
Looking at exercise activities, fitness group classes and water activities show differences in stress management, challenge, and competition. Water activities reported higher means and could be explained by the activities performed in the swimming pool. We encompassed recreational activities such as water gymnastic with swimming lessons. Exercisers with swimming lessons may have recreational competitions as a way of testing their skills. Clancy et al. (2017) have shown
Table 6 Mean differences
between gender G M SD t p CI95% d
Lower Upper Stress Management F M 3.91 3.31 .98 1.17 −6.17 ** −.79 −.41 .59 Revitalization F M 4.09 3.84 .79 .76 −3.53 ** −.40 −.11 .32 Enjoyment F M 3.73 3.59 .96 .97 −1.58 .11 −.32 .03 .14 Challenge F M 2.33 2.49 1.17 1.18 1.44 .15 −.06 .37 .13 Health Pressure F M 1.75 1.65 1.41 1.35 −0.78 .44 −.36 .15 .07 Positive Health F M 4.29 4.10 .76 .74 −2.72 ** −.33 −.05 .25 Ill-Health Avoidance F M 3.60 3.47 1.03 1.00 −1.43 .15 −.32 .05 .13 Agility F M 3.81 3.57 .88 .97 −2.82 ** −.41 −.07 .26 Strength and Endurance F
M 3.37 3.55 .96 1.01 2.02 * .00 .36 .18 Affiliation F M 2.49 2.43 1.18 1.31 −.50 .61 −.28 .17 .05 Social Recognition F M .91 1.41 1.03 1.27 4.92 ** .31 .72 .43 Competition F M 1.41 2.23 1.21 1.44 6.73 ** .58 1.05 .66 Weight Management F M 3.44 2.85 1.06 1.21 −.66 ** −.79 −.38 .52 Appearance F M 3.15 2.55 1.16 1.35 −5.27 ** −.83 −.38 .48 G Gender, M Mean, SD Standard Deviation, t t-test value, p level of significance, d effect size; * p≤ .05; ** p≤ .01; degrees of freedom = 512
that people who play sports have a tendency to focus on chal-lenging motives. Hence, forthcoming studies should separate water activities and compare samples among activities.
Cardio/resistance training showed differences in health pressure, ill-health avoidance and appearance compared to water activities. Health status and body image seems to be more important for exercisers who like lifting weights com-pared to those swimming or doing water gymnastics. Considering researchers professional view with current fitness trends, most of modern gym clients search for aesthetics at the cardio/weightlifting room. In fact, when talking about body
image/aesthetics, it is predominantly associated with strength training and cardio and not with water activities. Several stud-ies (Rica et al.2018; SantaBarbara et al.2017; Seguin et al.
2013) corroborate with this statement explaining that individ-uals who lift weights or do cardio search and have a better body image satisfaction. Differences found in health pressure and ill-health avoidance motives are surprising, since both types of exercise have shown similar results, for example in knee osteoarthritis treatment (Dong et al.2018) or in chronic low back pain easement (Sugano and Nomura 2000). One hypothesis may rely on health professionals exercise
Table 7 One-way ANOVA results across age groups
G M SD L F# Differences p CI95% η2 Lower Upper Stress Management YA MA EL 3.75 3.59 3.78 1.06 1.15 .93 1.37 1.13 YA– MA YA– EL MA - EL .27 .99 .79 −.09 −.69 −.88 .42 .65 .50 .01 Revitalization YA MA EL 4.09 3.81 3.91 .70 .99 .71 10.16** 6.92 YA– MA YA– EL MA - EL ** .65 88 .10 −30 −.61 .47 .67 .40 .03 Enjoyment YA MA EL 3.83 3.34 3.35 .87 1.09 1.10 7.06** 14.99 YA– MA YA– EL MA - EL ** .13 .99 .28 −.10 −.62 .72 1.07 .59 .06 Challenge YA MA EL 2.48 2.19 2.03 1.16 1.17 1.21 .03 3.89 YA– MA YA– EL MA - EL 03 .32 .88 .02 −28 −.59 .56 1.17 .90 .02 Health Pressure YA MA EL 1.45 2.27 2.82 1.27 1.44 1.68 3.12* 24.50 YA– MA YA– EL MA - EL ** ** .28 −1.13 −2.20 −1.40 −.51 −.55 .30 .09 Positive Health YA MA EL 4.28 4.12 4.07 .71 .86 .74 3.39* 2.75 YA– MA YA– EL MA - EL .07 .53 .97 −.01 −.25 −.43 .34 .68 .53 .01 Ill-Health Avoidance YA MA EL 3.44 3.80 4.11 1.04 .93 .69 2.17 8.78 YA– MA YA– EL MA - EL ** .03 .50 −.59 −1.29 −.95 −.12 −.04 .33 .03 Agility YA MA EL 3.78 3.62 3.47 .86 1.03 1.03 1.91 2.09 YA– MA YA– EL MA - EL .20 .40 .81 −.06 −.26 −.43 .37 .88 .74 .01 Strength and Endurance YA MA EL 3.54 3.15 3.42 .91 1.09 1.10 2.68 7.91 YA– MA YA– EL MA - EL ** .89 .58 .16 −.48 −.88 .61 .72 .35 .03 Affiliation YA MA EL 2.54 2.34 2.03 1.19 1.27 1.59 2.21 2.43 YA– MA YA– EL MA - EL .21 .26 .64 −.08 −.25 −.48 .49 1.27 1.08 .01 Social Recognition YA MA EL 1.03 1.16 1.43 1.08 1.27 1.32 5.00** 1.49 YA– MA YA– EL MA - EL .45 .36 .65 −.40 −1.12 −1.00 .13 .30 .46 .01 Competition YA MA EL 1.71 1.63 1.58 1.34 1.37 1.38 .009 .21 YA– MA YA– EL MA - EL .83 .93 .99 −.24 −.71 −.81 .39 .96 .91 .00 Weight Management YA MA EL 3.33 3.07 2.97 1.13 1.15 1.19 .056 3.12 YA– MA YA– EL MA - EL .06 .45 .95 −.01 −.35 −.63 .53 1.07 .83 .01 Appearance YA MA EL 3.11 2.60 2.36 1.17 1.39 1.45 6.37** 10.56 YA– MA YA– EL MA - EL ** .05 .76 .23 −.01 −.55 .81 1.52 1.03 .04
G Gender, M Mean, SD Standard Deviation, L Levene test, F F value, p level of significance,η2partial eta squared, YA Young Adults, MA Middle-aged
recommendations. Given the fact that not all gym and fitness centers are equipped with swimming pools, and since walking/running is economically cheaper, health and exercise professionals may suggest individuals to do cardio at the treadmill or outdoor. However, this statement is purely spec-ulative and forthcoming studies should analyze in more detail differences between exercise activities.
Current findings suggest that people endorsing in fitness group classes search for affiliation and acceptance compared to those working out in the cardio/resistance machine room. In an empirical view, a sense of belonging is expressive in those
individuals who do high intensity group classes, and in present study this group was composed predominantly of women (80%). As stated by Markland and Ingledew (1997), women are more likely to seek social aspirations compared to men and this could have influenced present results. On the other hand, it seems that people bench pressing or squatting do not expe-rience the need to feel affiliate or integrated in a group. Nevertheless, as expressed by Ryan and Deci (2017) related-ness (i.e., sense of belonging, connection with other people) is important as it forecast intrinsic motivation, leading to posi-tive outcomes such as physical exercise commitment and
Table 8 One-way ANOVA results across exercise activities
G M SD L F# Differences P CI95% η2 Lower Upper Stress Management FG WA CR 3.87 3.60 3.74 .94 1.15 1.07 1.79 2.94 FG– WA FG– CR WA– CR .04 .60 .45 .01 −.18 −.42 .54 .44 .14 .01 Revitalization FG WA CR 4.09 4.01 3.93 .74 .79 .86 1.85 1.35 FG– WA FG– CR WA– CR .64 .23 .60 −.12 −.07 −.12 .27 .39 .29 .01 Enjoyment FG WA CR 3.70 3.73 3.58 .93 .96 1.03 .31 1.02 FG– WA FG– CR WA– CR .96 .56 .34 −.27 −.16 −.10 .21 .40 .40 .00 Challenge FG WA CR 2.19 2.55 2.30 1.13 1.22 1.09 1.49 4.87 FG– WA FG– CR WA– CR .01 .71 .12 −.65 −.45 −.05 −.08 .22 .55 .02 Health Pressure FG WA CR 1.73 1.55 2.03 1.47 1.29 1.45 3.78* 5.00 FG– WA FG– CR WA– CR .43 .18 ** −.16 −.70 −.84 .52 .10 −12 .02 Positive Health FG WA CR 4.27 4.22 4.20 .76 .79 .69 1.91 .26 FG– WA FG– CR WA– CR .86 .77 .96 −.14 −.15 −.17 .23 .28 .22 .00 Ill-Health Avoidance FG WA CR 3.55 3.47 3.77 1.02 1.09 .82 6.73** 3.78 FG– WA FG– CR WA– CR .72 .17 .02 −.17 −.51 −.57 .33 .07 −04 .02 Agility FG WA CR 3.77 3.72 3.69 .94 .93 .85 .10 .29 FG– WA FG– CR WA– CR .82 .74 .97 −.17 −.18 −.21 .28 .35 .26 .00 Strength and Endurance FG WA CR 3.32 3.55 3.31 1.06 .96 .89 .76 3.82 FG– WA FG– CR WA– CR .06 .97 .06 −.47 −.27 −.01 .01 .29 .49 .02 Affiliation FG WA CR 2.65 2.46 2.28 1.16 1.24 1.25 1.72 3.12 FG– WA FG– CR WA– CR .32 .03 .34 −.12 .02 −.13 .49 .72 .50 .01 Social Recognition FG WA CR .98 1.12 1.09 1.11 1.18 1.10 1.25 .76 FG– WA FG– CR WA– CR .44 .71 .95 −.43 −.44 −.26 .13 .22 .33 .00 Competition FG WA CR 1.49 1.82 1.65 1.26 1.43 1.26 4.23* 2.78 FG– WA FG– CR WA– CR .05 .62 .47 −.66 −.54 −.17 .00 .23 .52 .01 Weight Management FG WA CR 3.32 3.29 3.08 1.15 1.15 1.13 .02 1.845 FG– WA FG– CR WA– CR .97 .19 .21 −.25 −.09 −.08 .31 .57 .51 .01 Appearance FG WA CR 2.90 2.64 3.13 1.27 1.28 1.22 1.54 6.58 FG– WA FG– CR WA– CR .19 .20 ** −.54 −.09 .17 .08 .62 .82 .03
G Groups, M Mean, SD Standard Deviation, L Levene test, F F value, p level of significance,η2partial eta squared, FG Fitness Group classes, WA Water
well-being. Therefore, it is essential human interaction and supporting interpersonal behaviors by peers and fitness pro-fessionals so that no one should perceive“loneliness” when exercising (Rocchi and Pelletier2018).
General Discussion
In overall, the EMI-2 seems to be a reliable instrument assessing exercise motives in Portuguese individuals. However, different people have different motives and exercise professionals should support individual reasons for exercising and not impose one’s ideals on others. Exercise professionals should be attentive to this situation when questioning individ-uals for their motives. If they perceive that the gym client is exercising for extrinsic motives (e.g., for social recognition), it could be of importance to guide them from extrinsic to intrin-sic reasons, keeping always in mind that they can exercise for both types, and that this could be positive in some moments. Fitness group instructors and personal trainers need to be aware of differences between individuals (gender, age, exer-cise activity) when encouraging exerexer-cise within population. For example, in group class activities (e.g., indoor cycling, aerobics, step) exercise professionals might pay attention to different aspects of gym clients characteristics, because stud-ies have enlightened that physical activity levels decline more in female than male when both participated together in mixed-gender classes (Molanorouzi et al.2014,2015).
Limitations and Future Agenda
Present research has some limitations that should be ad-dressed. First, this study had a cross-sectional design and longitudinal/experimental studies can be helpful in measuring temporal/longitudinal invariance. Nonetheless, our analysis supports the original fourteen motive instrument, exhibiting a good reliability in Portuguese exercisers. We agree in an empirical manner with Markland and Hardy (1993) that mo-tives for exercise participation could change over time. A per-son who engages in physical for the first time could be en-dorsed mainly for health motives but after exercising regular-ly, some other reasons could arise such as stress management or enjoyment. Thus, future studies should make an effort and analyze the reasons for the practice of exercise over time.
Second, forthcoming studies are needed to test possible multidimensionality. Although the present second-order mod-el falls short on achieving fit, reviewing this scale using ad-vanced methodological approaches such as Exploratory Structural Equation Modelling (Muthén and Muthén2010) could explain factor dimensionality. More multi-group analy-sis, namely latent mean differences procedures, are recom-mended to measure how exercise motives are perceived by different groups.
Last, future research should examine in detail how each motive predicts self-determined motivation, according to Self-Determination Theory (Ryan and Deci 2017) in exercise context. We speculate that self-endorsed focused motives (fo-cus on how the person feels about himself) could predict more autonomous forms of motivation, contrarily to other-endorsed focused motives (focus on how others perceive me or how I could be accepted by others) possibly will forecast more con-trolled forms of motivation. Although this assertion is specu-lative, some research (Ingledew and Markland 2008; Ingledew et al.2014) does support our hypothesis.
Conclusion
The uniqueness of this study is to emphasize the proper use of a valid and invariant instrument for measuring exercise mo-tives participation. Overall, present findings support factorial and construct validity of the original first-order EMI-2, pro-viding new literature for construct distinctiveness of fourteen exercise motives. In addition, the model was invariant across calibration and validation sample and gender presenting a measurement equivalence. Exercise participation depends on individual characteristics, where men are more focused on intrinsic reasons (e.g., health, revitalization, physical fitness) and women more on extrinsic reasons (e.g., social recognition, body image). In addition, current study showed that age and gym activities influence exercise motives. This was the first research testing mean differences between age groups and exercise activities, thus more studies are needed to assess dif-ferences in other characteristics (e.g., economic status, low-cost vs premium fitness center). Scale analysis is a constant process; hence, future studies will increase our understanding on exercise motives assessment.
Funding Information This work was supported by the National Funding through the Portuguese Foundation for Science and Technology, I.P., under the project UID/DTP/04045/2019.
Conflict of Interest
None.Approval Approval from the Ethical Committee (CE-UBI-pJ-2018-044:ID683) was obtained.
References
Alves, J., & Lourenço, A. (2003). Tradução e adaptação do Questionário de Motivação para o Exercício (Exercise Motivation Inventory 2– EMI2). Desporto, Investigação & Ciência, 2, 3–11.
Baptista, P., Monteiro, D., Alves, S., Cid, L., & Moutão, J. (2014). Desenvolvimento e validação de uma versão reduzida do Exercise Motivation Inventory-2p. Revista da UIIPS, 2(2), 175–189http:// hdl.handle.net/10400.15/1913.
Brooks, J., & Ferro, A. (2012). The physician's role in prescribing phys-ical activity for the prevention and treatment of essential hyperten-sion. JRSM Cardiovascular Disease, 1(4).https://doi.org/10.1258/ cvd.2012.012012.
Brunet, J., & Sabiston, C. (2011). Exploring motivation for physical ac-tivity across the adult lifespan. Psychology of Sport and Exercise, 12(2), 99–105.https://doi.org/10.1016/j.psychsport.2010.09.006. Buhler, C. (1967). Human life goals in the humanistic perspective.
Journal of Humanistic Psychology, 1, 36–52.https://doi.org/10. 1177/002216786700700105.
Byrne, B. (2016). Structural equation modeling with AMOS. Basic con-cepts, applications, and programming (3rd ed.). New York: Taylor & Francis Group, LLC.
Cham, H., Reshetnyak, E., Rosenfeld, B., & Breitbart, W. (2017). Full information maximum likelihood estimation for latent variable in-teractions with incomplete indicators. Multivariate Behavioral Research, 52(1), 12–30.https://doi.org/10.1080/00273171.2016. 1245600.
Chen, F. (2007). Sensitivity of goodness of fit indexes to lack of mea-surement invariance. Structural Equation Modeling: A Multidisciplinary Journal, 14(3), 464–504.https://doi.org/10.1080/ 10705510701301834.
Chen, F. (2008). What happens if we compare chopsticks with forks? The impact of making inappropriate comparisons in cross-cultural re-search. Journal of Personality & Social Psycholgy, 95(5), 1005– 1018.https://doi.org/10.1037/a0013193.
Cheung, G., & Rensvold, R. (2002). Evaluating goodness-of-fit indexes for testing measurement invariance. Structural Equation Modeling: A Multidisciplinary Journal, 9(2), 233–255.https://doi.org/10.1207/ s15328007sem0902_5.
Cid, L., Silva, C., & Alves, J. (2007). Actividade física e bem-estar psicológico - perfi l dos participantes no programa de exercício e saúde de rio maior. Motricidade, 3(2), 47–55.
Clancy, R., Herring, M., & Campbell, M. (2017). Motivation measures in sport: A critical review and bibliometric analysis. Frontiers in Psychology, 8, 348.https://doi.org/10.3389/fpsyg.2017.00348. Cohen, J. (1988). A power primer. Psychological Bulletin, 112(1), 155–
159.https://doi.org/10.1037/0033-2909.112.1.155.
Craft, B., Carroll, H., & Lustyk, M. (2014). Gender differences in exer-cise habits and quality of life reports: Assessing the moderating effect of reasons for exercise. International Journal of Libreral Art & Social Science, 2(5), 65–76.
Dacey, M., Baltzell, A., & Zaichkowsky, L. (2008). Older adults’ intrinsic and extrinsic motivation toward physical activity. American Journal of Health Behavior, 32(6), 570–582.https://doi.org/10.5555/ajhb. 2008.32.6.570.
Din, N., Moore, G., Murphy, S., Wilkinson, C., & Williams, N. (2015). Health professionals' perspectives on exercise referral and physical activity promotion in primary care: Findings from a process evalu-ation of the Nevalu-ational Exercise Referral Scheme in Wales. Health Education Journal, 74(6), 743–757. https://doi.org/10.1177/ 0017896914559785.
DiStefano, C., & Hess, B. (2016). Using confirmatory factor analysis for construct validation: An empirical review. Journal of Psychoeducational Assessment, 23(3), 225–241.https://doi.org/10. 1177/073428290502300303.
Dong, R., Wu, Y., Xu, S., Zhang, L., Ying, J., Jin, H., Wang, P., Tong, X. L., & P. (2018). Is aquatic exercise more effective than land-based exercise for knee osteoarthritis? Medicine (Baltimore), 97(52), e13823.https://doi.org/10.1097/MD.0000000000013823. Duda, J., & Tappe, M. (1988). Predictors of personal investment in
phys-ical activity amon middle-aged and older adults. Perceptual & Motor Skills, 66(2), 543–549.https://doi.org/10.2466/pms.1998. 66.2.543.
Egli, T., Bland, H., Melton, B., & Czech, D. (2011). Influence of age, sex, and race on college students' exercise motivation of physical
activity. Journal of American College Health, 59(5), 399–406.
https://doi.org/10.1080/07448481.2010.513074.
Ferrand, C., Perrin, C., & Nasarre, S. (2008). Motives for regular physical activity in women and men: A qualitative study in French adults with type 2 diabetes, belonging to a patients' association. Health & Social Care in the Community, 16(5), 511–520.https://doi.org/10. 1111/j.1365-2524.2008.00773.x.
Frederick, C., & Ryan, R. (1993). Differences in motivation for sport and exercise and their relations with participation and mental health. Journal of Sport Behavior, 16(3), 124–146.
Gutierrez, M., Calatayud, P., & Tomas, J. (2018). Motives to practice exercise in old age and successful aging: A latent class analysis. Archives of Gerontology and Geriatrics, 77, 44–50.https://doi.org/ 10.1016/j.archger.2018.04.003.
Hair, J., Black, W., Babin, B., & Anderson, R. (2014). Multivariate Data Analysis (7th ed.). New Jersey: Pearson Educational, Inc. Ho, R. (2014). Handbook of univariate and multivariate data analysis
with IBM SPSS (2nd ed.). New York: CRC Press.
Ingledew, D., & Markland, D. (2008). The role of motives in exercise participation. Psychology & Health, 23(7), 807–828.https://doi.org/ 10.1080/08870440701405704.
Ingledew, D., Markland, D., & Medley, A. (1998). Exercise motives and stages of change. Journal of Health Psychology, 3(4), 477–489.
https://doi.org/10.1177/135910539800300403.
Ingledew, D., Markland, D., & Strömmer, S. (2014). Elucidating the roles of motives and gains in exercise participation. Sport Exercise and Performance Psychology, 3(2), 116–131.https://doi.org/10.1037/ spy0000004.
Kenny, D., & McCoach, D. (2003). Effect of the number of variables on measures of fit in structural euqation modeling. Structural Equation Modeling: A Multidisciplinary Journal, 10, 333–351.https://doi. org/10.1207/S15328007SEM1003_1.
Klain, I., De Matos, D., Cid, L., Aidar, F., Leitão, J., & Moutão, J. (2015). Evidências de validade da versão brasileira do Exercise Motivation Inventory-2 em contexto de academia e personal training. Motricidade, 11(2), 62–74.https://doi.org/10.6063/motricidade. 3551.
Kolt, G., Driver, R., & Giles, L. (2004). Why older Australians participate in exercise and sport. Journal of Aging and Physical Activity, 12(2), 185–198.https://doi.org/10.1123/japa.12.2.185.
Markland, D., & Hardy, L. (1993). The exercise motivations inventory: Preliminary development and validity of a measure of individuals' reasons for participation in regular physical exercise. Personality & Individual Differences, 15(3), 286–296.https://doi.org/10.1016/ 0191-8869(93)90219-S.
Markland, D., & Ingledew, D. (1997). The measurement of exercise mo-tives: Factorial validity and invariance across gender of a revised exercise motivations inventory. British Journal of Health Psychology, 2(4), 361–376.https://doi.org/10.1111/j.2044-8287. tb00549.x.
Markland, D., & Ingledew, D. (2007). Exercise participation motives: A self-determination theory perspective. In M. Hagger & N. Chatzisarantis (Eds.), Intrinsic motivation and self-determination in exercise and sport (pp. 302–305). Champaign: Human Kinetics. Marsh, H., Hau, K., & Wen, Z. (2004). In search of Golden rules: Comment on hypothesis-testing approaches to setting cutoff values for fit indexes and dangers in overgeneralizing Hu and Bentler's ( 1 9 9 9 ) f i n d i n g s . S t r u c t u r a l E q u a t i o n M o d e l i n g : A Multidisciplinary Journal, 11(3), 320–341.https://doi.org/10.1207/ s15328007sem1103_2.
Meredith, W. (1993). Measurement invariance, factor analysis and facto-r i a l i n v a facto-r i a n c e . P s y c h o m e t facto-r i k a , 58 (4), 52 5-54 3. Doi: 1007/BF02294825.
Molanorouzi, K., Khoo, S., & Morris, T. (2014). Validating the physical Acitivty and leisure motivation scale. BMC Public Health, 14(909), 1–12.https://doi.org/10.1186/1471-2458-14-909.
Molanorouzi, K., Khoo, S., & Morris, T. (2015). Motives for adult par-ticipation in physical activity: Type of activity, age, and gender. BMC Public Health, 15, 66. https://doi.org/10.1186/s12889-015-1429-7.
Muthén, L., & Muthén, B. (2010). Mplus User's Guide. Los Angeles: Muthén & Muthén.
Nevitt, J., & Hancock, G. (2001). Performance of bootstrapping ap-proaches to model test statistics and parameter standard error esti-mation in structural equation modeling. Structural Equation Modeling: A Multidisciplinary Journal, 8(3), 353–377.https://doi. org/10.1207/s15328007sem0803_2.
Ortís, L., Maymí, J., Feliu, J., Vidal, J., Romero, E., Bassets, M., ... Brosa, J. (2007). Exercise motivation in university community members: A behavioural intervention. Psicothema, 19(2), 250–255.
Petry, B. (2002). A comparison of young, middle-aged, and older adult treatment-seeking pathological gamblers. The Gerontologist, 42(1), 92–99.
Podsakoff, P. M., MacKenzie, S. B., Lee, J. Y., & Podsakoff, N. P. (2003). Common method biases in behavioral research: A critical review of the literature and recommended remedies. Journal of Applied Psychology, 88(5), 879–903.https://doi.org/10.1037/0021-9010. 88.5.879.
Raykov, T. (1997). Estimation of composite reliability for congeneric measures. Applied Psychological Measurement, 21(2), 173–184.
https://doi.org/10.1177/01466216970212006.
Rica, R., Gama, E., Machado, A., Alonso, A., Evangelista, A., Figueira-Junior, A., Zanetti, M., Brandão, R., Miranda, M. L. J., Alves, J. V., Bergamin, M., & Bocalini, D. (2018). Does resistance training im-prove body image satisfaction among the elderly? A cross-sectional study. Clinics (São Paulo, Brazil), 73, e290.https://doi.org/10.6061/ clinics/2018/e290.
Roberts, S., Reeves, M., & Ryrie, A. (2014). The influence of physical activity, sport and exercise motives among UK-based university students. Journal of Further and Higher Education, 39(4), 598– 607.https://doi.org/10.1080/0309877x.2014.938265.
Rocchi, M., & Pelletier, L. (2018). How does coaches’ reported interper-sonal behavior align with athletes’ perceptions? Consequences for female athletes’ psychological needs in sport. Sport, Exercise, & Performance Psychology, 7(2), 141–154.https://doi.org/10.1037/ spy0000116.
Ryan, R., & Deci, E. (2017). Self-determination theory. Basic Psychological Needs in Motivation, Development, and Wellness: New York: Guildford Press.
Ryan, R., Frederick, C., Lepes, D., Rubio, N., & Sheldon, K. (1997). Intrinsic motivation and exercise adherence. International Journal of Sport Psychology, 28(4), 335–354.
SantaBarbara, N., Whitworth, J., & Ciccolo, J. (2017). A systematic re-view of the effects of resistance training on body image. Journal of Strength & Conditioning Research, 31(10), 2880–2888.https://doi. org/10.1519/JSC.0000000000002135.
Sass, D. (2011). Testing measurement invariance and comparing latent factor means within a confirmatory factor analysis framework. Journal of Psychoeducational Assessment, 29(4), 347–363.https:// doi.org/10.1177/0734282911406661.
Schmitt, T. A. (2011). Current methodological considerations in explor-a t o r y explor-a n d c o n f i r m explor-a t o r y f explor-a c t o r explor-a n explor-a l y s i s . J o u r n explor-a l o f Psychoeducational Assessment, 29(4), 304–321.https://doi.org/10. 1177/0734282911406653.
Sebire, S., Standage, M., & Vansteenkiste, M. (2008). Development and validation of the goal content for exercise questionnaire. Journal of Sport & Exercise Psychology, 30(4), 353–377.https://doi.org/10. 1123/jsep.30.4.353.
Seguin, R., Eldridge, G., Lynch, W., & Paul, L. (2013). Strength training improves body image and physical activity behaviors among midlife and older rural women. Journal of Extension, 51(4), 4FEA2. Smith, B., Handley, P., & Eldredge, D. (1998). Sex differences in exercise
motivation and body-image satisfaction among college students. Perceptual & Motor Skills, 86(2), 723–732.https://doi.org/10. 2466/pms.1998.86.2.723.
Sugano, A., & Nomura, T. (2000). Influence of water exercise and land stretching on salivary cortisol concentrations and anxiety in chronic low back pain patients. Journal of Physiological Anthropology and Applied Human Science, 19(4), 175–180.
Vlachopoulos, S., Asci, F., Cid, L., Ersoz, G., González-Cutre, D., Moreno-Murcia, J., & Moutão, J. (2013). Cross-cultural invariance of the basic psychological needs in exercise scale and need satisfac-tion latent mean differences among Greek, Spanish, Portuguese and Turkish samples. Psychology of Sport and Exercise, 14(5), 622–631.
https://doi.org/10.1016/j.psychsport.2013.03.002.
Publisher’s Note Springer Nature remains neutral with regard to jurisdic-tional claims in published maps and institujurisdic-tional affiliations.