MASTER IN FINANCE
THIS REPORT WAS PREPARED EXCLUSIVELY FOR ACADEMIC PURPOSES BY JOÃO BERNARDO SANTOS ALVES, A MASTERS IN FINANCE STUDENT OF THE NOVA SCHOOL OF BUSINESS AND ECONOMICS.THE REPORT WAS SUPERVISED BY MARTIJN BOONS, ACTING IN A
▪ WFM is overvalued given that the price delivered by an
intense analysis is $30,21 which is 13,67% lower than the
market value on 31st of May 2017. Furthermore, the remaining
methodologies used to give robustness to the model also yielded values lower than $34,99.
▪ Current environment in natural and organic sector is
tough with an increasing competition due to the entrance of large
national supermarket chains and the deterioration of gross margins as a result of price investments and deflation environment.
▪ The reaction of WFM to the current industry conditions
has been through the following measures: creation of a store concept (“365 Stores”), e-commerce, reduction of cost structure and a more aggressive marketing and advertising strategy.
▪ On 16th of June it was announced the WFM’s acquisition
from Amazon which was concluded on 29th of August. Jeff Bezos
company paid $42 per share which corresponds to a premium of
20% compared to stock price on 31st of May and 39% compared to the analyst valuation. So, why did Amazon pay that premium? Excess of liquidity, cross-selling, the incorporation of a new sales channel (brick-and-mortar stores) and possibility to scale and leverage the WFM’s business are some of the explanations.
Brief company description
WFM is the largest supermarket chain of natural and organic foods in the US. The company was founded in 1980 in Austin and nowadays it is operating in three countries (US, Canada and UK) with a total of 456 stores. WFM offers a broad selection of natural and organic products with a strong emphasis on perishable foods.
W
HOLE
F
OODS
M
ARKET
C
OMPANY
R
EPORT
G
ROCERY
S
TORES
4
J
ANUARY2019
S
TUDENT
:
J
OÃO
B
ERNARDO
S
ANTOS
A
LVES
30160@novasbe.pt
America’s Transaction of the Year
How Amazon is shaping the grocery retail market
Valuation: OVERVALUED
Recommended Price: 30.21 $
Price (as of 31-May-2017) 34.99 $
Reuters: WFM.O, Bloomberg: WFM US Equity
52-week range ($) 27.96-37.03 Market Cap ($m) 11,205 Outstanding Shares (m) 320.025 Source: Source: Bloomberg (Values in $ millions) 2016 2017F 2018F Revenues 15724 15909 16602 EBITDA 1355 1313 1406 EBIT 857 825 878 Net Profit 507 471 504 EBITDA margin 8,6% 8,3% 8,5% EPS 0,54 0,51 0,54 ROIC 8,8% 8,0% 8,0% ROE 15,5% 14,8% 14,0% RR 85,0% 62,2% 79,2% FCF 227,68 209,68 128,37
WHOLE FOODS MARKET COMPANY REPORT
Table of Contents
EXECUTIVE SUMMARY ... 3
COMPANY OVERVIEW ... 4
COMPANY DESCRIPTION ... 4 MANAGEMENT TEAM ... 5 SHAREHOLDER STRUCTURE ... 6 STOCK PERFORMANCE ... 6VALUE DRIVERS ... 7
BRAND VALUE ... 7OPENING NEW STORES ... 7
365STORES ... 8
PRICE INVESTMENTS... 8
PREPARED FOODS AND BAKERY ... 9
ONLINE CHANNEL ... 9
MACROECONOMIC ANALYSIS ... 9
INDUSTRY OVERVIEW ...11
PORTER’S ANALYSIS ... 12
COMPETITION &PEER GROUP ... 13
FORECASTS ...14
REVENUES ... 14
GROSS MARGIN ... 17
COSTS ... 18
NET WORKING CAPITAL ... 20
CAPEX AND CAPITALIZED OPERATING LEASES ... 21
ROICANALYSIS ... 22
VALUATION ...23
DCF ... 23
MULTIPLE VALUATION ... 24
SUMMARY OF DIFFERENT EQUITY VALUES ... 25
SENSITIVITY AND SCENARIO ANALYSIS ... 25
BUSINESS RISKS ...27
TRANSACTION ...27
APPENDIX ...29
WHOLE FOODS MARKET COMPANY REPORT
Executive Summary
My advisor recommended me to develop an Equity Report about a company that had been acquired at a short time ago in order to relate the Work Project with my job in KPMG (Deal Advisory). The purpose would be to compare my analysis with the market price at that time and with the transaction value. Consequently, I have chosen one of the transactions of 2017: the acquisition of WFM by Amazon. Whole Foods Market (WFM) is an American corporation which operates exclusively in the natural and organic products industry. Founded in 1980 in Austin, Texas, 37 years later represents part of the American retail industry having more than 450 stores spread over three different countries.
Despite being a premium brand focused on delivering high quality products to customers who highly value such product differentiation, WFM has been facing a few challenges in the last couple of years due to a paradigm change in its market. The deflation environment and the aggressive entrance of new players in the sector have been impacting WFM business, slowing down the growth pace of the company as well as its margins. This environment is challenging the dynamics of the company which is trying to react proactively to the market pressures, so it won’t be captured by new players.
The valuation of the company was computed through three different methodologies: Discounted Cash Flow (DCF) model, trading comps and precedent transactions. Each methodology yielded a different value but for the recommendation was chosen a final price given by DCF ($30,21). The price interval found through the methodologies above is [$26,90, $33,38] with a median of $31,02 and an average of $30,44. As of 31st of May, the share price was $34,99 and, consequently, the computed price lead to the conclusion that WFM share price was overvalued at this time.
In 29th of August of 2017, WFM was purchased by Amazon, an acquisition that had already been announced on 16th of June of the same year. The transaction value was $13,7 billion which means a value per share of $42. This represents a premium of 39% comparing to the analyst valuation and 20% regarding to the stock price on 31st May of 2017 ($34,99).
A more detailed information about the current and forecasted environment and WFM’s reaction to this big challenge together with some facts and figures about the company and its financials are presented in the next chapters. Ultimately, explanations regarding the premium paid by Amazon are also discussed in the following sections.
WHOLE FOODS MARKET COMPANY REPORT
Company Overview
Company Description
Whole Foods Market (WFM) is a retail chain headquartered in Austin, Texas
(United States) focused on natural and organic products which operates in three countries: US, Canada and UK. The share of each country in overall revenues can be seen in Figure 1. The first store was opened in Austin to the public in 1980 and in November 2016, WFM had 464 stores of which 444 were in the U.S., 11 in Canada and 9 in the UK. The WFM Initial Public Offering (IPO) was in 1992 at a price of $2,125 per share. In 2015, WFM created a new concept “365
stores” whose concept was to make stores smaller and cheaper.
The expansion to Canada took place in 2002 with the inauguration of its first international store in Toronto while the entrance in the UK market happened in 2007 with the opening of its first store in London. Its stores have an average size of 39000 gross square footage which corresponds to around 3623 square meters. Regarding product category, in the fiscal year 2016, 67% of sales were perishables (19% prepared foods and bakery and 48% other perishables) and the remaining non-perishables. These ratios have been stable over the last few years.
In the fiscal year 2016, revenues were $15,7 billion and EBITDA was around
$1,4 billion with a net income of $507 million. WFM was an industry-leader in sales per gross square foot with a value of $915. Furthermore, in the U.S.,
WFM is the market leader in natural and organic foods sector and the 10th largest food retailer overall based on 2015 sales rankings from Progressive Grocer. By analysing WFM past performance (Figure 2 and Figure 3), it is possible to conclude that although sales have been increasing every year since 2009, operating income and margins have been decreasing. This is a consequence of lower prices and consequently, lower margins of the company’s products. Moreover, the tougher environment in the industry is also reflected in the performance of comparable stores which also worsened in 2016 (Figure 4). The chain has around 87000 team members (as of September 2016) of which 69% are full-time workers with a turnover of 18%. In the last two decades, WFM has been recognized as one of the “100 Best Companies to Work for in
America” by FORTUNE’s magazine.
365 Everyday Value, Allegro Coffee and Whole Paws are some of WFM’s
exclusive brands. These together with temporary exclusive products are key
components of the differentiation and product innovation strategy adopted by
Figure 1: Revenue split by Geography Source: Annual Report
Figure 3: Company Performance Evolution Source: Annual Report
Figure 2: Net Sales ($bn) evolution
WHOLE FOODS MARKET COMPANY REPORT
WFM. The exclusive brands has increased its share in overall WFM sales and in the fiscal year of 2016, it represented around 15% of total retail sales.
Additionally, the retail chain has an important role for the communities where WFM is a bridge between suppliers and consumers. Thus, through Whole Planet Foundation, Whole Kids Foundation and Whole Cities Foundation, the company contributes to enhance the life of those facing major difficulties by providing microcredit to developing world communities that supply their stores, improving children’s nutrition, teaching, educating and supporting families and, lastly, supplying healthy food to poor communities. Finally, WFM is concerned about environmental sustainability and so, in 2014, the company announced its commitment to reduce 20% of its energy consumption by 2020.
Management Team
Over the last few months, there have been many changes on the Board of
Directors, on the Management Team and on how the top of hierarchy of the company is organized. The main one was the transition from co-Chief
Executive Officers (John Mackey and Walter Robb) to a sole CEO in January 2017, with the co-Founder John Mackey (63) embracing that role alone. Walter Robb (63) remained on the Company’s Board of Directors and continues to be responsible for Whole Kids and Whole Cities Foundations.
Another important amendment was the replacement of the Executive Vice President and CFO Glenda Flanagan. She served the company as CFO for 29 years, the longest serving female CFO in the Fortune 500. She retired and was replaced by Keith Manbeck (CFO effective May 2017) who was the former vice president of Kohl’s. Also, in May 2017, the chairman John B. Elstrott was replaced by Gabrielle Sulzberg, a private equity executive. Besides these main shifts, since November 2016, five new directors were nominated (Ken Hicks – former CEO of Foot Locker, Joe Mansuetto – founder and chairman of Morningstar, Sahron McCollam – former CFO of Best Buy, Scott Powers - a former vice president of State Street Corporation and Ronald Shaich – the founder and co-CEO of Panera Bread Company). In a board contemplating twelve directors, ten of them are independent, nine are current or former CEOs/CFOs and four are female.
There is a possibility that more adjustments can occur on the Board of Directors because one of WFM’s main shareholders (Jana Partners) is negotiating with the Board to add two directors since the fund argues that the company is in need of
even more “fresh blood”.
Figure 4: Comparable store sales growth Source: Annual Report
WHOLE FOODS MARKET COMPANY REPORT
The company has completely changed its top in an attempt to add more expertise and ideas to shape and prepare WFM for the new future conditions.
Shareholder Structure
According to Bloomberg, WFM is mainly owned by private institutional
investors (77,6%), followed by treasury shares (18,8%) which are shares
issued in the name of the company that are not outstanding. Besides these two big portions, individuals hold 1,42% of WFM and the remaining 0,98% is held by
employees (including indirect beneficial ownership, all directors and officers as a
group) - Figure 5. Yet it is important to highlight that the CEO John Mackey has 979 975 shares (as of April 2017) which corresponds to around 0,3%.
According to Orbis database and 10K quarterly report, the main shareholders (with more than 5% of the company) are the Vanguard Group (9,69%), Jana
Partners (it acquired 8,2% of WFM in April 2017) and also BlackRock, Inc with
8,15%.
In 2016 dividends were $0,54 per common share which shows a slight increase compared to the $0,52 in 2015. In 2013, the dividend was not in line with the remaining years due to an extraordinary payment of $1 during the 4th quarter. The expected dividend per common share for that year was $0,40 which would mean a dividend payout ratio of 27%. In the last two years, the dividend payout
ratio was around 35%. As will be referred below, WFM stock price has been
heavily decreasing since 2013. Consequently, believing its share price has been undervalued, since 2014 WFM has been repurchasing stocks as it can be seen in Figure 6.
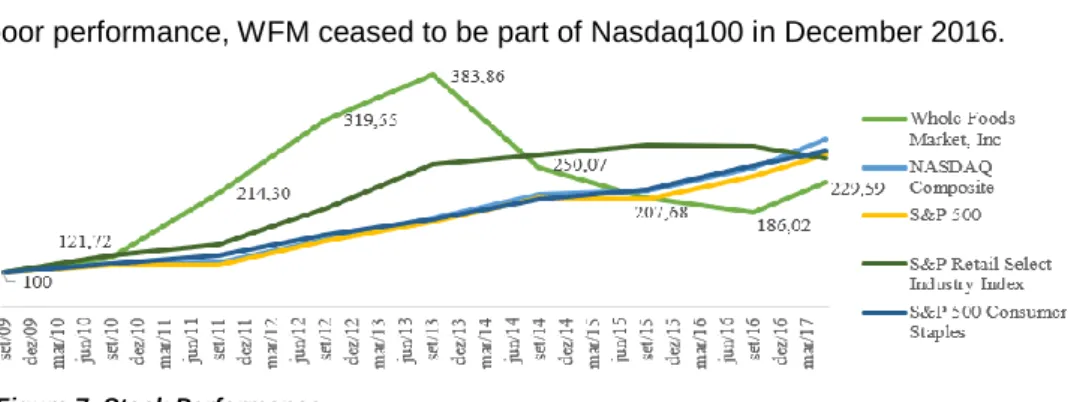
Stock Performance
Since the financial crisis, WFM’s share price can be split in two different
periods. The first one is until 2013, in which the company outperformed by far
the related indexes, Figure 7. This can be explained by the good results, the high growth rate and ambitious forecasts for the natural and organic niche market. However, since 2013, although main American stock indexes kept rising, Whole Foods Market experienced a free fall and lost around half of its market capitalization in 3 years (382,86 vs 186,02). This correction was due to worse results than those expected by shareholders, higher competition in the organic and natural products sector, food price deflation, waning store traffic and price investments (deteriorating gross margins). In the last two months, WFM’s share has been performing consistently well mainly due to the expectation of an
acquisition of WFM, after Jana Partners (a private equity fund) acquired
around 8% of the company. Overall, WFM has underperformed the related
Figure 5: Shareholder Structure Source: Annual Report & Bloomberg
2013 2014 2015 2016
EPS $ 1,48 $ 1,57 $ 1,49 $ 1,55
DPS $ 1,40 $ 0,48 $ 0,52 $ 0,54
Div. payout ratio 95% 31% 35% 35%
Total div. paid ($M)$ 519 $ 176 $ 186 $ 174
Share rep. ($M) $ 125 $ 578 $ 513 $ 944
Total payout ratio 117% 130% 130% 221%
Figure 6: Dividend & Share Information Source: Annual Report
WHOLE FOODS MARKET COMPANY REPORT
Figure 7: Stock Performance
Source: S&P Indices & Investing.com
indexes since 2009 as it is noticeable in Figure 7 and, as a consequence of, its poor performance, WFM ceased to be part of Nasdaq100 in December 2016.
Value Drivers
Brand Value
WFM has been building a strong brand since its inception with an excellent reputation where customers feel it is reliable to purchase high quality products which allows WFM to sell at higher prices than its competitors. The new industry conditions obliged WFM to invest in advertising to promote its unique qualities and remember customers why they should pay more to shop in WFM instead of going to a competitor and pay considerably less. Furthermore, WFM is also focused on gathering data and marketing information in order to optimize supermarket organization and product selection to retain its customers and maximize its sales. Therefore, the company has increased substantially its marketing and advertising expenses in the last few years as Figure 8 shows.
Opening new stores
The supermarket chain has been increasing its stores aggressively hence its total square footage has also sharply increased, Figure 9. Since 2009, the total gross square footage increased by 68% while the number of stores only increased 60% which means that the average size per store also rose. Regarding the location of stores, it is noticeable in Figure 10 that it is not homogeneous
per state since, for example, California has 84 stores while in some states WFM
is not present. This is related to WFM strategy of being located in rich regions with high density and which are also healthy and environmentally aware. For the future, the plan would be to “cross the 500-store mark in fiscal year 2017” and to achieve long-term goal of 1200 stores in U.S. and 40 stores in Canada and UK, making the opening of new stores the main driver for growth. However, WFM sales have been slowing down in the last two years, specially sales per sq ft as it is noticeable in Figure 4 for comparable stores, which made WFM abandon that path. From now on, it is expected to continue to be one of the main drivers of
Figure 8: Marketing & Advertising expenses
Source: Annual Report
Figure 9: Stores and Total Square Footage Evolution
WHOLE FOODS MARKET COMPANY REPORT
growth but in a more disciplined way since the aggressive unit expansion in the past was not followed by the demand growth needed. Moreover, the aggressive expansion has also caused cannibalization in some sites which is one of the main explanations for the deterioration of the performance of each store. Summarizing, WFM will continue to expand the number of stores but in a more conservative way than in the past.
365 Stores
365 Stores concept is a WFM’s answer to the new environment in the natural and organic niche market. The company faced a dilemma: to decrease prices while
not affecting heavily operating margins neither the quality since it was vital
for WFM to not damage customer’s perception of its brand excellence. Thus, in order to answer this challenge, WFM came up with a new concept where they can set lower prices, offsetting that with lower structure costs (less employees per sqm counterbalanced by technological improvements, simpler stores, smaller footprints and a higher percentage of exclusive/own brands). The concept is
millennial focused as the youth generation is more price sensitive (more
informed about concurrency and less wealthy) with a tech-driven shop experience and also adopting the trend of smaller stores (which already started in Europe with Tesco and Carrefour, for example). Furthermore, 365 stores allow WFM to explore less affluent markets which would not be profitable through the larger and more expensive traditional stores. Thus, the “365 stores” concept is vital to keep expanding, avoiding cannibalization and conquering a new segment of customers.
Price investments
WFM still has a huge gross margin compared to its competitors in the retail sector (food and beverages) as it can be seen in Figure 11. The chosen group is composed by the largest supermarkets and the WFM peer group in order to have a better view of the grocery retail industry. The leadership in gross margin is mostly explained by its strong brand value and exclusively operating in a premium market where competition was not aggressive. However, over the last years the conditions in the sector have been changing drastically. The largest U.S. players in grocery sector noticed the opportunity and so, they started to explore the natural and organic sector by setting lower prices than WFM. This had a negative impact in WFM performance and, consequently, the company has been reacting through price investments to retain customers (promotion campaigns, affinity programs and reduction of some products’ prices). Therefore,
gross margins have been declining as it is noticeable in Figure 12. Although
Figure 11: Competitors’ gross margins Source: eMarketer Retail
Figure 10: Whole Foods stores in United States (each dot means one store)
Source: Whole Foods Market
2016 Walmart 24,6% Kroger 22,2% Costco 11,1% Target 29,1% Publix 27,3%
Whole Foods Market 34,4%
Sprouts Farmers Market 29,2%
NGVC 28,6%
Ingles Market 24,4%
Weis Markets 27,8%
WHOLE FOODS MARKET COMPANY REPORT
the price investments strategy is one available for WFM to overcome this tough environment, it is not its goal to start an aggressive price war, according its CEO.
Prepared Foods and Bakery
Prepared foods and bakery are a key differentiator of WFM and in 2016, they were responsible for around 19% of the overall sales (around $3 billion), shown in Figure 13. It is also one type of product that diversifies WFM business which is vital to attract new customers and retain the existent ones and, consequently, to overcome the current tough industry conditions. In the future, it is expected to
relatively increase its weight in company’s overall sales due to e-commerce
development where customers can order these prepared foods (working as a restaurant), and therefore, leverage this product category.
Online Channel
WFM in a partnership with Instacart launched an online national grocery and pick-up service in September 2014. The purpose of this move was to stay ahead of its competitors offering its customers an additional sale channel where they can choose according to their preferences how they want to buy. The partnership started in September 2014 in only two locations and in the end of 2016 the number of U.S. stores embedded in the program was around 50%. E-commerce is starting to be more and more used by customers. In retail sector, it is expected to remain with this upside trend in the next years (Figure 14). Specifically, from 2013 to 2016, in natural products industry, the e-commerce grew 42,5% from $4 billion dollars to $5,6 billion, increasing also its share in overall sales, as it can be seen in Figure 15. According to a study of 2014, “Nielsen E-commerce and the
New Retail Survey”, 55% of respondents were willing to order online for delivery
home and 57% were willing to order online and pick up inside the store (Figure 16). Although more than half wanted to use these services, only 12% and 9%, respectively, were already using them. Furthermore, generation Z (15-20) and millennials (21-34) are the most avid online grocery shoppers. Thus, it is expected that in the future, e-commerce options experience a huge growth in the number of its users.
Macroeconomic Analysis
Whole Foods Market operates mainly in U.S., having also operations in Canada and UK. However, the global economy has impacted the company
performance due to two main reasons: the entire world is connected, and some
suppliers are from less developed countries.
Figure 13: Product category
(Figures may not sum due to rounding)
Source: Annual Report
Figure 12: Gross Margin Evolution Source: Annual Report
Figure 14: E-commerce share of total retail sales in US
Source: Statista
Figure 15: E-commerce Performance in Natural Products Industry
WHOLE FOODS MARKET COMPANY REPORT
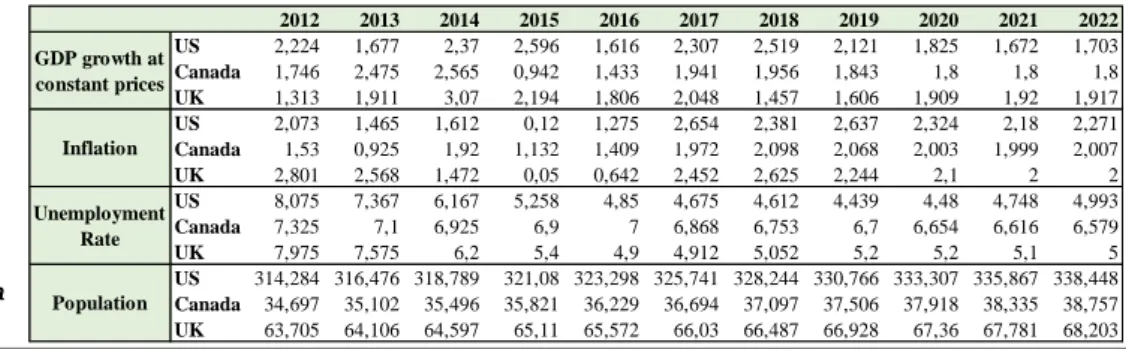
Figure 17: Macroeconomic Data Source: IMF Forecasts
Based on the World Economic Outlook Database, April 2017, developed by the International Monetary Fund (IMF), regarding the world performance, there is an expected GDP growth rate of 3-4% at constant prices between 2017 and 2022. This growth will not be uniform around the world, being expected advanced economies to grow at a slower pace (between 1,6% and 2%) while emerging market and developing economies to grow at around 4,5% to 5%. The world commodity food and beverage price index is forecasted to have a slight increase in 2017 of 2% and after that, it will remain more or less constant until 2022. Regarding U.S., according to IMF forecasts, GDP at constant prices will grow above 2% in the next 3 years, decreasing to around 1,7% in the following years. These numbers are in line with what happened in the previous years. However,
inflation (average consumer prices) will behave very differently compared to
previous years. It is expected to be above 2% in the following years which represents a huge jump compared to the previous 2 years. The unemployment
rate is predicted to remain around 4,5-5% in line with 2016 while the population
is expected to grow. In accordance with the University of Michigan, the
consumer sentiment, which is an indicator that measures the health of the
economy, has been increasing since 2012 from 75,0 in January 2012 to 97,1 in May 2017 (Units: Index 1966: Q1=100, Not Seasonally Adjusted). Lastly, in order to understand the companies’ health, since the 2008/2009 Financial Crisis, the principal U.S. stock index (S&P 500) has been increasing at a high pace from 683,8 index points in March 2009 to 2415,8 index points in May 2017. Regarding Canada, GDP at constant prices will have a growth rate of 1,8%-2% in the following six years which is higher than what was experienced in the last 2 years. Inflation will also grow from 1,4% in 2016 to 2% in 2017 and then it will remain constant in the following years while unemployment rate will go through a slow decrease from 7% in 2016 to 6,58% in 2022.
Lastly, it is more difficult to predict the future of UK due to the uncertainty regarding Brexit, voted on the 23th of June 2016. Nevertheless, IMF forecasts
GDP growth rate to be negatively affected by Brexit mainly in 2018 and 2019, as
it can be seen in Figure 17. Inflation was almost 0 in 2015 and 0,64% in 2016. Besides these low figures in the past, until 2022, it is forecasted to be equal to or above 2%. The unemployment rate will be constant around 5%.
Figure 16: Percentage of people using and willing to use E-commerce in Grocery Industry
Source: “Nielsen E-commerce and the New Retail Survey”, 2014 2012 2013 2014 2015 2016 2017 2018 2019 2020 2021 2022 US 2,224 1,677 2,37 2,596 1,616 2,307 2,519 2,121 1,825 1,672 1,703 Canada 1,746 2,475 2,565 0,942 1,433 1,941 1,956 1,843 1,8 1,8 1,8 UK 1,313 1,911 3,07 2,194 1,806 2,048 1,457 1,606 1,909 1,92 1,917 US 2,073 1,465 1,612 0,12 1,275 2,654 2,381 2,637 2,324 2,18 2,271 Canada 1,53 0,925 1,92 1,132 1,409 1,972 2,098 2,068 2,003 1,999 2,007 UK 2,801 2,568 1,472 0,05 0,642 2,452 2,625 2,244 2,1 2 2 US 8,075 7,367 6,167 5,258 4,85 4,675 4,612 4,439 4,48 4,748 4,993 Canada 7,325 7,1 6,925 6,9 7 6,868 6,753 6,7 6,654 6,616 6,579 UK 7,975 7,575 6,2 5,4 4,9 4,912 5,052 5,2 5,2 5,1 5 US 314,284 316,476 318,789 321,08 323,298 325,741 328,244 330,766 333,307 335,867 338,448 Canada 34,697 35,102 35,496 35,821 36,229 36,694 37,097 37,506 37,918 38,335 38,757 UK 63,705 64,106 64,597 65,11 65,572 66,03 66,487 66,928 67,36 67,781 68,203 GDP growth at constant prices Inflation Unemployment Rate Population
WHOLE FOODS MARKET COMPANY REPORT
Industry Overview
Natural and organic food and beverages have been increasing its share in
customer’s consumption over the last years since people are increasingly more concerned about health and environmental issues. According to Statista, in 2016, the health and wellness food sales worldwide were $707,12 billion with expectation to keep the uptrend (Figure 18). Regarding the organic food
market, it accounted to $90 billion also in 2016. U.S., Canada and UK
accounted for 46%, 4% and 3% of retail sales of organic food, respectively, hence representing a few of the main agents of the market.
Regarding the U.S., the supermarket industry is composed by a large number of
supermarket chains ranging from international companies to small local stores.
In 2016, according to the Progressive Grocer, the supermarket industry in food
and beverages recorded $668,68 billion in sales (Figure 19 – light green bars).
Although there are many players in the sector, the market share of the top 4, 8 and 20, as it can be seen in Figure 20, has been increasing over the past decades which shows the consolidation of the industry. Regarding the market share of the main food and beverage retailers in 2016, Walmart and Kroger accounted for 17,3% and 8,9%, respectively, while WFM for 1,7% (Figure 21). In the U.S. natural products sector, sales in 2016 yielded $140,9 billion (Figure 19 – dark green bars) which were split per distribution channel in Figure 22. For the $54,4 billion sold by natural products retailers, WFM accounted for
28,2% being the largest player followed by Trader Joe’s. The share of
conventional retailers’ sales has been increasing very fast which is one more proof that they are entering aggressively in this niche. Regarding organic food, in 2016, it accounted for $41,7 billion and it is forecasted to achieve $135,3 billion in 2025, according Statista.
According to specialists in the industry, besides the deflation and price investments that have been flooding the sector in U.S. in the last couple years, some trends are also appearing which may affect the future of the grocery industry: the appearance of e-commerce, shorter trips to the supermarkets which means consumers go more times but spend less money, the arising of
smaller stores, the entrance of new large international players (Aldi and Lidl)
and the increasingly interest in natural and organic products.
As referred by Packaged Facts, there are some more important facts about this niche market: 1) 36% of consumers seek out for organic food while 42% for natural foods and beverages; 2) natural and organic foods and beverages sales are forecasted to grow 70% from 2016 to 2021; 3) although consumers continue
Figure 18: Health and wellness food market value worldwide from 2016 to 2021 (in $ billion) Source: Statista
Figure 20: Largest 4, 8 and 20 firms' share of U.S. grocery sales
Source: USDA, Economic Research Service using data from US Census Bureau’s Economic Census and Monthly Trade Survey, company annual reports and industry sources
Figure 19: Supermarket performance in U.S. Source: Natural Foods Merchandiser
WHOLE FOODS MARKET COMPANY REPORT
to make their decisions according to the traditional value drivers (price, convenience and taste), they are also weighing increasingly the following drivers in their food purchasing decisions: health and wellness, safety, social impact, experience and transparency. The market research publisher, Packaged Foods, calls to these new drivers “evolving drivers” since they are expected to have even more importance in the future in consumers’ decisions which is a good signal for natural and organic food retailers.
Furthermore, as stated in Allied Market Research Report, from 2017 to 2023, China, Canada, Germany, France and U.S. will be the most lucrative markets in this niche sector. This conclusion is withdrawn after the evaluation of market growth and market attractiveness for a few different countries.
Porter’s Analysis
In order to have a better perception of industry environment and how WFM fits in
the sector, a Porter’s Analysis was conducted.
Competitive rivalry or competition is getting more intense due to the entrance
of large supermarket chains in the niche market which practice lower prices. This is the consequence of the increased demand for these products (people are increasingly aware about health issues, food quality and its origin). Thus, competitive rivalry has been having a strong negative influence on the performance of Whole Foods Market over the last couple of years. In order to
minimize this negative effect of competition, WFM created the 365 stores, a
concept with lower prices that was already explained, it started to offer e-commerce and last but not least, it increased the advertisement and marketing investments to show people the high quality of its products and also to maximize category management.
The bargaining power of customers is stronger thanks to an increase in the number of companies offering this type of products which now gives much more choice to consumers. Besides, the websites and companies’ apps allow customers to compare products and prices easily and faster which also increases their bargaining power. Lastly, the high price sensitivity of a significative share of natural and organic products’ customers, youth people, turns price into an even more vital factor. WFM reacted through price investments, promotion campaigns and an enhanced loyalty program to minimize the consequence of this force. The bargaining power of suppliers is moderate for WFM. On one hand, the company has many different suppliers and this allows WFM to always have a second choice with low switching costs. On the other hand, one of the suppliers accounted for 32,5% of the total purchases in fiscal year 2016 meaning
Figure 22: 2016 Market Overview for natural products industry Source: Natural Foods Merchandiser
Figure 21: U.S. sales of top food and beverages retailers in 2016 Source: Cowen and Company
WHOLE FOODS MARKET COMPANY REPORT
that operating results would be affected if something happened between WFM and United Natural Foods, Inc (UNFI). Furthermore, the high requirements
about quality and the no use of some non-natural products restricts the
number of suppliers available which increases bargaining power of the ones that fill these requirements.
The threat of substitute products is moderate since although “traditional” products have much lower prices and similar characteristics, the raising concern about environment and health issues makes the consumption of these type of products a priority for some customers and so, product differentiation is very
high for them.
The threat of new entrants is very high in grocery retail industry since there are almost no barriers to entry (no patents nor specialized labour force) neither
high capital requirements as it happens in another sectors. Thus, with the ease
of opening a supermarket, the odds that more players keep entering in the niche market are high.
Competition & Peer Group
For the competitors’ group, all the supermarket chains which sell natural and rganic products were considered. Thus, Wal-Mart (WMT), Publix and Costco (COST) represent the national superstores that have been increasing natural and organic foods offerings while Kroger (KR), Supervalu and Safeway (subsidiary of Albertsons) represent the national conventional supermarkets that are also increasing the share of organic products. Besides these companies, for the alternative food retailers’ group (where Whole Foods Market is included), the following were considered: Sprouts Farmers Market (SFM), Vitamin Cottage Natural Grocers (NGVC), Trader Joe’s, The Fresh Market, Smart & Final, Ingles Markets (IMKTA) and Weis Markets (WMK). Moreover, there are much more regional and local conventional stores which compete with the retailers mentioned above. However, neither all of them are considered to belong to the same peer group as WFM. Thus, the most similar to WFM are Trader Joe’s, Sprouts Farmers Market (SFM) and The Fresh Market because they have the U.S. as the main market, they are big enough to be organized like WFM, operate exclusively in the niche market (natural and organic products) and also have high margins. However, for multiple valuation, it will only be considered SFM (tier 1) since the other ones are not public companies. Besides this company, others (tier 2) which are similar (but not so much as the previous) were considered. Three more companies were added: NGVC, Ingles Markets and Weis Markets. These supermarkets chains are in tier 2 since they fail one of the criteria above. In NGVC, the revenues amounts are very different while for the
Figure 23: Peer group share performance Source: Reuters
WHOLE FOODS MARKET COMPANY REPORT
Figure 24: Peer Group
Source: eMarketerRetail
Revenues ($m) Gross Margins EBITDA EBITDA margin US stores Average store size (sq ft) ROIC (not adjusted) Whole Foods Market 15724,0 34,4% 1355,0 8,6% 434 39000 12,70%
Sprouts Farmers Market 4064,4 29,2% 293,3 7,2% 253 27900 12,30%
Vitamin Cottage Natural Grocers 705,5 28,6% 45,9 6,5% 123 16100 8,20%
Ingles Markets 3795,0 24,4% 238,0 6,3% 201 55300 6,30%
Weis Markets 3136,7 27,8% 175,0 5,6% 204 47900 9,10%
other two the trouble is that selling natural and organic products is not their main activity although they have an important line of such products. The description about each company is in Appendix. Nevertheless, they are similar enough to compare them (Figure 24) and so, it is useful to compute an EV using all of them.
Forecasts
Revenues
In order to forecast the revenues of WFM, sales were split by channel (physical stores and e-commerce). Physical stores were divided by geography (US, Canada and UK) and U.S. physically stores which were additionally broken down into traditional stores and the new concept stores (365). For brick-and-mortar
stores, the three key drivers are the number of stores, square feet (sq ft) per store and the sales per sq ft while for online sales, revenues were separated in number of stores and the performance per store. The share of each channel
in end of the fiscal year of 2016 can be seen in Figure 25 which includes some assumptions since the annual report does not have specific information about 365 stores and online sales revenues neither the split between Canada and UK. Furthermore, the following assumptions were made: 1) in the past, the size per traditional store was the same in the three countries; 2) a new store has a performance of 50% because since as it is not known when it was opened, it was assumed that, on average, they are opened in the middle of the year; and 3) relocated stores have a performance of 75%, assuming it takes 3 months since it is closed one store until it is reopened. It is important to notice that WFM ST and MT forecasts were not done neither based on correlations between its performance and macroeconomic evolution nor industry data of the past because the industry has been experiencing a new environment and so, using only
correlations with past information would lead to wrong forecasts.
U.S. (Traditional Stores)
For the United States, it is noticeable the deterioration of sales per sq ft in the last couple of years (Figure 26) which was counterbalanced with the opening of
new stores, yielding positive revenues’ growth rates. For the future, it was
assumed the number of new stores opened each year will decrease as CEO John Mackey mentioned it in an interview. Until 2021 the forecasts for stores
Figure 25: Revenues per channel in 2016 Source: Company data, Analyst assumptions & Newspapers’ news
Revenues ($M) Share per channel
Us traditional stores 15101,81 96,0% US 365 stores 30,2 0,2% Canada 343,93 2,2% UK 108,01 0,7% Online Sales 140,09 0,9% Total Sales 15724,00 100,0%
Figure 26: Sales per sq ft evolution of U.S. Traditional Stores
WHOLE FOODS MARKET COMPANY REPORT
were based on the Annual Report, which mentions that 79 new traditional stores will be opened of which 18 stores are reallocations. Thus, the analyst forecasted that WFM will open 52 new traditional stores in U.S. until 2021, but at a decreasing pace (Figure 27). Afterwards, the number of new stores opened per year will converge to 5 per year. This number is in line with WFM goals of keeping opening new stores but in a more selective and conservative way. Yet, as more stores are opened, the difficulty to find good places for the expansion increases. Regarding the size of each store, it was considered to converge for the size expected for 2021, according to Annual Report 2016. After that, the size was presumed to be constant. Finally, the sales per sq ft is the main driver of revenues and the most affected in the recent past. As it was mentioned above, WFM is trying to overcome the tough environment in the industry through promotions campaigns, price investments, improving its loyalty programs and higher marketing & advertising expenses. Even though these measures have been undertaken, it is expected that it takes some time for them to succeed. In
the short run, the deflation environment, lower gross margins and the loss of
some customers are expected to be stronger forces than the positive effects coming from the measures stated above, thus inducing a continued downward trend in sales per sq ft until 2018 (Figure 25). After 2019, it is expected sales per sq ft to tend to the inflation rate, reaching its value in 2021. After that, it will keep growing at the inflation rate. Therefore, the higher demand for these products in the future was forecasted to be mainly fulfilled by the entry of new players and/or traditional players (as Walmart and Kroger) and by the new concepts. This means WFM is expected to grow at a rate lower than the market and, consequently, to lose market share. In the next 5 years, revenues from U.S. traditional stores will increase at a CAGR of 3,6% (Figure 28).
365 Stores
“365 Stores” is a new concept created in 2015 and thus there is no official information about their performance in the 2016 Annual Report. Therefore, having in consideration the average size of its stores, the prices charged and the market segment, it was considered its performance (sales per sq ft) would be
similar to Sprouts Farmers Market (SFM) stores. However, as WFM brand is
stronger than Sprouts Market, it was considered 365 stores will have sales per sq ft slightly higher than SFM. Following all these assumptions, a value of $657,61 was found for sale per sq ft in 2016 (Figure 29). For the future, it was forecasted a growth rate equal to the inflation rate plus a premium of 0,5% due to the expectation of a successful implementation because besides its lower prices, 365 stores have embedded future trends: smaller and more technological stores. It is important to highlight that for 2017, the inflation rate considered for food and
SFM 365 Stores
Sales per sq ft
(old store) $ 616,15 $ 677,76
Sales per sq ft
(new store) $ 308,07 $ 338,88
Figure 29: 365 stores Performance vs SFM Performance
Source: Analyst assumptions
Figure 27: Number of new U.S. Traditional Stores
Source: Analyst & Company estimations
Figure 28: Revenues from U.S. Traditional Stores ($M)
WHOLE FOODS MARKET COMPANY REPORT
beverages was lower than the overall country’s inflation because of the deflation environment in the sector as it was referred above. The number of stores opened in the following years (until 2021) and the average size of each store were based on the information given in Annual Report 2016. For perpetuity, it is assumed sales per sq ft will keep growing at a premium of 0,5% above inflation rate and the opening of 4 new stores per year. For the size per store, it will be the same as in 2021. Through all these assumptions, in the next 5 years, 365 stores will grow a lot, turning itself as one of the main drivers for the supermarket chain (Figure 30).
UK
WFM performance in the UK has been very poor comparing to North America countries. UK revenues represent only 1% of total revenues (Figure 31). Consequently, there are experts stating WFM may close or sell its UK stores. As UK share in overall revenues is residual, the number of stores was not affected by these predictions and was assumed to be the same. Lastly, according to the Rabobank report “Organic is good for you!” from 2016, organic food sales will grow in the base scenario at a CAGR of 6,7% from 2016 until 2025 in Western Europe. However, due to the unpredictability of UK future caused by Brexit and its worse performance compared to other Western Europe countries, it is reasonable to be sceptic about the 6,7% growth for UK, considering better to assume a discount of 3% in order to have more conservative and realistic assumptions for the uncertainty of UK future. In 2018 and 2019, sales per sq ft will grow at the inflation rate since the Brexit consequences in the UK Economy are not clear yet. Since 2022 onwards, it is considered it will tend to inflation rate plus a premium of 0,5%. This premium is explained by mainly two reasons: 1) there is no possibility for cannibalization due to low number of WFM stores; 2) it is a sector of the future and although more players will explore it, it is reasonable to expect WFM will also absorb a share of the growing demand of the future.
Canada
Canada operations have a share of around 2% in the overall WFM sales. For the future, it is considered the size of the stores will go hand-in-hand with
U.S. stores. Regarding the expansion in number of stores, in 2013, the LT goal
for Canada was 40 but with no timeline. However, nowadays this number is too optimistic because Canada does not have a lot of cities with a size considerably enough to be profitable to open so many WFM stores since there are already other companies exploring the niche market. Consequently, it was considered LT goal for Canada will not be achieved, lowering the value for 25 stores. For simplicity, it was considered sales per sq ft will grow at a small premium
Figure 30: 365 stores' performance Source: Analyst & Company estimations
Figure 32: Canada Natural Food & Drinks Market, 2016-2023 ($ Million)
Source: Allied Market Research
Figure 31: Revenues from UK Stores ($M) Source: Analyst estimations
WHOLE FOODS MARKET COMPANY REPORT
compared to inflation rate because there is no risk of cannibalization effect (low number of stores) and also because according to Allied Market Research Report, Canada will be one of the most lucrative countries to invest in this niche. Figure 32 shows that Canada’s natural industry will grow substantially in the next 6 years as well as WFM’s division in Canada (Figure 33), keeping constant the
market share in Canada. Regarding 2017, according to a specialist, Canada’s
businesses have been hurting due to the drop of oil prices over the last years. Consequently, in 2017, it is assumed the growth rate of sales per sq ft will be 0 since oil prices on 31st of May were in line with past prices.
Online Channel
The WFM e-commerce still has a long path ahead and there is no specific data about its evolution in any Annual Report. According to the co-CEO Walter Robb, on February 2015, the weekly online delivery sales were around $1 million. As the e-commerce operated at that time in 15 cities which had on total 85 stores, it was considered in that year, those stores would make $52 million. The
average per store is assumed to be constant. In 2016, the number of stores
with e-commerce were 50% of U.S. stores, as stated by the company. For the future, it is assumed the program will be expanded to around 90% of the stores
and not 100% since there are stores which are so close to others that would not
make sense to have this service.
The forecast of e-commerce growth rate will be based on the market expectation due to lack of official information from WFM. According to FMI-Nielson Report, the online grocery spending will grow at a CAGR between 9% (most conservative) to 20% (most optimistic) during 2016-2025. Since the 2013-2016 compound growth rate in natural products e-commerce in U.S. lies in that range (12,5%), it is assumed this value for the forecasted period. In perpetuity, it is assumed to grow at a higher rate than inflation due to the expectation that future generations will be more likely to use the service and so, it will keep expanding. Regarding the prices, WFM set the products to be sold at the same as in traditional stores and customers pay an extra fee to Instacart that depends on the location and also the frequency. About costs, although the company saves in labour costs, there is the need to invest on IT to have good platforms (website and app) which allow customers to have a good shopping experience.
Gross Margin
As it was referred above, market conditions are not favourable to keep constant gross margins in the future. Deflation environment, price investments and the entrance of new discounters (Aldi and Lidl) have been narrowing margins. As it
Figure 33: Revenues from Canada Stores ($M) Source: Analyst estimations
WHOLE FOODS MARKET COMPANY REPORT
was stated by the company, WFM will continue with price investments in the future, and, consequently, it is expected that margins will decrease even more (Figure 34). However, margins are not expected to converge to the industry
average as WFM has a premium brand in which customers pay more due to its
higher quality and reliability. Moreover, CEO Mackey’s view for WFM highlights this position, “Promotions and price investments are an integral part of our
conversation, but we are not participating in a race to the bottom.”. Thus,
margins will decrease in the next 3 years and then will remain constant, assuming industry will be more stable and price war has already finished.
Regarding 365 stores, due to the absence of information and their similarity to
SFM, it was assumed their margins to be the same as SFM average gross
margins of the last 2 years. This is expected to remain constant in the future
since 365 stores have lower prices than traditional stores and it was considered WFM will not do extra promotion campaigns in these stores. Furthermore, 365 stores were created in these current conditions and so, it is believed its margins will remain constant.
Costs
In a competitive environment where margins have been affected, in order to survive, WFM’s CEO John Mackey said in March 2016 “our strategy is to
adjust our operating model to a lower margin and lower cost structure,”
(Figure 35). Summarizing, investments made in technology, in marketing and in pricing are expected to be offset by a lowering cost structure with labour restructuring and with a hybrid purchasing structure instead of a decentralized one as it is currently implemented.
Labour Costs
Regarding labour costs, there are no specific numbers mentioned in past Annual Reports. However, in 2013, the WFM’s CEO declared that the average hourly wage of WFM was $18,89, a value that is above the industry average. This is reasonable because it is supposed that WFM employees offer a premium support to its customers. In order to convert this value to 2016, it was assumed WFM employees’ nominal wage grew at the same pace as private companies’ salaries in U.S. during the same period. Thus, considering the assumption referred above, the average hourly wage in 2016 was $20,20, using growth rates based on Bureau of Labor Statistics. Another assumption was that part-time employees work, on average, 20 hours per week. With all this information, WFM spent around $3,1 billion in 2016 in wages which corresponds to 19,6% of revenues. As it can be seen in Figure 36, the number of employees per sq ft is much higher
in WFM than in other companies. Thus, and also because cost structure is
Figure 34: Overall WFM's Gross Margin Source: Analyst assumptions
Employees per store Employees per sq ft
WFM 190,8 0,00489
SFM 106,7 0,00383
NGVC 24,4 0,00152
Ingles Markets 131,8 0,00238
Smart & Final Stores 39,2 0,00165
Weis Markets 112,7 0,00235
Figure 36: Peers' ratios regarding employees
Source: eMarketer Retail
Figure 35: SG&A, Pre-opening and Relocations expenses as % of Revenues Source: Analyst assumptions
WHOLE FOODS MARKET COMPANY REPORT
expected to decrease according to the Board of Directors, it is assumed
employees per sq ft will continue to decrease to numbers closer to SFM.
This phenomenon is counterbalanced by more technological stores. However, the ratio in WFM traditional stores will continue to be higher than SFM because as already mentioned, a premium store demands more employees per customer for a better and faster service. Thus, in the next three years, WFM ratio will converge to 110% of current SFM ratio, stabilizing the ratio from 2019 onwards (Figure 37). The average hour paid will be updated indexed to inflation.
Regarding 365 stores, it was assumed the average of employees per sq ft will
be the same as the first 365 store opened in Silver Lake and it will remain constant in the future. This assumption was made since when the concept was created, this competitive environment was already present in the grocery sector. Thus, 365 stores will have a slightly lower ratio than in traditional stores which is offset by more technological stores and less personal support by employees.
Marketing & Advertising
The marketing and advertising were far from a priority to WFM since its inception. However, times have changed as well as the atmosphere in natural and organic grocery industry. The huge increase in competition has been affecting WFM negatively and so, the company felt the need to react in order to keep pushing
the brand value and to increase loyalty from its customers, as mentioned above.
One of the measures taken by the company was to invest in advertising, launching its first TV ad ever in 2015 (“Values Matter”) and the second in the beginning of 2017 in line of what CEO John Mackey said, “We can lower prices
here and there, but if people don’t know about them, we won’t get the full lift.”. This way WFM has added the advertising to the word-of-mouth as the
two main channels to show why is worth to buy there in order to boost its sales. In 2016, WFM spent 0,61% of revenues in advertising expenses which were the same as the median of its peer group (Figure 38). Thus, it is assumed that WFM will keep with this strategy and, consequently, the ratio will remain constant. As Bill Kirk, an analyst for RBC Capital Markets, said, “We believe this is a positive development that suggests Whole Foods' 2016 pursued strategies have reached a point where it's time to communicate the company's progress.”
Regarding marketing, the investments were made more in data about
customers, their preferences (personalization) and also category management. Thus, as gathering customer data is increasingly more important
and WFM declared one of the main ways to overcome these difficult times would be retaining its best customers, it was assumed next year marketing expenses as percentage of revenues will raise to 0,25% and then the ratio will keep constant.
Figure 38: Peers' Advertising expenses as % of Revenues Source: eMarketer Retail
Figure 37: Labour evolution of WFM Source: Analyst estimations
2016
WFM
0,61%
SFM
0,90%
Natural Grocers
1,50%
Ingles Markets
0,40%
Weis Markets
0,30%
Median
0,61%
WHOLE FOODS MARKET COMPANY REPORT
Net Working capital
Net working capital includes the following captions: Operating Cash,
Restricted Cash, Accounts Receivable, Inventories and Prepaid expenses and Other Current Assets in operating assets and Accounts Payable, Accrued payroll, bonus and benefits due team members and Other Current Liabilities in operating liabilities.
Regarding Operating cash, it was considered to be 2% of revenues since, according to bibliography, it is the amount necessary, on average, to manage current operations regarding the core of the company. Prepaid expenses and
other current assets is a residual caption that was volatile in the past. Thus, it
was considered the same percentage of revenues occurred in 2016 (1,06%). Additionally, for Restricted Cash caption, as it is associated to the workers’ compensation obligations, the driver chosen to forecast was the number of workers. The ratio of restricted cash to number of workers was constant over the last 2 years and, consequently, it was assumed in the future it will keep constant at 0,14%. From 2020 onwards, it was assumed the ratio will be constant as percentage of revenues.
For the operating liabilities, the caption Other Current Liabilities is composed by quite different components and it has been volatile over the past 4 years which makes it harder to forecast. Thus, it was considered the average percentage of revenues of those years and assumed it will remain constant in the future. For the Accrued payroll, bonus and benefits due team members, it was forecasted through two drivers: number of workers and the following ratio (expenses with this caption as percentage of workers). For the future, it was assumed the ratio will be constant and equal to the average of the last 4 years. Then, it is multiplied by the number of workers of each year.
For the accounts receivable, inventories and accounts payable, it was used data about the peer group in order to have a better perception on how these captions will evolve in the future. Regarding Accounts Receivable, it was computed as percentage of revenues. The median of peer group is equal to WFM value for 2016 (Figure 39) and, consequently, it is assumed the ratio will keep constant in the future with the same value as in 2016.
Regarding Inventories, it was considered as percentage of costs of goods sold (COGS) instead of revenues to take the effect of different margins among the peer group. WFM has a more efficient inventory policy comparing to its peers as it can be seen in Figure 40. Thus, it is assumed WFM will stick with its policy since there is no information against this assumption.
Figure 39: Accounts Receivables as % of Revenues of Peer Group
Source: eMarketerRetail
Figure 40: Inventories as % of COGS of Peer Group
WHOLE FOODS MARKET COMPANY REPORT
Lastly, regarding Accounts Payable, it is much lower than the peers’ value (Figure 41). This can be explained by two main reasons: the lower inventory amount as percentage of revenues and a large number of suppliers which means lower amounts owed to each one and, consequently, a paid speedily. For the future, it is assumed this value will increase slightly due to the evolution for a hybrid centralized purchasing, but it will remain far from peer group’s median. Concluding, in the next years, the cash flow from NWC variations will be favourable which shows the expected efficiency improvements WFM will take in order to overcome current conditions. The ratio of current assets to current liabilities fluctuated between 0,99 and 1,20 over the last four years. In
perpetuity, this ratio will converge to 1,12 which is slightly lower than market
standard but in line with WFM past values.
CAPEX and Capitalized Operating Leases
CAPEX
The WFM’s Capex is computed through the difference of PPE plus depreciations. Regarding the PPE, it corresponds to the average of the last 4 years of PPE per sq ft adjusted by inflation times the forecasted total square footage. The increase in PPE is expected to happen at a lower rate in the future since WFM will be more selective choosing the new stores and, consequently, will expand at a slower pace. This is clear after analysing expansion capex as percentage of revenues. While in the last 3 years the average of this ratio was 3,6%, in the future, it will have its maximum in 2018 (2,8%) and will converge for 1,4% in perpetuity. As it can be seen in Figure 42, the expansion CAPEX will be decreasing its share in overall CAPEX which is in accordance with a slower WFM’s expansion (opening less stores per year, on average, than in the past). Regarding depreciations, in the future, it is assumed to have the ratio depreciations as percentage of PPE constant and equal to the average of the last 4 years. In supermarket chains, operating leases are used in different quantities among the companies and so, it does not make sense to compare the Capex as percentage of revenues with other corporations since the comparison would be biased. For the long-term, beyond 2023, it was considered PPE as percentage of revenues to be equal to the 2022 value.
Operating Leases
WFM has a significant number of operating leases which is an off-balance sheet
caption. Although the reformulation of these leases does not affect the equity value of the company, it affects the EV, ROIC and unlevered free cash flows.
As it is stated in Mckinsey book, “Adjusting the financial statement makes
Figure 42: Capex ($M) Source: Analyst estimations
Figure 41: Accounts Payable as % of COGS of Peer Group
WHOLE FOODS MARKET COMPANY REPORT
return on capital and free cash flow once again independent of capital structure choices, specifically whether to lease, own, or borrow”, having a
better idea of the company’s core performance. In order to compute the capitalized operating leases, the formula below was used (Figure 43), taking past rental expenses from Annual Reports and forecasting future rents. The cost of debt considered was AA-rated yields (lower risk than the company because it is associated to a physical collateral). Lastly, to estimate the asset life, the methodology proposed by Lim, Mann and Mihov of dividing PPE by annual depreciation was used. Afterwards, to include these assets in the balance sheet, they were added to operating assets and financial debt. At last but not least, according to “Lim, Mann and Mihov” and “Ohio State University”, one more reason to readjust capitalized operating leases is the fact that rating agencies
take into account these operations to evaluate the company’s rating.
ROIC Analysis
It is important to analyse the Return on Invested Capital (ROIC) of WFM and compare it with the closest peer and a proxy for the industry in order to understand how good it is WFM at turning capital into profits relatively to its sector. The comparison will be made considering ROIC adjusted for operating
leases since the purpose is to conclude about the performance of the core
business regardless of the financial structure. WFM’s ROIC decreased heavily
in the last year but it is not an isolated case as the Figure 44 shows. The tough
environment in the industry affected negatively also the closest peer and the industry retail (grocery and food) given by Damodaran database. It is important to highlight that WFM might have been more affected than SFM because of its higher prices.
Regarding the forecast period, in the short-term, it is expected the RONIC to be negative, affecting the overall ROIC. However, RONIC will increase after 2018 because it is expected the stabilization of the industry which will allow the company to profit from the invested capital. After that, from 2024 onwards,
RONIC will stabilize around 9,0-9,5% which is reasonable since it is a value higher than WACC and lower than ROIC. The comparison with WACC allows
to conclude that the company will be continuously creating value since RONICis always higher than WACC from 2018 onwards. Lastly, the reinvestment rate will be lower in the future due to the current WFM strategy of being more selective in the opening of new stores. The evolution of the respective ratios in the next years is presented in Figure 45.
Figure 44: ROIC evolution of WFM, SFM and the grocery industry
Source: Annual Reports & Damodaran Database Figure 43: To compute the asset value correspondent to a rental expense Source: “Valuation – Measuring and Managing the Value of Companies” from McKinsey & Company