of Business and Economics.
WHY AREN’T BRAND NAMES RECOGNIZED AS
INTANGIBLE ASSETS IN THE FINANCIAL STATEMENTS?
A STUDY OF THE SUBJECTIVITY OF BRAND
VALUATION
JADE MICHELE ROYERS 1011
A Project carried out on the Directed Research course, under the
supervision of: Sara Alves, Bruno Colmant
Why Aren’t Brand Names Recognized As Intangible
Assets In The Financial Statements? A Study Of The
Subjectivity Of Brand Valuation
Abstract
The goal of this paper is to determine and to quantify how subjective brand valuation is. To do so, we review the different valuation methods and apply the Hirose model to a sample of 20 US companies from the technology sector. Even if the results vary in function of the rankings we choose as a comparison, we may identify the trend that brands are usually overvalued in those rankings. It explains why internally generated goodwill (which includes brand names) is not recognized as an intangible asset in the financial statements.
Index ABSTRACT 2 INTRODUCTION 4 LITERATURE REVIEW 5 1. WHAT’S A BRAND? 6 2. HOW TO VALUE A BRAND? 6 2.1. MARKET APPROACH 6 2.2. COST APPROACH 6 2.3. INCOME APPROACH 7
2.4. ROYALTY RELIEF METHOD 8
3. INTERNATIONAL STANDARDS 9
4. GOODWILL (IFRS3) 9
5. CONTROVERSIAL ISSUES ABOUT THE GOODWILL 11 6. BRAND VALUE AS AN INTANGIBLE ASSET? 12
DATA 13 METHODOLOGY 14 RESULTS 17 CONCLUSION 21 REFERENCES 22 APPENDICES 25
Introduction
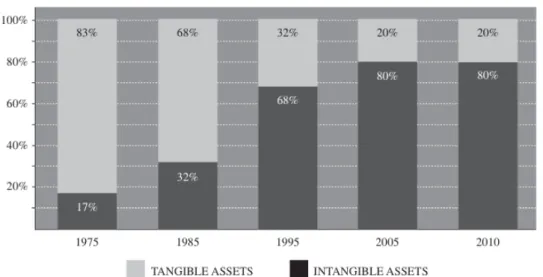
Back then, the primary and secondary sectors were the most developed ones in the economy. However, nowadays, those sectors tend to decrease because most of the value comes from the tertiary sector. In addition to the growth of the services sector, we can also see the importance of the added value by looking at the biggest market values (Apple, Google, etc.), where most of the value is intangible.
During the 90’s, the creation of the Internet was a real turning point in our economy. Hundreds of e-companies were created, with IPO’s always higher and higher. Some companies were highly valued whereas the business plan was not even solid. Investors were just blinded by the Internet revolution and it led to the burst of the Dot-com bubble with a huge slump of the NASDAQ. More recently, the takeover of WhatsApp by Facebook, or their offer of three billions dollar to buy Snapchat gives us information about how much investors value the intangible. Snapchat doesn't generate any revenues but it’s still valuable for investors. The company is hence mostly composed by intangible assets.
Throughout this paper, I would like therefore to focus on the goodwill, because it plays a key role as it takes into account all the unidentifiable aspects of a company that can be really valuable. One of those more specific aspects is the brand value, which is one of the most important and interesting one. Apple current brand value amounts to $124.2 billions, which represents more than 15% of its total market capitalization. The goal of this study is to try to determine if brand valuation is well subjective or not and to quantify it. To do so, we will first review some literature about brand valuation methods and we will also try to fully understand the goodwill and its relation with the international standards. Then, we will apply Hirose’s method to a sample of 20 US companies from the technology sector and we will discuss the results to conclude this paper.
Literature review
Brand valuation is a quite recent topic. It only started in the 80’s, when the first valuation of a brand was made by Interbrand, an organization specialized in valuing brands (Seetharaman, Zainal Azlan Bin Mohd Nadzir, Gunalan, 2001). In the current economic environment, the competition is getting fiercer every day, that’s why it’s important to bet on its brand to make the difference, as each brand is completely unique. It is thus a key advantage for a company and therefore knowing what is its brand worth can influence the strategy of an organization (Howe, Sackley, Spencer, Mautz, Freed, 2013).
1. What’s a brand?
A brand is an asset without a physical substance which value can only be determined precisely in case of an acquisition (Seetharaman, Zainal Azlan Bin Mohd Nadzir, Gunalan, 2001). However, some concepts associated with the brand are trickier and deserve some explanation. We call brand equity all the activities linked to branding investments (Seetharaman, Zainal Azlan Bin Mohd Nadzir, Gunalan, 2001). This notion refers to an asset, whereas brand value refers more to the financial value of the brand (Duguleana, Duguleana, 2014).
2. How to value a brand?
The process of valuation is composed of three steps. First of all, one must realize a legal analysis to be perfectly aware of the legal rights of the brand, the legal owner and jurisdiction. Secondly, one must process to a behavioural analysis of the brand strength, that is to say to determine to what extent the brand is responsible for generating cash. Finally, a financial analysis is divided in three different approaches (Duguleana, Duguleana, 2014):
2.1. Market approach
This approach measures the value of assets similar to the ones valued. The purpose is to establish the value of the brand by looking at different comparable brands. This could be problematic though due to the uniqueness of each brand.
2.2. Cost approach
This second approach measures the cost of building the brand, its replacement or its reproduction. The drawback of this method is that each brand is unique so it’s hard to
assess its reproduction cost and what’s more, by looking at the costs, we’re focused on the past and don’t take the future into account.
2.3. Income approach
With this approach, we measure the value of the brand by computing the present value of the economic benefits expected to be received over the remaining useful economic life of the brand. It’s considered to be the best approach even if it’s sometimes difficult to apply because of the various ways to determine the cash flows.
The brand valuation company Interbrand has developed a practical method based on the income approach. They start by computing the overall financial return by deducting the charge for the capital use in obtaining the brand (manufacturing capacities, employees and distribution channel) from the economic profit after-tax. Then, they calculate the base of valuation model by forecasting the value of company’s revenues and profits for a five-year horizon. After, they multiply the Role of Brand Index (RBI), which represents the proportion of the brand choice influence in forming the demand, by the economic profit of the branded products or services to obtain the volume of earnings due to the brand influence. The final step is to discount the branded earnings by a discount rate to find the present value of the brand value. In order to find that discount rate, Interbrand estimates a relationship (called the S-curve) between the brand strength of comparable brands and their P/E ratio (which would be comparable to the ratio between the brand value and the brand earnings). The brand strength is computed according to seven different factors, each one of them worth a certain amount of points, in total adding up to 100. For instance, one factor is the stability of the brand, evaluated on a score of 15, according to some criteria such as the customer loyalty. The brand strength determines thus the risk profile of the brand. For example, a brand with
a maximum brand strength score of 100 will be discounted at the risk free rate. It has been proven that the discount rate corresponds to the inverse of the multiplier given by the S-curve (Salinas, 2009).
2.4. Royalty relief method
Finally, this last method is based on the fact that the brand value is equivalent to the present value of the future royalties payments the company has saved by owning the brand. In other words, the brand value is equivalent to the discounted sum of futures fees the company would have had to pay if it didn’t own the brand (Roberts, 2011). This is the method used by the company Brand Finance, specialized in brand valuation. They start by computing the brand strength by using a balance scorecard of brand-relevant attributes. Then, they review comparable licensing agreement in order to determine a royalty rate range of the sector. By applying the brand strength to the royalty rate range, they can determine the brand royalty rate. After that, they estimate by benchmarking the proportion of revenues attributable to the brand and they forecast it based on historic data and other indicators. Finally, they obtain the royalty charge by applying the royalty rate to the forecasted revenue and they discount it to find the final brand value1.
In conclusion, the literature agrees on the fact that the cost and the market approaches are less precise and wouldn’t be sufficient on their own to value a brand. Therefore, we will use the income approach in this paper as it stands out as the most accurate method.
1
Branddirectory. 2015. Brand Finance. http://brandirectory.com/methodology (accessed April 5,
3. International Standards
In addition to meeting the International Organization for Standardization (ISO) 10668 called « Brand Valuation », people dealing with brand valuation must also take into account two others standards: IAS 38 « Intangible Assets » and IFRS 3 « Business Combinations ». Brands are indeed intangible assets (they don’t have a physical substance) and their useful lifetime is usually indefinite. In order to know if the brand can be recognized as an asset or not, it depends then of the nature of the brand : is it internally generated or is it purchased ? In the first case, the standard IAS 38 doesn’t recognize it as an asset. However, in the second case, the brand comes from an acquisition and is therefore considered as an asset. The standard IFRS 3 applies thus in this case.
Nonetheless, Sinclair and Keller have identified some contradictions in the standards. IFRS 3, which is about business combinations, states that brands should be recognized as assets, whereas IAS 38 forbids it if the brand has not been bought.
In the case of business acquisitions, it is obviously really important for a company to know what it’s buying in order to value it. Therefore, we will now focus more on the goodwill, as it involves the brand of the company in a broader way.
4. Goodwill (IFRS 3)2
As said above, according to the standard IAS 38, the goodwill is considered as an intangible asset by a company only when it results of a business combination, that is to say when an entity (the acquirer) acquire at least another one (the acquiree) on an acquisition date. It is thus recognized only when there is a change of ownership, which
2
European Commission. 2014. “International Financial Reporting Standard 3 Business Combinations.” http://ec.europa.eu/internal_market/accounting/docs/consolidated/ifrs3_en.pdf (accessed March 10, 2014).
may seem paradoxical in the case of a listed company where the ownership changes a bit every day. As a reminder, the goodwill represents an “excess value”, sort of forecast of future economic benefits born from a business combination (Schevin, 2005). An accurate value of goodwill is though difficult to evaluate. Indeed, it takes into account unidentifiable assets (like the brand name, the customers etc.) but also the fact that there will be positive synergies thanks to the combination. Moreover, the goodwill can also reflect an overvaluation of the acquiree’s consideration or also merely an overpayment (or underpayment) by the acquirer3.
According to IFRS 3, the goodwill is computed as the difference between; a) the sum of the consideration transferred evaluated at the acquisition-date fair value, the amount of minority interests (if there are some) and, if the acquirer had already an equity interest in the acquiree, the fair value of the acquirer’s previously-held equity interest in the acquired business; and b) the net amount of the identifiable assets and liabilities acquired measured at the acquisition-date fair value. If the difference is negative, the gain is determined as a bargain purchase in profit or loss, after a review from the acquirer of all measurements.
The objective of IFRS 3 is to improve three aspects of the financial statements provided by an entity about business combinations. These aspects are the relevance, the reliability and the concordance of the information. To do so, this standard prohibits an entity from amortizing goodwill. Indeed, it’s quite arbitrary to say that each year during 20 years the goodwill has to be depreciated by a fixed amount. It could for instance stay stable for a long time and then be decreased because of a particular event. Amortization
3
Shinhan Financial Group. 2012. “Proposal of Alternatives for Goodwill Accounting.”
doesn’t give any relevant information in comparison of a goodwill impairment charge, which can be the signal of a decline in a business. What’s more, it could lead to an overvaluation of the goodwill as it was amortized on a long period4. Consequently, the information provided now by the entity is more precise, transparent and thus closer to the economic reality. It is also more complete5.
5. Controversial issues about the goodwill
The goodwill is a really complex accounting tool. It leads to many issues and these troubles are linked to its nature. Because of this complexity, there have been a lot of disagreements over its accounting treatment.
As we said above, the goodwill used to be amortized but it has been prohibited because it could distort the financial information. Indeed, periods in which the goodwill is consumed are really hard to estimate. That’s why we proceed to the impairment test. However, this test doesn’t take into account the fact that the goodwill is composed of several parts, as said in the previous section. Furthermore, the impairment of goodwill is influenced by the economic fluctuations. The risk of goodwill’s impairment can thus be underestimated during economic expansions while it can be overestimated during economic recessions6. Therefore the impairment of goodwill may not reflect the
economic reality either.
Secondly, the recoverable amount is based on many different assumptions and it’s quite difficult to estimate goodwill’s fair value. Due to this uncertainty and
4 Shinhan Financial Group. 2012. op. cit.
5 Moehrle, Stephen R., and Jennifer A. Reynolds-Moehrle. 2001. “Say good-bye to pooling and
goodwill Amortization.” Journal Of Accountancy, September 1.
http://www.journalofaccountancy.com/Issues/2001/Sep/SayGoodByeToPoolingAndGoodwillAmortizatio n.htm (accessed March 10, 2014).
difficulty we may think that management could cheat with impairment by trying to delay it or even to avoid it7. Indeed, as it has become more unusual, a goodwill impairment can be a negative signal for future profitability and thus for the stock market. Just because an entity has a huge goodwill can already be a warning for the stock market (Schevin, 2005).
Finally, another issue of the impairment test is that we can’t clearly distinguish the goodwill acquired in a business combination from the internally generated one (Schevin, 2005). In fact, if the value of the acquired goodwill has decreased, it could be hidden by the creation of internal goodwill. For instance, if Coca acquired Pepsi, the goodwill should maybe be depreciated after a few years because of the loss of value of the brand name “Pepsi”. However, we could easily imagine that the value of the brand name “Coca” would be higher or also that Coca would benefit from a wider range of customer. Consequently, the value created internally would outweigh the depreciation of the goodwill acquired in the beginning.
6. Brand value as an intangible asset?
For most of the companies studied in this paper, brand names represent highly valuable assets which may be interesting to show in the balance sheet. It is indeed an information which could make the difference in the eyes of the investors and they deserve to know everything about the company. The brand value is indeed a good indicator of the health of the business and the generation of future wealth (Sinclair, Keller, 2014). According to Uzma (2011), it’s all about a trade-off between reliable and relevant information. Brand value is completely relevant but we may doubt of its
reliability regarding the promised future income or the way the value was computed (Bhattacharyya, 2012). Consequently, the main problem with brands is that they don’t meet the pure definition of intangible asset.8 As it is all about the reliability of the determination of the brand value, in the next sections we’re going to try to prove that brand names are subjective through the use of the Hirose model.
Data
In order to determine the brand value of a sample of companies from only a financial point of view, I couldn’t apply the Interbrand method and decided then to apply the Hirose model (see description in the next section).
First of all, I chose a small sample of 20 companies in the technology industry, because I think these are the companies which brands can be the most likely overvalued. Then, all the data come from the financial reports of each company, between 2009 and 2013 (five year horizon). In order to compute the total brand value, I used the 10 years US Government risk free rate of 1,96%9. Finally, to compare the value I find with the actual value of the brand, I consulted different brand valuation rankings, such as
Interbrand, BrandZ and Brand Finance which are companies specialized in brand
valuation, and a ranking from The Forbes in 2014. All the data can be found in Appendix 2.
8
Universidad Nacional De Colombia. n.a.. “Intangible Assets: Perspective and Issues”,
http://www.fce.unal.edu.co/ (accessed May 3, 2015).
9 Bloomberg. 2015. United States Government Bonds.
Methodology
The income approach to brand valuation is actually a general approach which can be derived in dozens of more accurate models. Two of the most famous ones are the
Interbrand method and Hirose’s model (Wu, 2009). The Interbrand model implying
some marketing factors such as the brand strength depending on consumers’ opinion, it was not suitable in the case of this finance paper and I therefore chose Hirose’s model. What’s more, Wu determined through his paper that the Hirose model is more objective than the Interbrand one as the latter takes into account market factors which can influence the brand value subjectively.
The Hirose approach assumes the brand value is influenced by three different factors: the price advantage known as prestige driver (PD), the customer loyalty known as loyalty driver (LD), and the brand expansion power known as expansion driver (ED) (Salinas, 2009).
First of all, the Prestige Driver is calculated as the average excess profit ratio during the past five years multiplied by the brand attribution rate and the actual cost of sales. In practice, we have to determine the sales (S) and cost of sales (C) of the brand for the past five years (2009 to 2013 in our sample) and divide the first by the latter to get the ratio of sales to cost of goods sold. Then, the method demands to do the same for a similar company (denoted by « * » in the formula) in order to determine the price advantage. Afterwards, the brand attribution rate is computed by dividing the advertising expenses (A) by the total operating expenses (OE). The Prestige Driver can be expressed as follows (Salinas, 2009):
𝑃𝐷 =
!! !! !!−
!!∗ !!∗∗
!! !"!∗ 𝐶
! ! !!!! (1)Regarding the choice of the benchmark company, I chose companies from the same industry according to the NASDAQ classification or to the list of competitors identified by Bloomberg.
Secondly, the Loyalty Driver is computed as one minus the volatility coefficient of cost of sales, i.e. the 5-year standard deviation of cost of sales (𝜎!) divided by the 5-year average cost of sales (𝜇!). This states that the sales figure is supposed to stay stable if customers are loyal. A stable figure means indeed a small standard deviation and hence a Loyalty Driver close to one. It can be expressed as follows:
𝐿𝐷 =𝜇! − 𝜎!
𝜇! = 1 − 𝜎! 𝜇!
Thirdly, in order to compute the Expansion Driver, Hirose’s model computes the average between the average annual growth rate of overseas sales (SO) for the past two years and the average growth rate of sales in the non-core segments of the company (SX) for the past two years as well. The sales in the non-core segments are determined by subtracting the product’s sales which are the biggest from the total sales. The Expansion Driver can be expressed as follows:
𝐸𝐷 =1 2 1 2 𝑆𝑂! − 𝑆𝑂!!! 𝑆𝑂!!! + 1 + ! !!!! 1 2 𝑆𝑋! − 𝑆𝑋!!! 𝑆𝑋!!! + 1 ! !!!!
Finally, the total brand value is computed by multiplying the three drivers and dividing them by the risk free rate.
(2)
However, even though this method is widely used, it has been criticized on different points in the literature (Salinas, 2009).
First of all, in the computation of the prestige driver, if the company happens not to have a price advantage, it would mean the brand has no value. However, the absence of price advantage doesn’t necessarily mean the brand is worthless. What’s more, in order to evaluate the proportion of costs generated by the brand, this methodology divides the sales by the cost of sales. Nevertheless, it is possible that the brand generates more costs than its contribution to the profit. Regarding the advertising costs ratio, it can be really different in function of the sector (generally small for B2B firms for instance).
Secondly, as far as the loyalty driver is concerned, there is no scientific proof of the link between stability of cost of sales and customer loyalty.
Finally, concerning the expansion driver, the only way growth is taken into account is in historical data, which may not be the most suitable approach to assess future growth opportunities that could be valuable for the brand.
Through the application of the Hirose model, I could also notice some drawbacks of this approach that are not mentioned in the literature review. First, the value of the prestige driver is, in my opinion, highly subjective because of the choice of the benchmark company. The method demands that we choose a company with the smallest revenue/cost of sales ratio but it is quite a difficult task to realize based only on publicly available data. Therefore, it induces subjectivity in the determination of the brand value. Secondly, this approach is really past-oriented. Although it takes into account expansion factors such as overseas sales growth and non-core business segments sales growth, it never estimates the future sales or takes into consideration
some macro-economic factors which may have a future influence on the brand value. Finally, some companies don’t disclose complete information regarding their promotion and advertising expenses and simply include them in Selling, General and Administrative Expenses. This means thus that the brand attribution rate might be higher than it really is and may thus lead to an overvaluation of the brand value.
Results
The results of the application of the Hirose model can be interpreted in different ways according to the ranking we choose as a comparison. Please refer to Appendix 1 for a detailed summary of the results.
First of all, regarding the Interband ranking of 2014, only four companies (eBay, IBM, Intel and Xerox) out of thirteen show a higher brand value according to the Hirose model. It suggests that the brand values are overvalued in the Interbrand ranking in 69% of the cases.
Secondly, regarding the Forbes ranking of 2014, seven companies out of twelve (58%) show a higher brand value than the one computed with the Hirose approach. The five companies demonstrating a lower brand value in the Forbes are Dell, eBay, Google, IBM and Intel.
Thirdly, regarding the BrandZ ranking of 2014, only two companies (eBay and Intel) show a higher brand value in the Hirose valuation. This means that the brand values are overvalued in the BrandZ ranking in 88% of the cases.
Finally, the Brand Finance ranking is the most interesting one as it is the only one showing a brand value for the sample of the 20 companies. The results show that
thirteen companies out of the 20 (65%) have a lower brand value according to Hirose’s model.
In order to try to draw more general conclusions, I decided to compare the values obtained by the Hirose approach with an average brand value of the four different rankings. With this comparison, still fifteen companies out of 20 (75%) have higher brand values than in the Hirose model. Some brands have values only 1.08 times higher, like Adobe, whereas others are 104.26 times higher like LinkedIn. If we exclude the extreme values of LinkedIn and Oracle (32.48 times higher), the brand values are 5.13 times higher on average than the Hirose values (while they are 3.68 times higher on average in the Brand Finance ranking than in the Hirose model, excluding also LinkedIn and Oracle ratio of 30.8 and 28.72 respectively). After that I decided to exclude extreme values amongst the four different rankings when possible in order to avoid having a biased average value. The results are similar with still the same fifteen companies showing higher brand values than Hirose’s ones.
If we compare now the results given by the comparison with the Brand Finance ranking and the average brand values, in both cases they determine that the same brands are overvalued according to those rankings, with the exception of two brands (Apple and Adobe). However, the differences are relatively small. In Adobe’s case, the value obtained with Hirose model is 4.12 billion USD, compared to 3.52 according to Brand
Finance and 4.43 for the average brand value. Regarding Apple’s case, the value
obtained with Hirose model is 108.08 billion USD, compared to 104.68 according to
Brand Finance and 123.91 for the average brand value. This difference is a bit more
for Apple’s brand value, I would tend to conclude that there’s a trend showing its value is too high. What’s more, by adding up the square of the difference for each ranking between Hirose’s value and the rankings’ value for the whole sample and dividing it by the number of companies in the sample (some rankings don’t have value for the 20 companies), I find that the smallest sum of square is the one of the Brand Finance ranking. Assuming the value I computed with Hirose’s model is right, Brand Finance provides the closest values and I would then trust this ranking. Therefore, it would emphasize the fact that Apple’s brand value is overvalued in the other rankings.
Also, we can look more in details a few brands with abnormal values, in particular Amazon, eBay, Facebook, HP, Intel, Xerox and Oracle. The common point between those companies is that the value computed according to the Hirose model is completely different of the values amongst the four rankings. While the extreme value for Xerox may be explained by the fact that I had to use, due to a lack of information, the Selling, General and Administrative Expenses instead of the advertising expenses which lead to a high brand attribution rate, the explanation for the other companies remains unclear. We may think the cause would be a high brand attribution rate for eBay and Intel or a small Prestige Driver for Amazon, Facebook, HP and Oracle. Although it seems to be difficult to influence the brand attribution rate in our computations, the value of the Prestige Driver is quite subjective, as we said in the previous section regarding the choice of the benchmark company.
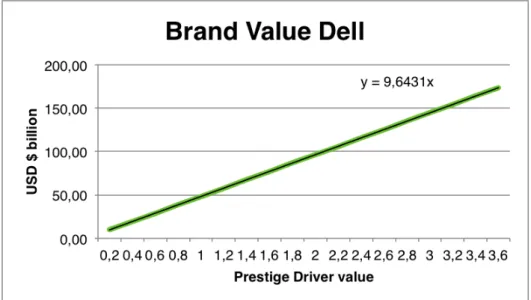
In order to investigate deeper the role that the Prestige Driver value can play in the total brand value, I undertook two kinds of analysis. First of all, a short sensitivity analysis to get a quick overview of the range of values the brand could take allows us to
see that the brand value increases really fast with a small increase of PD. For instance, if we look at Dell (Fig. 2), each time PD increases of 0.2, the total brand value increases of 9.64 billion USD.
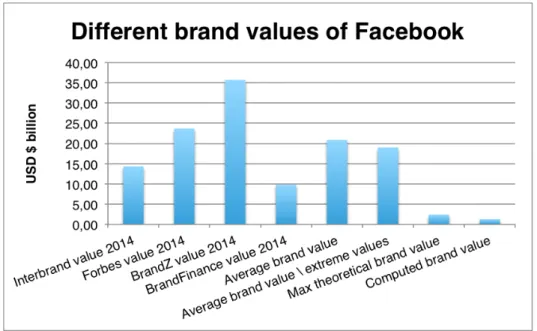
Secondly, to go deeper in the analysis, I decided to compute what could be the maximum theoretical brand value for each company. To do so, I needed to calculate the maximum value of the Prestige Driver. Therefore, I assumed the benchmark companies had a profit ratio equal to zero and I obtained the maximum value of PD. The point of this analysis is that we can now notice that for Facebook, LinkedIn, Oracle, Twitter and Yahoo, the theoretical maximum brand value is way smaller than the value in certain rankings. With the exception of Oracle, for all the other brands cited before, BrandZ is the ranking attributing the highest brand values whereas the theoretical ones are smaller. We can see the example of Facebook on Fig. 3.
It is interesting to note that this is the case in particular for Facebook, LinkedIn and Twitter. This leads us to think that mostly the recent social networks are overvalued and investors should revise their expectations about companies in that specific sector.
Conclusion
This paper has reviewed the different methods of brand valuation (market, cost or income approach) and focused especially on the income approach. After explaining shortly some more specific approaches as the Royalty Relief method, the Interbrand or
Brand Finance ones, we decided to use the Hirose model as it is the one chosen by the
literature and we applied it to a sample of 20 US companies from the technology sector. Although the results vary according to the rankings we refer to, we can draw the conclusion that brands tend to be overvalued in those rankings in comparison to their
true value. This validates our hypothesis about the subjectivity of brand values and confirms us why they are not reported as intangible assets in the financial statements.
References
Bhattacharyya, Asish K. 2012. Financial Accounting For Business Managers. New Delhi: PHI Learning, p. 84.
Blodget, Henry. 2013. “How Snapchat Plans to Make Money.” Business Insider, November 20. http://www.businessinsider.com/how-snapchat-will-make-money-2013-11 (accessed February 18, 2015).
Branddirectory. 2015. Brand Finance. http://brandirectory.com/methodology (accessed April 5, 2015).
Branddirectory. 2015. Brand Finance.
http://brandirectory.com/league_tables/table/usa-500-2014 (accessed April 5, 2015). Caldwell, Allan. 2004. “How IFRSs puts brands on the balance sheet.” Intangible
Business, November.
http://www.intangiblebusiness.com/news/financial/2004/11/how-ifrss-put-brands-on-the-balance-sheet (accessed May 7, 2015).
Colmant, Bruno, Pierre-Armand Michel, and Hubert Tondeur. 2013. Les normes
IAS-IFRS, une nouvelle comptabilité financière. France : Pearson.
Disle, Charlotte, and Rémi Janin. 2007. “La norme IFRS 3 a-t-elle amélioré le contenu informatif du goodwill ? Étude des amortissements et des dépréciations du goodwill des groupes du SBF 250 sur la période 2001-2005.”
Comptabilité - Contrôle - Audit, 3(13): 247-267.
Duguleana, Liliana, and Constantin Duguleana. 2014. “Brand Valuation Methodologies and Practices.” Bulletin of the Transilvania University of Brasov, 7 (56), No 1: 43-52.
Ernst & Young. 2013. “US GAAP versus IFRS – The Basics”. http://www.ey.com/Publication/vwLUAssets/US_GAAP_versus_IFRS:_The_basics_N ovember_2012/$FILE/US_GAAP_v_IFRS_The_Basics_Nov2012.pdf (accessed December 22, 2013).
European Commission. 2014. “International Accounting Standard 38 – Intangible Assets.” http://ec.europa.eu/internal_market/accounting/docs/consolidated/ias38_en.pdf (accessed March 10, 2014).
European Commission. 2014. “International Financial Reporting Standard 3 Business Combinations.”
http://ec.europa.eu/internal_market/accounting/docs/consolidated/ifrs3_en.pdf (accessed March 10, 2014).
Forbes. 2015. Forbes. http://www.forbes.com/powerful-brands/list/ (accessed April 5, 2015).
Gélard, Gilbert. 2013. “Pourquoi le goodwill pose problème(s)”. Revue Française de
Comptabilité, 466: 29-31.
Ginevicius, Romualdas, and Darius Gudaciauskas. 2004. “Brand Valuation Model.”
Journal of Business Economics and Management, 5(3): 143-153.
Howe, Vince, William H. Sackley, Fredrika Spencer, David Mautz, and Justin Freed. 2013. ““Accounting “for Brand Equity – Value Relevance and Reliability: A Marketing and FASB Dilemma.” Society for Marketing Advances Proceedings, 25: 68-69.
Huang, Rong, and Emine Sarigöllü. 2014. “Assessment of brand equity measures.”
International Journal of Market Research, 56 (6): 783-806.
IASPlus. 2015. Deloitte. http://www.iasplus.com/en/standards/ias/ias38 (accessed February 8, 2015).
IASPlus. 2015. Deloitte. http://www.iasplus.com/en/standards/ifrs/ifrs3 (accessed February 8, 2015).
Interbrand. 2014. “Interbrand’s 15th Annual Best Global Brands Report.” http://interbrand.com/en/newsroom/15/interbrands-th-annual-best-global-brands-report (accessed April 5, 2015).
Jerman, Mateja, and Massimo Manzin. 2008. “Accounting Treatment of Goodwill in IFRS and US GAAP.” Organizacija, 41(6): 218-225.
Moehrle, Stephen R., and Jennifer A. Reynolds-Moehrle. 2001. “Say good-bye to pooling and goodwill Amortization.” Journal Of Accountancy, September 1.
http://www.journalofaccountancy.com/Issues/2001/Sep/SayGoodByeToPoolingAndGo odwillAmortization.htm (accessed March 10, 2014).
Ranking The Brands. 2015. Millward Brown. http://www.rankingthebrands.com/The-Brand-Rankings.aspx?rankingID=6&year=795 (accessed April 5, 2015).
Ratnatunga, Janek, and Michael T. Ewing. 2009. “An ex-ante approach to brand capability valuation.” Journal of Business Research, 62, 323-331.
Roberts, Sophie. 2011. “Brand Valuation: the methodologies.” Intellectual Property
Roy, Thierry. (2006). “Amortissement du goodwill: une divergence France/IFRS qui subsiste.” Revue française de comptabilité, 386, 34-36.
Salinas, Gabriela. 2009. The International Brand Valuation Manual: A complete
overview and analysis of brand valuation techniques, methodologies and applications.
United Kingdom: Ed. Wiley.
Schevin, Pierre. (2005). “Dépréciation d’un goodwill: les nouvelles règles IAS/IFRS.”
Revue française de comptabilité, 382, 48-53.
Seetharaman, A., Zainal Azlan Bin Mohd Nadzir, and S. Gunalan. 2001. “A conceptual study on brand valuation.” Journal of Product & Brand Management, 10 (4): 243-256.
Shinhan Financial Group. 2012. “Proposal of Alternatives for Goodwill Accounting.”
http://www.ifrs.org/The-organisation/Advisory-bodies/EEG/Documents/AP2%20Accounting%20for%20Goodwill.pdf (accessed March 11, 2014).
Sinclair, Roger Neville, and Kevin Lane Keller. 2014. “A case for brands as assets: Acquired and internally developed.” Journal of Brand Management, 21(4): 286-302. Universidad Nacional De Colombia. n.a.. “Intangible Assets: Perspective and Issues”, http://www.fce.unal.edu.co/ (accessed May 3, 2015).
Uzma, Shigufta Hena. 2011. “Challenges of Reporting Intangible Assets in Financial Statements.” The IUP Journal of Accounting Research & Audit Practices, Vol. X(4): 1-38.
Wu, Yen-Chun Jim. 2009. “Renaming effect of brand value: state owned enterprises.”
Appendices
1. General summary of the different brand values
*0 if data non available $ USD billions Interbrand value 2014 Forbes value 2014 BrandZ value 2014 BrandFinance value 2014 Average brand value Average brand value excluding extreme values Brand value (Hirose) Max theoretical brand value Apple 118,86 124,20 147,88 104,68 123,91 121,53 108,08 453,32 Amazon 29,48 21,40 64,26 45,15 40,07 37,31 5,63 76,84 Cisco 30,94 28,00 13,71 20,78 23,36 24,39 9,29 31,94 Dell 0 5,80 0 8,30 7,05 7,05 10,58 249,90 eBay 14,36 9,10 15,59 13,38 13,11 13,87 73,25 114,05 Facebook 14,35 23,70 35,74 9,82 20,90 19,02 1,29 2,40 Google 107,44 56,60 158,84 68,62 97,88 88,03 68,11 237,03 HP 23,76 14,20 19,47 19,82 19,31 19,65 3,90 42,89 Adobe 5,33 0 0 3,52 4,43 4,43 4,12 6,55 IBM 72,24 47,90 105,54 41,51 66,80 60,07 80,46 217,57 Intel 34,15 28,00 11,67 22,94 24,19 19,83 151,02 277,48 Microsoft 61,15 63,00 90,19 62,78 69,28 62,89 39,17 157,21 Netflix 0 0 0 3,18 3,18 3,18 0,78 15,75 LinkedIn 0 0 12,41 2,15 7,28 7,28 0,07 0,10 Xerox 6,64 0 0 4,10 5,37 5,37 109,46 163,68 Oracle 25,98 25,80 20,91 20,64 23,33 23,36 0,72 5,55 AT&T 0 0 77,88 45,41 61,65 61,65 20,09 81,99 Verizon 0 0 63,46 53,47 58,46 58,46 20,22 74,77 Twitter 0 0 13,84 1,53 7,69 7,69 0,51 3,46 Yahoo 0 0 14,17 5,30 9,73 9,73 1,79 3,89