Electrification of Transportation:
From Fuel Policy to Electricity
Market and EV Battery Charging in
Microgrids
Ahmad Karnama
Supervised by:
Professor João Abel Peças Lopes
Professor Frances Sprei
Professor Mauro Augusto da Rosa
Porto, Portugal
July 2020
© Ahmad Karnama, July 2020
The research part of this PhD work was supported financially by Ween Energy AB with organization number 559036-0367 registered in Stockholm, Sweden. In the primary phases of the work, INESC TEC also supported the work by means of a research grant (RG), level 2B, and reference number 424/BI_B2B/10.
Electrification of Transportation:
From Fuel Policy to Electricity
Market and EV Battery Charging in
Microgrids
Ahmad Karnama
Thesis for awarding Doctor of Philosophy degree in Sustainable Energy Systems
from MIT Portugal Program issued by Faculty of Engineering University of Porto in
Porto, Portugal.
Supervisor:
Professor João Abel Peças Lopes
Faculty of Engineering - University of Porto (FEUP),
Porto, Portugal
Co-supervisor: Professor Frances Sprei
Chalmers University of Technology,
Göteborg, Sweden
Co-supervisor: Professor Mauro Augusto da Rosa
Federal University of Santa Catarina (UFSC),
Florianópolis, Santa Catarina, Brazil
To my best friend and the kindest wife, Alaleh
Abstract
Electric Vehicles (EV) are increasing the interdependence of transportation policies and electricity market and power grid. From transportation policy perspective, most policies incentivize low carbon transportation. From electricity market perspective, the growing number of EVs will increase the electricity load and eventually can influence the price of electricity. From power grid perspective, the load from EVs can influence the load and voltage at all voltage levels. This thesis aims to discuss how the clean energy transportation policies can influence the electricity market structure and electricity prices, and on the other hand, how the load from EVs can influence the power grid and how the future power grid should manage the EV load.
Electricity Market Model with Electric Vehicles (EMMEV) is a testing platform to analyze the impact of different low carbon transportation policies on electricity market. It is an agent-based model in which the agents are Energy Service Companies (ESCos). In this thesis, EMMEV is used to investigate the impact of implementation of an Low Carbon Fuel Standard (LCFS) as a policy driver for increasing the use of low carbon vehicles on the electricity market.
Low Carbon Fuel Standard is a market-based policy driver in which the players are fuel distributors, and the regulators set a long-term goal for carbon reduction in transportation. At the end of each year, based on the carbon intensity of their fuel sold, the players are either eligible to get a certificate or are obliged to buy a certificate. This makes a market environment in which the players can gain by selling more low carbon fuels.
The results of the modeling show that the banking strategy of the agents contributing in LCFS can have negative impact on penetration of EVs, if there is no less regular Credit Clearance happening and a price cap is set by the regulators. The electricity price as result of implementing LCFS and increasing number of EVs is between 2-3 percent, depending on banking strategy.
The Micro Grid (MG) concept can be implemented to support the progressive integration of EVs into the Low Voltage (LV) networks by developing smart charging strategies to manage the EVs’ batteries charging to avoid the reinforcements of grid infrastructures. If several EV owners allow the charging of their batteries to be managed while their cars are parked, this thesis proposes an approach that aims to find suitable individual active power set-points corresponding to the hourly charging rate of each EV battery connected
to the LV grid. The Evolutionary Particle Swarm Optimization (EPSO) tool is used to find these active power set-points. This requires an additional software module to be housed in the MV/LV secondary substation level, called Optimal Power Set-points Calculator (OPSC).
Index Terms—Smart Grid, Electric Vehicles, Agent-based modeling, Electricity market modeling, Power Grid,
Acknowledgements
My PhD has been a journey of learning and enjoyment. Not only I feel that I acquired the hard skills to be a thoughtful and expert researcher, but I believe I learnt a lot from the soft skills as well. I entered Porto for the first time in my life on 25 May 2010 with the ambition to become successful researcher. Now after 10 years that I am planning to earn my PhD, I successfully managed to structure my thesis and publish my papers while I was in Stockholm. I managed to get funding for my PhD from my own company and develop my research. This cannot happen without super kind family and super supportive supervisors.
I would like to send my special thanks to my great supervisor Professor João Abel Peças Lopes. I thank him for believing in me, for inviting me to Porto – and for all his support during the last 10 years. He is always responsive to my emails and always there with his support and guidance. I will miss you and for sure I will send you email in the future and I know that I get my response very fast.
My special thanks for professor Mauro Rosa and Frances Sprei. Mauro very kindly agreed to be my supervisor after my move to Stockholm and I appreciate his kindness and excellent support. Frances is an excellent supervisor with undeniable talent. I thank her a lot for agreeing to be my supervisor. Without her support and sharp thinking, I could not achieve what I have achieved. I would like to thank my INESC TEC friends during my time in Porto. I thank Paula Castro for her support in my first days there. Thank you Dr. Julija Vasiljevska for the support in the first days in Porto. My special thanks go to Bernardo Silva, Luis Seca, José Luís Meirinhos, Filipe Soares, David Rua, Jorge Pereira, Leonel Carvalho, Jean Sumaili, Miriam Ferreira, André Madureira, Ricardo Bessa and João Claro. I also thank my great Iranian friends in Porto: Mahmoud Oshagh, Reza Fazeli, Narges Emami, Ali Emami, Hossein Fotuhi, Maryam Vahabi, Ali Fotuhi, Faranak Akahan, Behdad Dashtbozorg, Mohsen Mirkhalaf, Negar Bahramsari, Sam Heshamati, Hana Khamforoush and Aida Ehyaei. I also specially thank my friends in Stockholm: Mehrshad Ahmadi, Maryam Nouri, Ehsan Bitaraf and Shirin Pourmoshir.
I would like to thank my great and supportive family. I thank especially my wife, Alaleh, for her support throughout these years, always motivating me to finish the challenging task of doing a PhD
from abroad. I will always and forever owe my wonderful parents Mohammadreza and Forough a debt of gratitude for their patience and support. I thank my brothers Amin and Iman for being next to me and their great support. Thank you, my kind sisters Reihaneh and Shakoufeh, for also being next to me. Thank you, my kind sister-in-law Aida and brother-in-law Amir. Thank you, my kind mother-in-law and father-in-law Mohammad and Azar, for their support. I would like to thank a lot my grandparents Iraj and Zahra for being patient and always motivating me to finish my PhD. My super kind, pretty and supportive aunts Fariba, Mojdeh, Mojgan and Mahdieh, thank you all. I also thank my aunt Tayebeh for her prayers on my behalf.
Ahmad Karnama
Table of Contents
ABSTRACT IX
ACKNOWLEDGEMENTS XI
TABLE OF CONTENTS XIII
LIST OF TABLES XVI
LIST OF FIGURES XVIII
ACRONYMS AND ABBREVIATIONS XXI
CHAPTER 1 1
INTRODUCTION 1
1.1 ENERGY X.0 7
1.1.1 RENEWABLE ENERGIES 8
1.1.2 SUSTAINABLE TRANSPORTATION 9
1.1.3 LOCAL ENERGY SYSTEMS 10
1.1.4 NEW ENERGY SOLUTIONS 10
1.2 MODEL FOR ELECTRIFICATION OF TRANSPORTATION (MET) 11
1.3 RESEARCH QUESTIONS 13
1.4 OBJECTIVES 14
1.5 ORGANIZATION OF THE THESIS 15
CHAPTER 2 17
STATE OF THE ART 17
2.1 MODEL FOR ELECTRIFICATION OF TRANSPORTATION (MET) 18
2.1.1 TRANSPORTATION FUEL POLICY 18
2.1.2 ELECTRICITY MARKET 23
2.1.3 POWER GRID 25
2.2 AGENT-BASED MODELING 27
2.2.1 AGENT-BASED MODELING TOOL 27
2.3 SUMMARY AND DISCUSSION 29
CHAPTER 3 30
EMMEV: AN AGENT-BASED MODEL 30
3.1 BASIC CONCEPT AND DEFINITION 30
3.2 STRUCTURE OF EMMEV 31
3.3 AGENT-BASED MODELLING APPLIED TO THE ELECTRICITY MARKET 34
3.3.1 THINGS 35
3.3.2 RELATIONSHIPS 37
3.3.3 DIAGRAMS 39
3.4 AGENT-BASED MODELING APPLIED TO ELECTRICITY MARKER AND ONTOLOGY CONCEPT 40
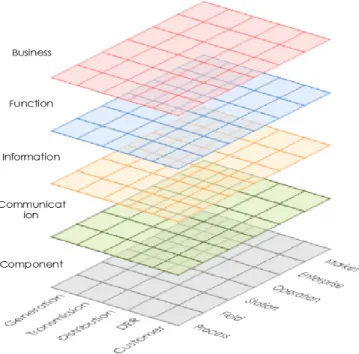
3.5 EMMEV IN SGAM 42
3.5.1 ABOUT SGAM 42
3.5.2 EMMEV IN SGAM 43
3.6 EMMEV DAY-AHEAD ELECTRICITY MARKET MODEL 44
3.6.1 BIDDING 46
3.6.3 PRICE SETTLEMENT 47
3.6.4 HOURLY CONCLUSION 48
3.7 BEHAVIOR OF AGENTS IN EMMEV 48
3.8 CONGESTION MANAGEMENT 54
3.9 SUMMARY AND DISCUSSION 56
CHAPTER 4 57
TEST SYSTEM FOR EMMEV 57
4.1 ELECTRICITY MARKET 59 4.1.1 LOAD 60 4.1.2 ELASTICITY OF DEMAND 61 4.1.3 GENERATION UNITS 63 4.2 LDV TRANSPORTATION 64 4.2.1 ELECTRIC VEHICLES 64 4.4 AGENTS 67
4.3 SUMMARY AND DISCUSSION 68
CHAPTER 5 69
EMMEV RESULTS AND DISCUSSIONS 69
5.1 RESULTS AND DISCUSSIONS 69
5.1.1 ELECTRICITY PRICES 70
5.1.2 SENSITIVITY ANALYSIS 73
5.2 SUMMARY AND DISCUSSION 77
CHAPTER 6 80
OPTIMAL MANAGEMENT OF BATTERY CHARGING OF ELECTRIC VEHICLES WITH MICRO GRIDS 80
6.1 THE MG ARCHITECTURE WITH EVS 80
6.2 THE OPSC OPTIMIZATION PROBLEM 82
6.3 USING EPSO TO IMPLEMENT THE OPSC 84
6.3.1 PARTICLE DEFINITION 84
6.3.2 EVALUATION FUNCTION 85
6.3.3 THE EPSO BASED OPTIMIZATION PROCEDURE 86
6.4 SMALL TEST SYSTEM FOR TESTING OPSC IN A MG 89
6.5 SIMULATION RESULTS AND DISCUSSIONS 92
6.5.1 DUMB CHARGING RESULTS WITHOUT MICROGENERATION 93
6.5.2 DUMB CHARGING RESULTS WITH MICROGENERATION 94
6.5.3 SMART CHARGING WITHOUT MICROGENERATION 95
6.5.4 SMART CHARGING WITH MICROGENERATION 97
6.6 SUMMARY AND DISCUSSION 100
CHAPTER 7 101
CONCLUSIONS AND FUTURE WORK 101
7.1 ACHIEVED RESULTS 101
7.2 FUTURE WORK 103
7.3 FUTURE OF ENERGY X.0, MET AND EMMEV 105
REFERENCES 106
APPENDIX 1 111
APPENDIX 2 113
AGENTS ONTHOLOGY AND CLASSES IN EMMEV 113
A2.1 GENERATIONUNIT 114 A2.2 AGENT 115 A2.3 RUNEMMEV 115 A2.4 GLOBALPLANNER 116 A2.5 MARKET 116 A2.6 MARKETOUTPUT 117 A2.7 BANKINGPLANNER 117 A2.8 EXCELHANDLER 118 APPENDIX 2 119 PUBLICATIONS 119 PUBLICATION 1 120 PUBLICATION 2 128 PUBLICATION 3 148 PUBLICATION 4 150
List of Tables
Table 1 Types of grid resilience services from Electric Vehicles [6] ... 4
Table 2 SWOT Analysis for Renewable Energies ... 9
Table 3 SWOT Analysis for Sustainable Transportation ... 9
Table 4 SWOT Analysis for Local Energy Systems ... 10
Table 5 SWOT Analysis for New Energy Solutions ... 11
Table 6: Mapping of research question to the objectives of this thesis ... 15
Table 7 Organization of the thesis ... 15
Table 8: Comparison of LCFS and Renewables Certificate Market ... 20
Table 9: Comparison between NetLogo and Repast ... 27
Table 10: Actions and responsible entity ... 46
Table 11: The relation between agents studied behaviors and agents provided services ... 50
Table 12 Summary of different congestion management ... 55
Table 13: Description of the parameters in the test system ... 59
Table 14: Peak loads in each area ... 60
Table 15 Various elasticities for electricity demand ... 62
Table 16 Short-term electricity demand elasticity in each area ... 62
Table 17: Generation capacity in each area ... 63
Table 18: Generation units owned by different agents ... 63
Table 19: Number of vehicles in each region in 2016 ... 64
Table 20 Emissions in biofuel and gasoline transportation ... 64
Table 21 Types of EVs in the test system ... 66
Table 22 Agents activity ... 68
Table 23: Scenarios in this thesis ... 70
Table 24: Electricity price changes in 4 scenarios ... 71
Table 25: Sensitivity of variables ... 75
Table 26 Connection of EVs to the grid ... 92
Table 27 Detailed information about EVs ... 92
Table 28: Case studies ... 93
Table 29: Future work related to this thesis ... 103
List of Figures
Figure 1: Development of the car industry ... 2
Figure 2: Evolution of the global electric vehicle stock [4] ... 3
Figure 3: Global EV stock by scenario, 2017-30 [4] ... 4
Figure 4: The overall potential impact of various modes of EV [6] ... 5
Figure 5: Avoided CO2 emissions due to EVs in 2017 [4] ... 5
Figure 6 Full path in electrification of transportation studied in this thesis ... 12
Figure 7: Three phases of introduction of EVs ... 14
Figure 8 Areas covered in Model for Electrification of Transportation (MET) ... 18
Figure 9: Aggregator under the framework of the control structure [48] ... 24
Figure 10: EMMEV structure ... 32
Figure 12: Classes in EMMEV ... 32
Figure 13: The current structure of EMMEV ... 33
Figure 14 Class representation in UML [70] ... 36
Figure 15: Interface representation in UML [71] ... 36
Figure 16: Interaction representation in UML [71] ... 37
Figure 17: Dependencies representation in UML ... 38
Figure 18: Associations representation in UML ... 38
Figure 19 Generalizations ... 38
Figure 20: Realization representation in UML ... 39
Figure 21: Smart Grid Architecture Model ... 42
Figure 22: EMMEV in SGAM ... 44
Figure 23: Actions in day-ahead electricity market model ... 46
Figure 24: Demand and supply curve and at each hour of operation [78] ... 47
Figure 25: Price settlement in EMMEV model ... 48
Figure 26: Hourly conclusion ... 48
Figure 27 Agents interaction for generation in electricity market (dark black lines shows active interaction) ... 51
Figure 28 Agents interaction for retailing in electricity market (dark black lines shows active interaction) ... 52
Figure 30 Structure of the test system ... 58
Figure 31 Load profiles ... 60
Figure 32: Load curves in each area ... 61
Figure 33: EMMEV Process ... 67
Figure 34: Annual average electricity prices in four areas and average in all areas from 2016 till 2030 ... 71
Figure 35: Change in electricity price with EVs and LCFS supports (no banking) ... 71
Figure 36: Change in electricity price with EVs and LCFS supports (banking) ... 72
Figure 37: Impact of LCFS credit prices on EV penetration ... 76
Figure 38: The MG architecture with EVs ... 81
Figure 39: Structure of the particle object parameters ... 85
Figure 40: The EPSO based OPSC approach ... 88
Figure 41: The 24-bus bar LV distribution network ... 90
Figure 42: The load diagram during a typical summer day ... 90
Figure 43: Microgeneration profiles (percentage of the installed capacity) ... 91
Figure 44: LV grid load diagram for dumb charging without microgeneration ... 94
Figure 45: LV grid load diagram for dumb charging with microgeneration ... 94
Figure 46: Hourly active power set-points for each EV ... 96
Figure 47: LV grid load diagram for smart charging without microgeneration ... 97
Figure 48: Hourly active power set-points for each EV ... 99
Figure 49: LV grid load diagram for smart charging with microgeneration ... 99
Figure 50 ENERGY X.0 Logo ... 105
Figure 51 GenerationUnit class in EMMEV presented in UML ... 114
Figure 52 Entity class in EMMEV represented in UML ... 115
Figure 53 RunEMMEV class in presented in UML ... 115
Figure 54 GlobalPlanner class in EMMEV presented in UML ... 116
Figure 55 Market class in EMMEV presented in UML ... 116
Figure 56 MarketOutput class in EMMEV presented in UML ... 117
Figure 57 BankingPlanner class in EMMEV presented in UML ... 117
Acronyms and abbreviations
ABM Agent-Based Modeling
BEV Battery Electric Vehicle
CI Carbon Intensity
DSO Distribution System Operator
DER Distributed Energy Resources
EMMEV Electricity Market Model with EVs
EPSO Evolutionary Particle Swarm Optimization
ESCo Energy Service Company
EV Electric Vehicle
EVI Electric Vehicle Initiative
EX.0 ENERGY X.0
FiT Feet-in-Tariff
LBR Load Balance Responsible
LCFS Low Carbon Fuel Standard
LCV Low Carbon Vehicle
LDV Light Duty Vehicle
LV Low Voltage
MET Model for Electrification of Transportation
MC Mobility Credits
MG Micro Grid
MGCC Micro Grid Central Controller
MV Medium Voltage
OPSC Optimal Power Set-points Calculator
PED Price Elasticity of Demand
PHEV Plug-in Hybrid Electric Vehicle
PLDV Passenger Light Duty Vehicles
PPA Power Purchase Agreement
RCM Renewable Certificate Market
SGAM Smart Grid Architecture Model
SWOT Strength, Weakness, Opportunity and Threat
SOC State Of Charge
ToU Time of Use
VC Vehicle Controller
Chapter 1
Introduction
It was a German inventor, Nikolaus Otto, who first made it possible to use combustion engines in cars by the invention of the first four-stroke internal combustion engine in 1862. This type of engine is continuously being used in so-called conventional vehicles. The low-efficiency of Internal Combustion Engines (ICE) and high emission production are the main drawbacks of driving this type of vehicle.
Between 1889 and 1890 EVs have outsold ICE vehicles in the US. Electric vehicles had many advantages: less vibration, smell and noise from the gasoline-powered cars. The main disadvantage of ICE vehicles was the external starting the vehicle which was difficult, dirty and dangerous; EVs don’t need external starting. In addition, changing gears was problematic and this was resolved in in electric vehicles. But the electric car declined in popularity. There were three main reasons: 1. Longer range vehicles were needed due to better roads that connected cities. 2. Reduction of gasoline price due to discovery of oil in Texas. 3. Hand cranks were not anymore required since Charles Kettering in 1912 discovered electric starter [1].
One of the most important breakthroughs in the car industry after Otto’s invention was the transition from conventional vehicles to ‘hybrid’ electric vehicles (although there had been an early wave of EVs before). This type of vehicle was first introduced in 1997 in Japan through the Toyota Prius. One of the main specifications of them is the operation of the ICE on its efficient interval by
means of a regenerative braking system while the combustion engine is combined with a battery and electric motor. The following figure shows the recent development of the car industry:
Figure 1: Development of the car industry
Electric Vehicle is a generic term which, in this thesis, refers to any type of battery vehicle with charging capability from the power grid. This includes Plug-in Hybrid Electric Vehicle (PHEV) which has both a conventional engine and battery (electric generator) inside and Battery Electric Vehicle (BEV), which is basically a pure Electric Vehicle. These are the next generation of vehicles which are gradually coming on the market. Their main specification which makes them different from other types of vehicles is their capability to be charged from the power grid. The main drivers to introduce Electric Vehicles (EVs) are increasing price and lack of fossil fuel resources, increasing electricity generation from renewable resources and high emissions from conventional vehicles.
More than 27 percent of the world total final energy is consumed in the transport sector, of which more than 95 percent is fossil fuels. In addition, around 35 percent of total fossil fuels in the world is consumed in the transport sector [2]. High prices of fossil fuels, political volatility in the countries with large fossil fuel resources together with high emissions produced from fossil fuels have pushed decision makers to look for new energy alternatives. In this context, the transport sector has considerably high potentials to decrease fossil fuels dependency [3].
Co n v en t i o n a l V eh i c l e H y br i d El ec t r i c V eh i c l e Pl u g - i n H y br i d El ec t r i c V eh i c l e
In 2017, 1.1 million EVs were sold globally (a world record and increase of 54% reference to 2016), leading to a global stock of over 3 million. China accounted for nearly half of electric car sales, with Norway having the highest per capita ownership [4].
Figure 2: Evolution of the global electric vehicle stock [4]
The future of Electric Vehicles is evaluated in the International Energy Agency report. There are two main scenarios which are investigated:
• The New Policies Scenario (NPS) is the central scenario of the IEA’s World Energy Outlook. The scenario incorporates the policies and measures that governments around the world have already put in place, as well as the likely effects of announced policies that are expressed in official targets or plans.
• The EV30@30 Scenario, which is consistent with the ambitions pledged by EVI (Electric Vehicle Initiative) countries1 in the EV30@30 Campaign Declaration (CEM-EVI, 2017
[5]). In this scenario, the EV30@30, which target the 30% market share of EVs for LDVs, buses and trucks collectively – is met at the global level.
1 Governments currently active in the EVI include Canada, the People’s Republic of China (“China”), Finland, France, Germany, India, Japan,
Mexico, Netherlands, Norway, Sweden, United Kingdom and United States. This group includes the largest and most rapidly growing EV markets worldwide and accounted for the vast majority of global EV sales in 2017. Canada and China are the co-leads of the initiative. The International Energy Agency serves as the EVI coordinator.
Figure 3: Global EV stock by scenario, 2017-302 [4]
The increasing number of EVs will create a potential for using the power from the EV’s battery in the grid for resiliency purposes. Table 1 classifies 4 types of grid resilience services that seem to be thoroughly associated with each of the three modes of EV integration. Some services utilize more than one mode of integration, such as frequency regulation which is common to both Vehicle to Grid (V2G) and Grid to Vehicle (G2V). Other services are exclusive to a mode, such as back-up generation, where EVs can be used to power homes, hospitals and institutions, thereby reducing the fatalities and cost of power disconnection [6].
Table 1 Types of grid resilience services from Electric Vehicles [6]
Type of Service Grid-to-Vehicle
(G2V) Demand Response Valley Filling Negative Demand Response Frequency regulation Vehicle-to-
Building (V2B) Emergency back-up Demand Charge Reduction Reserves Negative Demand Response Vehicle-to-Grid
(V2G) Voltage control Frequency regulation Reserves Capacity Firming
The size of impact of any of the above grid resilience services are summarized in Figure 4.
Figure 4: The overall potential impact of various modes of EV [6]
The integrated analysis and the actual data for 2017 done by Aman Verma [7] find that a typical mid-size EV produces up to 67% lower GHG emissions than a gasoline ICE car on a well-to-wheel basis, contingent on where they are driven. The largest savings of global CO2 emissions related to electric vehicles are largely in China (81%) where the number of 2-wheelers is high, even though power generation is carbon-intensive. This has been shown graphically in Figure 5.
Figure 5: Avoided CO2 emissions due to EVs in 20173 [4]
Several fuel alternatives for vehicles including electricity exist in the market but they still have a low share of the vehicle market. EVs have a chance of taking a larger share of the future market. However, apart from high vehicle price which is still the main barrier, policies are not yet motivating enough, and business models are primitive. After a phase of research on feasibility
analysis of large scale deployment of EVs [8] [9] [10], it is now important to develop business models and start the planning for the take-up of EVs in transportation.
In [11], the author tries to model the EV market, taking into account the spatial and social effects without considering the technical charging issues. In [11] a desirability factor for vehicle drivers to change to a new vehicle is introduced. This factor specifies whether the conventional vehicle driver decides to change his or her vehicle to a new vehicle alternative or not. The desirability factor is influenced by two general concerns of the drivers: financial and non-financial (as with environmental issues). The vehicle drivers will change their vehicle between a Gas Vehicle (GV), Hybrid Electric Vehicle (HEV) or Plug-in Hybrid Electric Vehicle (PHEV) if their desirability factor reaches a certain point. Electrification of transportation is an alternative which needs to be promoted. Some studies has investigated the effects of the incentives like in [12]. This thesis presents a model for EVs’ penetration and investigates the effects on the electricity market. The electricity market is where the generation units and retailers trade electricity. This market is introduced after the liberalization in the power systems. The liberalization occurred since promotion of the electricity sector was adopted to induce competition and therefore efficiency. The generation units set their bid price to cover their operational cost. Based on bid prices and amounts and consumption levels, the market price is set. Those players with lower bid prices than the settled market price succeed to sell their electricity. The prices are set in hourly based (15-minute basis in Australia and California) and the players are free to form forward contacts (long-term contracts). This structure is implemented in most of electricity markets around the world (like in NordPool in Scandinavia and MIBEL in the Iberian Peninsula).
Trading in electricity markets can be obtained via:
• Bilateral contracts – Contracts between the generators and retailers or eligible/large customers in a direct way in which prices, electricity demand and generation are set for a period of time.
• Centralized electricity markets – Mechanisms that obtain an economic schedule based on the clearing of the buying and selling electricity bids.
Electricity markets play an important role in the integration of EVs to the power grid. The current models used in research and industry for this market [13] [14] are pretty advanced but the position of EVs is either not considered properly or the models of electricity market with EVs are still simple or the role of EVs management actors (EV aggregators) are not defined adequately. ESCos (Energy Service Companies) are existing players in the market which can act as EV aggregators in the future. An ESCo is a commercial or non-profit business providing a broad range of energy services including designs and implementation of energy savings projects, retrofitting, energy conservation, energy infrastructure outsourcing, power generation and energy supply, and risk management. In this thesis, the term ESCo is used to act also as EV aggregator.
In this thesis, the behavior of EV drivers is assumed to be the same as that of conventional vehicle drivers. This assumption, with an accurate approximation, will make it possible to use the existing data from conventional vehicles to model the EV drivers’ behavior. This behavior can be mathematically modeled as it has been done in [15]. However, the way it is expected that EVs will be charged will have a significant influence on EV load diagram of the system – and eventually on the formation of the price markets.
A model for the electricity market that includes Electric Vehicles aggregators is developed in this thesis and it is investigated how ESCos can make profit from offering EV aggregation services to the customers. This includes the mechanism how to manage the EV’s load as well as defining possible streams of revenue for EV aggregators.
This thesis starts by research questions and then state of the art and objectives are presented. After an introduction, the proposed methodologies are described. Then a test system is presented, and the results based on the developed model called Model for Electrification of Transportation (MET) are presented.
1.1 ENERGY X.0
Climate change is an existential threat to all of us and the energy sector is primarily responsible. There has been a long debate whether climate change is real or not. I believe that the scientific proofs to support the climate change are undeniable, but the concerns of those whom deny climate change must be considered [16]. To have truly neutral judgment, the risk of such a threat must be
calculated. To calculate the risk of any threat, the severity is multiplied by its likelihood. Even if the likelihood of climate change is very low (based on the opinions of those who deny climate change), the risk is still very high due to the extreme level of severity. This is a global threat, and nobody is safe if it is real. Therefore, energy sector is in need of a revolution to save our planet. On the other hand, technological progress is at a tipping point where such revolution is no longer a cost; in fact, it makes reasonable returns on the investments. Energy X.0 encapsulates the visions for such a revolution in the energy systems, considering technological progress and the need for a revolution to save our planet. The target groups for such a revolution are three main groups:
1. Utilities
2. Large Energy Consumers 3. New Players
Utilities are convectional energy providers and their primary interests are to provide reliable energy services, maintain their market position, and even expand their business [17]. Large Energy Consumers are referred to large industries or groups of smaller energy consumers. Their interest is to maintain, or even increase, their security of supply and decrease their costs and dependency on utilities. The New Players in the energy market are referred to opportunistic SMEs. Their interest is to serve the needs of energy consumers and bypass utilities, or at least stop them from further expansion into new business opportunities [18]. Energy X.0 has four pillars, as shown below:
1. Renewable Energies 2. Sustainable Transportation 3. Local Energy System 4. New Energy Solutions
In the next sections, a Strength, Weakness, Opportunity and Threat (SWOT) analysis for the three pillars in four pillars of ENERGY X.0 is performed. SWOT analysis is a framework used to evaluate a company's (in this thesis, the three players introduced above) competitive position and potentials for future growth. SWOT analysis assesses internal and external aspects, as well as current and imminent potential.
1.1.1 Renewable Energies
A desert of 1 million km2 (equal to almost twice the size of Sweden) covered with solar panels can
Large Energy Consumers, and New Players to gain as much as possible from these type of free energy resources [19]. However, there are challenges as well which are introduced in the following table.
Table 2 SWOT Analysis for Renewable Energies
Through technology advancements and the reduction in the price of technologies, the returns on renewable investment are becoming much more reasonable than before. Utilities can invest in renewable power plants and not only contribute to a low-carbon society, but also receive reasonable returns on investments. The Large Energy Consumers can be part of those investments in distributed energy generation units. Not only can they get a return on their investments but also gain independency from utilities (this will be described in more detail in the Local Energy System section).
In this environment, New Players can enter the market much easier than before. The size of investment on a distributed generation unit (like solar or wind) can be a fraction of the larger power plants. In addition, the knowledge in this area is still fresh and easier for the New Players to learn.
1.1.2 Sustainable Transportation
About 36% of the total energy consumption in the world is in the transportation sector; in total this sector is responsible for 20% of emissions. Any vision for the future of energy systems without considering transportation is incomplete. Electrification of transportation, fuel cells, and green fuels are among the most mature alternatives for the future of transportation.
Table 3 SWOT Analysis for Sustainable Transportation
Strength Weakness Opportunity Threat Utilities Established
market position
Low
organizational agility
Potential for market expansion
Loss of market share to the New Players Large Energy
Consumers
Asset ownership Lack of knowledge
Energy cost reduction Reduction of
dependency on utilities
Loss of business focus
New Players Organizational agility
Need of capital and reputation
Easy market entry due to blue ocean
Changing market environment
Strength Weakness Opportunity Threat Utilities Established
connections
Unknown market position
Potential for new business opportunity
Loss of business focus
Utilities can act as a distributor of energy for transportation. In the e-mobility sector, utilities have already placed themselves as aggregators for changing stations. However, gaining short-term profitability from such a market is still difficult.
1.1.3 Local Energy Systems
Increasing energy generation from distributed resources makes it possible to have local energy systems. Central energy systems were necessary when the large power plants supplied energy. Nowadays, energy consumers can be ‘prosumers’ and can go one step further to own their own local energy system.
A Local Energy System or a Micro Grid consists of a group of energy consumers, generation units (mainly renewables), storage, and control systems to operate a section of the power grid independently of the main grid at least part of its operation time.
Table 4 SWOT Analysis for Local Energy Systems
1.1.4 New Energy Solutions
Digitalization is changing our energy systems. New and digital energy solutions, such as Smart Homes, Advanced Energy Monitoring Systems, and Visualization systems using Artificial Intelligence and Virtual Reality, are changing the perspective of future energy systems.
Large Energy Consumers
Asset ownership Lack of knowledge
Contribution of low-carbon society and green branding
Higher costs New Players Organizational
agility Low access to capital High long-term potentials Low short-term return on investment for cash-constraint players
Strength Weakness Opportunity Threat Utilities Access to end
consumers
Lack of innovation ecosystem
Potential for new business opportunity Expose to competition Large Energy Consumers Asset ownership Lack of knowledge Contribution of low-carbon society
Higher costs and immaturity of the technology New Players Organizational
agility
Low access to capital and past experiences
Create an energy disruption to get a market share from utilities Low short-term return on investment for cash-constraint players
Table 5 SWOT Analysis for New Energy Solutions
Digitalization is much more advanced in other sectors in comparison with energy sector. The technology is advanced and ready to be used. However, cost-effective business cases are not available. All the above groups can pay their share to define such business cases. Utilities have access to all historic data and have the past knowledge of energy systems. Large Energy Consumers know their needs and the vision on how to save energy and optimize energy consumption [20]. Finally, the New Players bring the energy and enthusiasm to drive change and make New Energy solutions a reality. In this thesis, Sustainable Transportation and Local Energy System are being discussed and addressed.
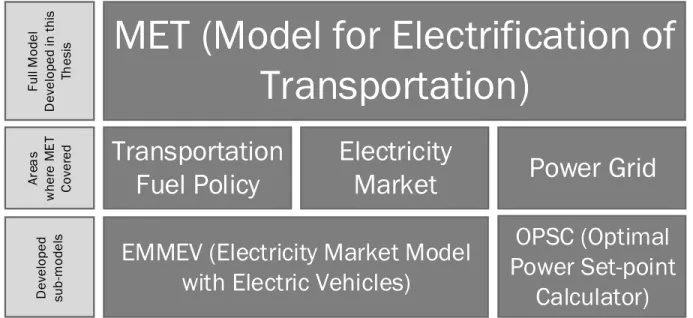
1.2 Model for Electrification of Transportation (MET)
The state of the art of this thesis is that modelling the path in electrification of transportation from policy to electricity market and finally to charging poles are studied as shown in Figure 6.
Strength Weakness Opportunity Threat Utilities Access to
end-consumers data Lack of innovation ecosystem Potential new opportunities Expose to competition and change of regulation Large Energy Consumers
Asset and data ownership
Lack of knowledge and experiences
Cost saving Cyber-security threats
New Players Organizational agility and innovation thinking
No access to data New business opportunity and blue ocean
Pave the way for big players
Figure 6 Full path in electrification of transportation studied in this thesis
The first step in electrification of transportation is to introduce relevant fuel policy to support the low-carbon transportation. Model for Electrification of Transportation (MET) has the flexibility to get different policies as input. In this thesis, Low Carbon Fuel Standard (LCFS) is selected and modelled.
The second step is to model how the increased number of EVs is managed in the electricity market and how this can affect the electricity price and revenue of those entities managing the EVs (EV aggregators). In this thesis, the Energy Service Company (ESCo) can make profit by offering EV aggregation services. The two main streams of revenue for ESCo through EV aggregation services are from the electricity market and Low-carbon Fuel Standard (LCFS). In the electricity market, ESCo can earn money by contributing in day a head market, power regulation or automatic reserve. However, in this thesis, the day-ahead market is considered and modelled. On the other hand, ESCo can gain from their EV aggregation services and LCFS. This part of the path toward electrification of transportation is modelled in Electricity Market Model with Electric Vehicles (EMMEV). Finally, the increased number of EVs needs to be charged by means of charging poles in the power grid. In this thesis, the management of the load from electric vehicles in a Micro Grid structure is introduced. The Optimal Power Set-points Calculator (OPSC) is introduced to calculate the power set-point of each charging pole at each hour based on the power systems constraints.
MET (Model for Electrification of
Transportation)
Transportation
Fuel Policy
Electricity
Market
Power Grid
EMMEV (Electricity Market Model
with Electric Vehicles)
OPSC (Optimal
Power Set-point
Calculator)
Fu ll M ode l D ev elo pe d in thi s Th es is Ar ea s w he re M E T Co ve re d D ev elo pe d su b -m ode ls1.3 Research questions
Sustainable transportation and electrification of transportation are very much interrelated [21]. It is hard to imagine reducing emissions in transportation by ignoring the role of electrified transportation. A Life Cycle Analysis is needed to know exactly how electrification can reduce emissions in transport and make a local decision for promotion alternative fuels. However, in most cases, electricity can make significant contribution [22]. Therefore, sustainable transportation programs in different countries almost always involve e-mobility programs. EVs have high potential of taking a large share of future vehicle sales, as described in [4] and in Figure 3. As discussed above, researchers around the world have been performing a wide and promising range of studies on the availability of the grid for large-scale integration of EVs and the incentive analysis for EVs [8].
E-mobility programs include policy drivers in order to encourage the vehicle buyer to pay the higher price of Electric Vehicles (EVs) and promote installation of charging infrastructure [23] [24]. These will eventually increase the number of EVs and raise electricity consumption [8] [25] and will impact on the electricity market as a single platform for the electricity trade.
One of the regulatory measures for increasing the share of low carbon fuels is called Low Carbon Fuel Standard (LCFS) [26]. A LCFS regulates the carbon content of different fuels in transportation in order to reduce the emissions. It is quantitative and performance-based policy driver which tends to decrease Carbon Intensity (CI) in transportation fuels. This has been implemented in California and is being discussed to be implemented in other places [27] [26]. More details will be provided on the State of the Art.
EMMEV is a platform for testing different policy drivers with a view to increasing the number of Electric Vehicles and charging infrastructure on the electricity market. In this thesis LCFS is used as a policy to be tested. The area which EMMEV targets is the intersection of the electricity market with low-carbon transportation support policies. Throughout this thesis, the mutual effects of LCFS and the electricity market are described and discussed. The research questions are as follows:
1. How does LCFS policy increase the number of EVs?
3. What are the factors, including the ones from the electricity market, which make LCFS a more effective policy?
4. How do the technical constraints on a power system influence the charging of EVs? These questions are addressed and discussed throughout this thesis.
1.4 Objectives
In [28], three phases of introduction of EVs are defined: catalyst, consolidation and advanced. Catalyst phase refers to the existing situation of introducing EVs when there are few EVs in cities and policies mainly target the uptake of EVs. In the consolidation phase, a larger number of EVs are introduced in the cities and the major policy target areas are EV management. This includes adapting the design of the energy market and studying the design of Time of Use (ToU) kind of tariffs. Finally, the advanced phase targets a full integration of EVs and adjustments such as a harmonization of the market.
Figure 7: Three phases of introduction of EVs
In the consolidation phase of EV development, when the results of this thesis are useful, the main objectives of this thesis are defined as follows:
1. Developing a model of electricity market with EVs in Agent-Based Modeling (ABM) platforms
2. Investigating what type of business models are both more profitable for ESCo business owners and will promote dissemination of EVs
3. Defining electricity market rules to ease the progress of EVs’ development to the advanced phase with large amount of EVs proliferating in the cities
4. Investigating Electric Vehicles in a Micro Grid structure.
The objectives and the research questions are mapped to each other as shown in the
Table 6: Mapping of research question to the objectives of this thesis
No. Research question Related objective
1 How does LCFS policy increase the number of EVs? 1, 2, 3 2 How does the increased number of EVs influence
electricity price?
1, 2, 3 3 What are the factors, including the ones from the
electricity market, which make LCFS more effective policy?
1, 3 4 How do the technical constraints on a power system
influence the charging of EVs?
4
This thesis intends to investigate, in the complex environment of the electricity market, the needs for new regulation as well as business opportunities for ESCos. In addition, from the grid side, the charging of EVs in Micro Grid is investigated.
1.5 Organization of the thesis
This thesis is structured around Model for Electrification of Transportation (MET) with its three main topics:
1. Fuel Policy 2. Electricity Market 3. Power Grid
The thesis is organized in 7 chapters as follows: Chapter 1. Introduction
Chapter 2. State of the Art
Chapter 3. EMMEV: An Agent-Based Model Chapter 4. Test System for EMMEV
Chapter 5. EMMEV Results and Discussions
Chapter 6. Optimal Management of Battery Charging of Electric Vehicles with Micro Grids Chapter 7. Conclusions and Future work
Table 7 shows the organization of the thesis in each chapter, the related topic in each chapter.
Table 7 Organization of the thesis
1 Introduction 1, 2, 3
2 State of the Art 1, 2, 3
3 EMMEV: An Agent-Based Model 1, 2
4 Test System for EMMEV 1, 2
5 EMMEV Results and Discussions 1, 2
6 Optimal Management of Battery Charging of Electric
Vehicles with Micro Grids 3
7 Conclusions and future work 1, 2, 3
The thesis starts with an introduction, Chapter 1, then, in Chapter 2, State of the Art is described. Electricity Market Model with EVs (EMMEV) is described in detail in Chapter 3. In these chapters, the author describes his perspective on modeling and Agent-Based Modeling. In addition, classes and general structure of the EMMEV are described. Two legs of EMMEV (day-ahead electricity market and Low Carbon Fuel Standard) are described.
In chapter 4, the test system, which is being used to test EMMEV as whole, is described. In chapter 5, results from EMMEV are presented. This included the interactions between two legs of EMMEV.
Chapter 6 discusses more charging strategy of EVs in Micro Grid environment. A separate test system and some results from Optimal Power Set-point Calculator (OPSC) are outlined in this chapter.
Finally, in Chapter 7, the thesis contribution in the science developments in this field are described and future works from this thesis are proposed.
Chapter 2
State of the Art
This thesis investigates and models the charging of Electric Vehicles from upstream related to support scheme and electricity trade in the electricity market to downstream related to charging infrastructure and strategies. This has been shown in Figure 6. The state of the art of this thesis is that the full path in electrification of transportation from policy to electricity market and finally to charging poles are studied.
The management of Electric Vehicles charging in the structure of the electricity market is addressed by an Agent-Based model called Electricity Market Model with EVs (EMMEV). The number of EVs is set by a transportation support scheme. The support scheme chosen for this thesis is called Low Carbon Fuel Standard (LCFS). LCFS is a support mechanism for increasing the share of low carbon vehicles. This is a market-based mechanism, and the market regulator sets long-term targets for the share of low carbon vehicles. EMMEV considers only participation of EVs in the day-ahead market. In the day-ahead market, the price of electricity is set. Therefore, the extra load from EVs can affect the price of electricity. All the models consider perfect competition market environment. Charging infrastructures and EV charging strategies are investigated in Micro Grid structure. Since EVs will partly get their required energy from the power grid, they are considered as a new type of load with considerable charging requirements, and therefore the technical impacts of progressive integration of EVs in system operation have to be evaluated based on planned scenarios, especially for distribution networks. In addition, further scenarios characterized by increasing penetration
levels of renewable power sources with intermittent nature, such as wind and photovoltaic generation, and also microgeneration systems connected to Low Voltage (LV) distribution grids should be taken into account.
2.1 Model for Electrification of Transportation (MET)
Figure 8 shows the areas which MET covered and will be described in details in this section of the thesis.
Figure 8 Areas covered in Model for Electrification of Transportation (MET)
As shown in Figure 8, Electrification of Transportation is a process that several elements needs to aligned. First, there has to be a proper fuel policy to motivate people to transform their vehicle to electric. This is mainly financial incentives due to higher cost of EVs. Electricity market needs to have proper processes to accommodate Electric Vehicles. Finally, power grid needs to be ready and has enough capacity to accommodate the charging of EVs. In this section of the thesis, the state of the art for this thesis which is the model for the full path toward electrification of transportation is described.
2.1.1 Transportation Fuel Policy
The transition to low-carbon transportation fuels is becoming more important and needs a fast change [29]. However, introduction of low carbon fuels in transportation is hindered by many limitations and problems. These include reduced investments and barriers in technology development and energy industries, other forms of technological and market inertia delaying
MET (Model for Electrification of
Transportation)
Transportation
Fuel Policy
Electricity
Market
Power Grid
Full M ode l D ev el op ed in th is Th esi s Ar ea s w he re M E T Co ve re d
investments in deployment and R&D, cartel pricing, and the failure of markets to assign a price to greenhouse gas (GHG) emissions [26].
Various policies are adopted to overcome these market failures and barriers, ranging from regulatory measures, such as emission regulations and fuel economy standards, to financial levers such as tax reductions, rebate and feebate [30] schemes. There are other drivers such as waivers for parking places and tolls and specifying separate driving lanes for EV drivers. Each has different advantages and disadvantages [24].
Among the regulatory measures, LCFS is a quantitative and performance-based policy to reduce GHG emissions in transport. An LCFS is a policy designed to accelerate the transition to low-carbon alternative transportation fuels by stimulating innovation and investment in new fuels and technologies. The goal is to provide a durable policy framework that will stimulate innovation and technological development. Since 2007, an LCFS policy has been adopted by California, the European Union (Fuel Quality Directive, FQD), and British Columbia (Renewable and Low- Carbon Fuel Requirement Regulation, RLCFRR) [31] [32] [33].
The design of an LCFS is premised on the use of technology-neutral performance targets and credit trading, with the intent of harnessing market forces and providing industry with flexibility. It is also premised on the use of life-cycle measurements of GHG emissions, to ensure that emissions are regulated effectively and scientifically. An LCFS is a hybrid of a regulatory and market policy instrument. It does not include mandates for any particular fuel or technology and as such does not attempt to pick winners or losers. Instead, it defines an average emissions intensity standard— measured in grams CO2 equivalent per mega-joule of fuel energy (gCO2e/MJ)—that all energy
providers must achieve across all fuels they provide. Many options exist for meeting the standard. Regulated parties are free to employ any combination of strategies that suits their particular circumstances and perspectives—including the purchase of credits from other companies.
There is similar market to LCFS but in renewable electricity generation sector which is called Renewables Certificate Market (RCM). RCM was first started in 2002 by RPS (Renewable Portfolio Standard) [34] and it was also implemented in 2003 in Sweden, where it was called
main goal of this market is to promote electricity generation from renewable resources [36] [37]. This market has been compared with LCFS in Table 8.
Table 8: Comparison of LCFS and Renewables Certificate Market
Market Main goal Players Certificate receivers Quota obligation
RCM Promote renewable electricity generation Electricity generation units and large electricity consumers and electricity retailers
1 certificate for each MWh of electricity
generated from renewable resources
1 quota obligation for some percentage
of electricity consumption LCFS Promote carbon free transportation
Energy providers for transportation
1 credit for CI reduction
1 credit for sales of fuel with higher CI
than LCFS
Both LCFS and RCM aim to reduce GHG emissions. The target of RCM is the electricity generation sector while LCFS aims to reduce GHG emissions in the transportation sector. The players in RCM are generation units and the electricity consumers. However, in LCFS, the players are energy providers in the transportation sector.
In RCM, each player can receive one certificate for each MJ of electricity generated from renewable resources. Electricity consumers are obliged to buy certificates based on the amount of electricity they consume. In LCFS, each player may receive a credit/deficit for each equivalent MJ of energy sold to the end user. LCFS defines an average emissions intensity standard that all energy providers must achieve across all fuels they provide.
2.1.1.1 Operation of Low Carbon Fuel Standard
LCFS is a policy instrument enabler to promote carbon-free transportation. In a perfect competition environment, it is expected in LCFS that fuels with lower Carbon Intensity (CI) will naturally get the higher share of the market. The goal is to introduce a quantity-based carbon-free fuel promotion in the transportation sector in order to reach a target for GHG emissions. In California LCF, the target is 10% reduction in overall Carbon Intensity by 2020 [38].
Mobility Credit (MC) is credit which LCFS issue to the market players for their low-carbon fuel distribution. There are some players in the market who are obliged to buy Mobility Credits (MCs) from those who are eligible to receive MCs from regulators. [39] [40]. The lower the CI of supplied fuel, the higher the chance of each specific player receiving credit (positive credit) and the higher the CI of a fuel, the higher the chance of each specific player being obliged to receive deficit (negative) credits.
All companies which provide fuel to the end users in the transportation sector are the market players. They are indirectly mandated to reduce GHG emissions by reforming the fuel supply. Considering three groups of fuel alternatives in transportation, gas (all type of conventional fuels and biofuels), hydrogen and electricity, the players are as follows:
• Biofuel producers and distributors • Gasoline producers and distributors • EV station owners.
It is true that most of the time biofuel and gasoline have the same stations, but it is assumed that the credit goes to the different sections of the same distributor for different fuel types. The revenue from MCs needs to be distributed among the energy providers and car drivers to both support the installation of infrastructure and cover the higher price of carbon-free vehicles.
2.1.1.2 Electricity in LCFS
In California, LCFS have been introduced since 2009 to reduce Carbon Intensity (CI) by 10% until 2020 [40]. On September 25, 2015, the LCFS Board in California approved the re-adoption of the LCFS. Under the new regulations, new players are introduced in the market in which electricity used as a transportation fuel can generate MCs. These players are Electric Vehicle Service Providers (EVSP) for public charging, Electric Vehicle (EV) fleet operators, battery switch station owners, site hosts of private access EV charging equipment at a business or workplace, transit agencies operating a fixed guide system or electric buses and the Electrical Distribution System Operators (DSO) for residential charging, and for all of the above categories. These, in general, are the ESCo which are in charge of EVs [41].
Several lower-carbon fuels, as they meet the CI targets in 2020, will be exempted from LCFS. The entities which are providers of those fuels have no obligations for these fuels under LCFS, in case
they decide not to join in the LCFS program. However, if they decide to participate in LCFS, they can gain MCs and trade it in the structure of LCFS [41].
2.1.1.3 Trading in LCFS
At the end of a compliance period (one year for most LCFS programs), a player that owns credits and also has incurred deficits must ‘retire’ a sufficient number of credits to meet the obligation for that compliance period. The regulator normally sets a maximum price at the beginning of each year ($200 for California) [40]. The players in the LCFS can trade in their MCs in one of the following markets:
• Ongoing LCFS Credit Market • Credit Clearance Market.
The ongoing LCFS is like a bilateral contract in which at any time during their compliance period, the players can trade their credits with a bilateral contract. This is very much similar to forward contract in the electricity market [42]. The risk in those contracts are generally lower.
The players must acquire credits pledged into the Credit Clearance Market to be retired toward compliance in the previous compliance year. Credits acquired for this purpose are defined as “Clearance Market” credits [40].
MC are calculated based on a CI defined by regulators for each year. This number is expressed in gCO2E/MJ. All the players are evaluated based on this number in order to be eligible to get MC
(have credit) or obliged to buy MC (have deficit). In California in 2015, the LCFS was readopted and the CI modeling updated. The average carbon intensity requirements for years 2016 to 2020 reflect reductions from revised base year (2010). The maximum pass through LCFS for 2016 is
99.7 gCO2E/MJ.
In order to calculate MC, the following steps should be followed [39]. First, the energy (MJ) for the sold energy in transportation by each player is calculated. The conversion factors from liter (in case of liquid fuels) or kWh (in case of electricity fuel) are available by regulators.
As the second step, the Energy Economy Ratio (EER) is considered. EER aims to account for differences in energy efficiency for vehicles and adjusts to take these differences into account. EER
for gasoline is 1 (meaning that it doesn’t make a difference), but it is 3 for electricity (meaning each MJ of electricity is three times more efficient than gasoline).
The third step is to calculate the difference between the LCFS and the CI of the fuel sold. If LCFS is lower than CI of the fuel sold, the player is producing deficit and is obliged to buy MC (get deficit). In case of higher LCFS than the due amount sold, the player is eligible to receive MC (get credit).
The fourth and last step is to convert the credit/deficit into grams of CO2 equivalent. Credit/deficit
are expressed in greenhouse gas emissions volumes, where credits indicate the emissions “saved” by selling a low carbon fuel compared to selling a fuel that exactly meets the low carbon fuel standard for that year. The final number shows the number of deficit/credit that each player will get for the fuel sold each year.
2.1.2 Electricity market
The role of EV aggregator is defined and analyzed in different literature including [43] [44] [45] [46]. An aggregator is an enabler of the EV integration in the electricity market and power system operation. Power system operators see the EV aggregator as part of a hierarchical control architecture, which coordinates the EV charging in response to the system operators’ signals. EV owners see the aggregator use their available flexibility to purchase electrical energy at a low price and sell ancillary services in the electricity markets, which ultimately lead to a retailing tariff reduction [47]. The aggregators are under the framework of the control structure in the power system and this has been shown in Figure 9 [48].
Figure 9: Aggregator under the framework of the control structure [48]
EV aggregators are a middle entity between the Distribution System Operator and the EV drivers to manage and control the load from the EVs. The EV Management Center manages the aggregators in connection to Distribution System Operators.
2.1.2.1 EVs in the future electricity markets
Electric Vehicles (EVs) load is sufficiently considerable that they can participate in the day-ahead market. However, due to their flexibility, they can participate in power regulation or automatic reserve. Therefore, EVs can participate in the electricity market in the following modes [49]:
1. Day-ahead market 2. Power regulation market 3. Automatic reserve
2.1.2.2 EVs in day-ahead market
This is the most straight-forward market where EVs can contribute. Load Balance Responsible (LBR) is an entity in the electricity market which is responsible to balance the demand and supply of power. LBR will send the bids from EVs to the market. There, different models with or without EV aggregator contribution are defined by different authors such as [50]. In the case without
aggregator, the load from EVs is considered as normal load and it is traded in Electricity Market. In case of EV aggregator, the load from EVs is aggregated and separate entity trade the relevant load in the electricity market.
2.1.2.3 EVs for power regulation
The existing additional requirement of real-time measurement is problematic and will either have to be relaxed or addressed in case EVs are to gain access to the regulating power market. If the requirement is relaxed for smaller units, concepts such as Flex-Power [50] will become viable. If the bid requirement is also relaxed, a ‘self-regulating’ concept will become relevant, as it places the responsibility for anticipating the demand response in the hands of the transmission system operator (TSO) and, thus, does not require the retailers to send bids for delivering regulating power. As is the case with EV participation in the day-ahead market, congestion in the distribution grid also requires a fleet operator and/or new various market tools.
2.1.2.4 EVs as automatic reserve
If EV owners are willing to participate in the market for automatic reserves, they will either have to enter into an agreement where they receive compensation in return for allowing their vehicle to stop charging when the frequency drops, or enter into an agreement with a fleet operator who will be able to provide automatic reserves by pooling EV users. In the first concept, a device that automatically cuts out when the frequency drops below a predetermined set point is required. The fleet operator concept, meanwhile, requires a technology to allow for the fleet operator to control the charging of the vehicles, and in this regard could provide frequency control in either direction [50]. This is called local and dedicated EV load-shedding mechanism [51]. In other words, part of the load can be shed locally in case of low frequency for specific number of EVs.
2.1.3 Power Grid
Different authors analyzed the technical feasibility of large scale introduction of EVs independent of economic and policy issues [52] [53] [10] [9] [54]. These studies made scenarios for driving of EVs and future load pattern from EV charging. The results showed that the existing grid infrastructures can handle a large percentage of existing conventional cars converted to EVs in case smart charging pattern is implemented. However, residential areas are subject to more problems from grid infrastructures capacity perspective in case one-phase charging facility is the only
available one. These studies reveal that the power grid has a large enough capacity to accommodate a high number of EVs by implementing smart charging strategies.
EVs, due to their low driving cost and the ubiquitous availability of electricity, have a higher chance to replace conventional vehicles compared to, for example, fuel cell vehicles. Supporting the last statement, R. Fazeli and V. Leal developed a multi-criteria decision-making problem for the fuel alternatives in transportation [22]. Based on the different attributes including emissions, vehicle costs and availability of the fuel, EVs are among the top-ranked alternatives. Bandivadekar [55] performed similar studies on the impact of different fuel alternatives in US light-duty vehicles, and the results indicate a dominant position for EVs in the future share of vehicles. In addition, a life cycle analysis of three important alternatives for the future of the transportation sector (internal combustion engine, fuel cell and EVs) shows that EVs have relatively much lower life cycle costs [56]. Therefore, it seems to be fair to assume that with the increase of EVs, significant emission reduction is achievable (This is only possible if renewable generations units are the majority in the electrical energy portfolio of generation).
By increasing integration of renewable resources to the distribution grid, it is expected that the grid is operated by exploiting Micro Grids concept. Micro Grid is a localized grouping of electricity generation, energy storage, and loads that normally operate connected to a traditional centralized grid. This makes it possible to manage the integrated EVs by means of the controllers defined for this purpose [57]. In the hierarchy control scheme of a Micro Grid, there are both local controllers and a head controller (Micro Grid Central Controller) who maintain control both locally in each low voltage bus bar and globally in the medium voltage bus bar. The control variable for smart management of EVs is the power set-points of each EV. A new feature is embedded in the Micro Grid Central Controller (MGCC) which calculates the power set-points of EVs integrated to the Micro Grid. This feature is called Optimal Power Set-points Calculator (OPSC) which is described in [58].
The implementation of a smart management system where the EVs are supposed to be connected to active LV networks with microgeneration units, involves dealing with the Micro Grid (MG) concept [9]. Thus, single phase electrical batteries belonging to EV are included on the MG through a smart power electronic interface with a specific control approach called the Vehicle Controller (VC). In charging mode, the VC will receive active power set-points from a Micro Grid Central
Controller (MGCC), housed at the MV/LV secondary substation level, to charge the EV batteries, considering the LV network operating conditions. A Micro Grid (MG) is a group of electricity generation units and loads in a certain location which can be operated both in connected mode to wide area synchronous grid or also in islanded mode.
2.2 Agent-Based Modeling
The Oxford American Dictionary define the word ‘agent’ as ‘a person or thing that takes an active role or produces a specified effect’. Computer science researchers have used the word ‘agent’ for more than twenty-five years as ‘an entity that performs a specific activity in an environment of which it is aware and that can respond to changes’[59].
The modeling tool in this thesis is Agent-Based Modeling (ABM) [60]. ABM is composed of several agents. The agents may have the inherent properties of flexible autonomy, re-activity, pro-activeness, social ability, the distributable nature of agents, the possibility of emergent behavior and the fault tolerance of the agent systems in a certain environment based on the dimension of the complexity defined above[61] [62].
Multi-Agent Systems (MAS) is the other term which is being used in some texts and which can lead to some confusion. Agent-Based Modeling (ABM) and Multi Agent System (MAS) refer to the same modeling way while ABM aspires to descriptive perception into the combined behavior of agents, while the goal of MAS is to procure agents or solve specific practical or engineering problems [63].
2.2.1 Agent-Based Modeling Tool
There are several tools available in order to model a system with agents. Among those, Repast are chosen for this thesis. These tools are compared in the following table.
The MAS modeling platforms which will be used to develop a preliminary model is called NetLogo [64]. NetLogo is also an agent-based programming language and integrated modeling environment. The programming language is inspired by Logo programming language and the program is easy to understand.
Table 9: Comparison between NetLogo and Repast
![Figure 2: Evolution of the global electric vehicle stock [4]](https://thumb-eu.123doks.com/thumbv2/123dok_br/15938183.1095934/25.918.114.806.224.466/figure-evolution-global-electric-vehicle-stock.webp)
![Figure 3: Global EV stock by scenario, 2017-30 2 [4]](https://thumb-eu.123doks.com/thumbv2/123dok_br/15938183.1095934/26.918.141.832.111.335/figure-global-ev-stock-scenario.webp)
![Figure 4: The overall potential impact of various modes of EV [6]](https://thumb-eu.123doks.com/thumbv2/123dok_br/15938183.1095934/27.918.262.662.107.313/figure-overall-potential-impact-various-modes-ev.webp)


![Figure 9: Aggregator under the framework of the control structure [48]](https://thumb-eu.123doks.com/thumbv2/123dok_br/15938183.1095934/46.918.247.670.108.490/figure-aggregator-framework-control-structure.webp)

![Figure 13 Class representation in UML [70]](https://thumb-eu.123doks.com/thumbv2/123dok_br/15938183.1095934/58.918.207.700.118.362/figure-class-representation-in-uml.webp)