Ciência Téc. Vitiv. 35(2) 133-147. 2020
133
This is an Open Access article distributed under the terms of the Creative Commons Attribution License
(https://creativecommons.org/licenses/by/4.0), which permits unrestricted use, distribution, and reproduction in any medium, provided the original work is properly cited.
WINE TRACEABILITY AND AUTHENTICITY: APPROACHES FOR
GEOGRAPHICAL ORIGIN, VARIETY AND VINTAGE ASSESSMENT
RASTREABILIDADE E AUTENTICIDADE DO VINHO: ABORDAGENS PARA A AVALIAÇÃO DAORIGEM GEOGRÁFICA, CASTA E ANO DE VINDIMA Andrea Zava1, Pedro J. Sebastião2,3, Sofia Catarino1,2*
1LEAF—Linking Landscape, Environment, Agriculture and Food, Instituto Superior de Agronomia, Universidade de Lisboa, Tapada da Ajuda,
1349-017 Lisboa, Portugal.
2CEFEMA—Center of Physics and Engineering of Advanced Materials, Instituto Superior Técnico, Universidade de Lisboa, Av. Rovisco Pais, 1,
1049-001 Lisboa, Portugal.
3Department of Physics, Instituto Superior Técnico, Universidade de Lisboa, Av. Rovisco Pais, 1049-001 Lisboa, Portugal.
* Corresponding author: Tel.: +351 21 3653438, e-mail: [email protected]
(Received 29.06.2020. Accepted 02.10.2020)
SUMMARY
The aim of this work is to identify and discuss physicochemical wine characteristics, to provide to some extent a link to the vintage, variety, and/or geographical origin. Bibliographic datasets were attempted to provide the main information for topic comprehension, identifying the sources of wine compositional variability and how these can be expressed in terms of the belonging categories. Since all the environmental and technological conditions which vineyard and wine are subjected are rarely known, different sources were inspected. Great importance was given to the study of isotopic composition because of its importance in food frauds detection history. The interaction of the plant genotype with the environmental conditions of the vintage is the main responsible for the wines organic and inorganic fraction variability in terms of both total and relative content. This phenotypical expression, together with human and abiotic variability sources, has been examined since it contains to some extent theinformation for the discrimination of wines according to their category. Recently, new proton nuclear magnetic resonance (1H NMR)
spectroscopy techniques have been under study and, used concurrently to chemometric data management procedures, showed to be an interesting and promising tool for wine characterization according to both vintage and variety.
RESUMO
Este trabalho de revisão bibliográfica tem por objectivo a identificação e discussão de características físico-químicas do vinho que permitam o estabelecimento de uma relação com o ano de vindima, casta e/ou origem geográfica. Apresenta-se a informação necessária para a compreensão do tema, com destaque para a inspecção das diferentes fontes de variabilidade composicional do vinho e de que modo estas podem ser expressas em termos de categorias de classificação. É dada especial atenção ao estudo da composição isotópica devido à sua importância no que respeita à detecção de fraudes em alimentos. A interacção do genótipo da planta com as condições ambientais do ciclo de produção é a principal responsável pela variabilidade da composição orgânica e inorgânica, em termos de concentração total e relativa. Recentemente, novas técnicas de espectroscopia de ressonância magnética nuclear de protões (1H NMR) têm sido estudadas e, usadas concomitantemente aos procedimentos de
gestão de dados quimiométricos, demonstrando ser uma ferramenta interessante e promissora para a caracterização do vinho de acordo com o ano de vindima e casta.
Key words: Wine, authenticity, isotopes, NMR, biotic/abiotic fractionation.
Palavras-chave: Vinho, autenticidade, isótopos, RMN, fracionamento biótico/abiótico.
INTRODUCTION
Over the last decades, there has been an increase in attention to the quality and composition of food products; this includes the assessment of alimentary characteristics, such as nutritional parameters, shelf life and healthiness. Together with the public interest,
the producers themselves start to understand the economic benefits linked the authenticity of some specific products, but the increasing in number of economically motivated adulterations (EMA), also known as food frauds, can have strong impacts on human health and/or on the specific markets (Everstine et al., 2013). According to the United
134 States Food and Drug Administration (FDA) an aliment can be defined as adulterated when "any
valuable constituent has been in whole or in part omitted (…) or if any substance has been substituted wholly or in part (…) or if any substance has been added thereto (…) so as to increase its bulk or weight, or reduce its quality or strength, or make it appear better or greater value than it is" (U.S. Food
and Drugs Administration, 2010). To increase the traceability and to grant the particular food and beverage characteristics, the single Countries of the European Union developed restrictions and regulations per each specific sector through Protected Designation of Origin (PDO): e.g. Denominação de
Origem Controlada (DOC) in Portugal,
Denominazione di Origine Controllata and Denominazione di Origine Controllata e Garantita (DOC and DOCG) in Italy, Appellation d'Origine Controllée (AOC) in France and Switzerland, and Denominación de Origen (DO) in Spain (Meloni and Swinnen, 2013).
The interest in authenticity assessment as a research field has increased over the last 25 years, and wine takes second place in terms of number of publications, beaten only by grouped cereals, fruit and vegetables (Danezis et al., 2016). The high added value of some wine Designations of Origin induces the undesirable effect of making the use of not-certified grapes and wines economically interesting, to mislead consumers, marketing products under fake mentions. It is not rare to read about this type of fraudulent actions: for instance, during 2009 about 2 million litres of high quality level wine (Brunello di Montalcino DOCG) have been downgraded in Tuscany (IT) due to blending with non-authorized grapes (Asimov, 2009). A similar case was found in France, where a producer was discovered relabelling imported wines under the Bordeaux “Appellation” (Paris, 2002). Even if these types of frauds do not directly affect human health, the negative impact of single cases on consumer perception could cause huge economic repercussions on the producing territories (Holmberg, 2010). Together with mislabelling, the main fraud case involve chaptalisation, or the addition of exogenous sugar with the intent of increasing the alcoholic potential of wines, and the dilution with water to both decrease the alcoholic potential and increase the production. The last two fraud examples are better defined by law as adulterations.
To give an idea about the number of fraudulent wines on market, in 2002 the Landesuntersuchungsamt (LUA) started an investigation on more than 6000 Germans and non-German wine labels. The investigation continued until 2008 and around 4% of
wines were found to contain illegally added water or other substances, or to be produced starting from not-authorized grapes (Holmberg, 2010). The need for well-developed and discussed analytical procedures to detect such adulterations and consumer frauds is obvious and essential to maintain or even increase purchaser confidence in PDO. In the following section, an introduction on fraud detection through the isotopic ratio analysis is given, both to chronologically follow the research, and because of the current interest in this topic. After that, the main wine variability in terms of chemical composition will be briefly treated in order to find possible information linkable to grape variety, geographical origin and/or vintage. These are to some extent coded into analytical patterns which can be extracted through the application of spectral analysis: the most recent developments in 1H NMR spectroscopy (Godelmann et al., 2013; Godelmann et al., 2016) are example on how increasing the investigation of this analytical tool is of extreme interest.
EVALUATING WINE AUTHENTICITY: HOW TO STUDY ISOTOPIC PROFILING HELPS FRAUD AND MISLABELLING DETECTION In the 1982 the physical organic chemistry laboratory of the Nantes Science Faculty started developing an analytical protocol to determine the origin of natural alcohols by the relative deuterium (D) content (Martin et al., 1982); eight years later, it became the first official method to be adopted by the European Commission (EC) (Christoph et al., 2015). The hydrogen (H), oxygen (O) and carbon (C) isotope fractionation processes have been under studies for years: the goal is to find a reasonable pattern to recognize wine provenance in terms of geographical origin, vintage, variety and adopted technologies. The
determination of the deuterium relative
intermolecular isotope concentration is called site-specific natural isotopic fractionation-nuclear magnetic resonance (SNIF-NMR) analysis and it represents only one example of the stable isotope ratio analysis (SIRA). In fact, more recently the strontium (Sr) isotopic ratio has been taken into consideration as a suitable marker in wine geographical origin characterization (Martins et al., 2014; Kaya et al., 2017). Nowadays, also due to innovation in instrumental and analytical strategies, new approaches are under study such as the rare-earth elements (REE) profile (Catarino et al., 2011; Catarino et al., 2018) and the 1H NMR spectroscopy (Godelmann et al., 2013; Godelmann et al., 2016). The isotopic ratio
The ones shown in Table I are standard IUPAC reference values (Meija et al., 2016); the indicated
135 NA % = Xj A ∑n AXj j=1 ∙100 Eq. 1 R = X m X n δ (‰) =RSample- RStandard RStandard ∙1000 = RSample RStandard - 1 ∙1000 Eq. 2
ranges derive from several investigation of different types of samples, from food to inorganic matter. A standard value called Natural Abundance (Equation 1) (NA) is defined, which represents the relationship between environmental concentration of the given isotope in relation to its total abundance (Schmidt, 2003).
When classifying the isotopic content of specific samples, it is used to describe the relative deviation (δ) from international standard (Equation 2) (Christoph et al., 2015) through the relation (Schmidt, 2003):
in which m is the mass number of the heaviest isotope and n is the mass of another isotope of the X element, respectively, considered in nature or into a sample under analysis.
Since these numbers result generally very small (e.g. the deuterium RStandard is equal to 1.5576 10-4), it is preferable to work with δD standard values which, as will be seen, must be defined for each type of sample. Both δD and δ18O are evaluated in terms of deviation from the Vienna Standard Mean Ocean Water (VSMOW) values (Craig, 1961; Christoph et al., 2015).
Table I
Isotopes of interest for wine traceability and authenticity assessment: atomic and mass number and their abundance in nature (Meija et al., 2016; Haynes et al., 2017)
Isótopos de interesse para rastreabilidade e avaliação da autenticidade do vinho: número atómico, número de massa e abundância na natureza (Meija et al., 2016; Haynes et al., 2017)
Isotope Atomic Number (Z) Mass Number (A) Range of Natural Variation (%) Representative Isotope Composition (%)
1H 1 1 [99.972, 99.999] 99.9885 2H 1 2 [0.001, 0.028] 0.0115 10B 5 10 [18.9, 20.4] 19.82 11B 5 11 [79.6, 81.1] 80.18 12C 6 12 [98.84, 99.04] 98.93 13C 6 13 [0.96, 1.16] 1.07 16O 8 16 [99.738, 99.776] 99.757 18O 8 18 [0.187, 0.222] 0.205 86Sr 38 86 [9.75, 9.99] 9.86 87Sr 38 87 [6.94, 7.14] 7.00 204Pb 82 204 [1.04, 1.65] 1.04 206Pb 82 206 [20.84, 27.48] 24.1 207Pb 82 207 [17.62, 23.65] 22.1 208Pb 82 208 [51.28, 56.21] 52.4
Stable isotope fractionation process
The main isotopic abundance ratios considered, or still in course of study, in the anti-fraud field are 2H/1H (also referred to as D/H), 13C/12C, 18O/16O and 87Sr/86Sr. If these values were constant over the entire Earth's surface, and/or within each type of matrix analysed, it would not be possible to use them as discriminating factors in attempts to distinguish
between different samples. Luckily, in nature processes called stable isotope fractionation exist, which cause alteration in the distribution of isotopes both within the biomolecules and vegetable water (Christoph et al., 2015). It is possible to distinguish between two main sources of isotopic fractionation: biotic and abiotic. Analysing these phenomena in detail, it is possible to understand the sources of
136 Δ D H⁄ WQS= D H⁄ W Q - D H⁄ W S Eq. 3
variability that can affect samples relating to specific categorical variables (e.g. geographical origin).
Abiotic fractionation
The evapotranspiration activity is capable itself of altering the isotopic distribution (D/H and 18O/16O) in vegetal water samples with respect to the values found in the soil (Dunbar, 1982); this has a direct effect on the content of the same isotopes within the juices, deriving from fruit and consequently in their fermented products (e.g. wine). The leaves accumulation of the 18O isotope has been correlated to the combined effect of the increase in relative humidity and air temperature (Dongmann et al., 1974); the greater volatility of lighter and smaller atoms composing water molecules (Christoph et al., 2015) justifies the phenomenon. Consequently, disadvantageous conditions for stomatal transpiration and water evaporation cause an increase in the concentration of heavier isotopes: for instance, the higher volatility of lighter oxygen isotope leads the heavier isotope to concentrate in all water sources (Gill et al., 2007); a vintage and/or geographical origin effect follows, as can be studied through the difference between samples in δ (Equation 2) values (Bréas et al., 1994). The D/H and 18O/16O ratios in water rainfall are not always the same; they vary according to (Craig, 1961; Christoph et al., 2015): Latitude and altitude - lower presence in heavier
isotopes are shown at higher latitude due to greater precipitation rate;
Continental effect - a decrease in the presence of heavy isotopes is shown to the extent that it moves away from cost areas;
Temperature - induces a concentration effect due to greater volatility of lighter isotopes.
Therefore, both the D/H and 18O/16O ratios code themselves information about sample geographical origin (Craig, 1961). In any case, it is important to pay attention to meteorological data in order to justify anomalies in the isotopic ratios of musts and wines: in case of rainfall during the last grape maturation phase, an important dilution effect on deuterium concentration was reported by Dunbar (1982).
Biotic fractionation
The isotopic concentration within plant products (e.g. wine) is not predetermined solely by their natural distribution, and therefore by abiotic fractionation, but also depends on interaction between plant and environment. Biotic fractionation refers to the physiological processes, including biosynthetic pathways, that cause an alteration of isotopic abundance within plant tissues and/or between plant
and environment. According to Schmidt (2003), the redistribution processes are regulated by thermodynamic or enzymatic kinetics laws, which in turn represent the genotypic and phenotypic expression of plants (interaction between plant and environment). Therefore, pH, temperature and metal ions concentration affect the fractionation intensity (O’Leary, 1978). In general, during the photosynthetic pathway plants discriminate in favour of lighter isotopes (Bender, 1971) even if C3 and C4 plants show different behaviour in this sense (Martin
et al., 1991). The main difference in these two vegetal
classes lies in the carbon dioxide fixation, and leads to different biotic fractionation intensity. The greater efficiency of the C4 pathway decreases the 13C/12C ratio in favour of higher 13C concentration and, therefore, it is possible to distinguish the sugar origin, in terms of plant type (Martin et al., 1991). In addition, it has been observed a discrimination factor in the carbon dioxide diffusion into liquid phase (Farquhar et al., 1982), which varies in turn by the different plant reactions (stomatal conductance) under water stress condition (Tramontini et al., 2013). Other biological fractionation effects on carbon isotopic ratio were discussed by Tcherkez et al. (2011). Regarding the D/H and 18O/16O values, no interesting biological fractionation have been reported at vegetal tissues level; the heavy isotope concentration is therefore related, as previously discussed, mainly to the evapotranspiration requirement and to the distribution in environmental water.
Finally, the variation of the isotope distribution can be studied as a global phenomenon (infra-molecular natural fractionation) or localized (site specific natural isotopic fractionation) (Christoph et al., 2015); the possibility of localizing within the biosynthetic and/or catalytic pathway the elements origin, more precisely the hydrogen isotopes that constitute specific ethanol chemical groups, led to the development of the first analytical method recognized by the European Union for must chaptalisation identification during legal disputes (Martin et al., 1983).
Isotopes as chemical markers for wine fraud assessment
The fermentation process does not seem to significantly affect the D/H and 18O/16O ratios in pre- and post-fermentation samples. Equation 3 quantifies the changes in water hydrogen isotopic ratio.
where (D/H) S
W and (D/H) QW are the water deuterium
137 respectively; (D/H)QSW value was find to be directly
correlated, through a first degree relation, with the must starting fermentable sugar content (Martin et al., 1991). On the contrary, the oxygen isotopes concentration does not seems to be directly affected by the yeasts activity during the fermentation. As aforementioned, an analytical procedure was developed for specific site isotopic analysis which allows discriminating solutions depending on the glucides plant origin (C3 vs C4 plants). The technology is called SNIF-NMR (2H NMR) and, in some cases, its application on wine samples has made possible the identification of fraudulent chaptalisation. The discrimination is made according to the (D/H)I value (Table II), that is the site specific natural isotopic fractionation on the ethanol methyl group. Since the concentration of deuterium in wine
samples is strongly influenced both by the area of origin and by the rainfall rate and timing (Craig, 1961; Dunbar, 1982), not all the results were clearly justifiable; in case of controversies, it is possible to implement the method investigating also the δ13C value. The 18O/16O ratio analysis in wine water (Dunbar, 1982) showed a direct correlation with the 18O natural abundance. Since almost all the vine and wine oxygen derives from the natural water, absorbed through vine roots during productive cycle (Schmidt, 2003), the information carried by this atom could code for geographical origin and vintage (Bréas et al., 1994). There would seem to be no coded information by the isotopic carbon ratio (Bréas et al., 1994) since, even if used in archaeological studies to organic matter dating, the readings range of error is between 50 and 100 years (Diamond, 2005; Gill et al., 2007).
Table III
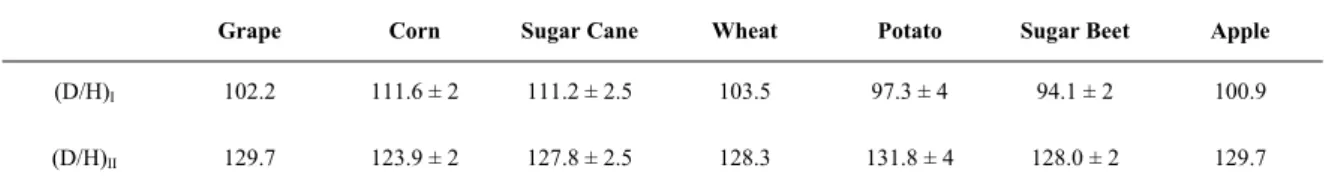
Isotopic ratio (D/H) in samples of ethanol obtained from the fermentation of various substrates (Martin et al., 1982). Razão isotópica (D/H) em amostras de etanol resultantes da fermentação de vários substratos (Martin et al., 1982)
Grape Corn Sugar Cane Wheat Potato Sugar Beet Apple
(D/H)I 102.2 111.6 ± 2 111.2 ± 2.5 103.5 97.3 ± 4 94.1 ± 2 100.9
(D/H)II 129.7 123.9 ± 2 127.8 ± 2.5 128.3 131.8 ± 4 128.0 ± 2 129.7
(D/H)I and (D/H)II identify the hydrogen isotopic ratios on the ethanol methyl and methylene groups, respectively. Values for grapes have
been extrapolated from “Compendium of international methods of wine and must analysis” (O.I.V. 2019b). Not all the standard deviation data were available.
More recent studies have demonstrated the possibility to geolocate wine samples depending on their strontium isotopic abundance and strontium isotopic ratio (87Sr/86Sr); the naturally occurring isotopes of this element are four and their abundance is reported in Table I. The discrimination is possible due to fractionation phenomenon absence during radical absorption, xylem translocation and plant metabolism (Petrini et al., 2015). This, together with the fact that fractionation does not occur during strontium dissolution from the soil’s mother rock (English et al., 2001), means that isotopic distribution within plant tissues it is not only representative of that diluted into the circulating solution (Petrini et al., 2015), but can be directly associated with the soil composition which it comes from (English et al., 2001). According to the same authors, the soil strontium composition does not depend solely on mother rock content but also on the rubidium (Rb) concentration at its formation; in addition, in some areas, the atmospheric sand can give a contribution even four times greater in comparison to the last mentioned two. Therefore, the
RStandard (Equation 2) must be continuously maintained up to date depending on local weather. What does the 87Sr/86Sr relationship depend on and why is it a good indicator of geographical origin? The formation of strontium 87 isotope is a radioactive decay consequence of another element: rubidium. The speed at which occurs depends solely on the half-life of 87Rb and consequently, both 87Rb/87Sr and 87Sr/86Sr values are proportional to the age of the rocks (Faure and Powell, 1972).
Some noteworthy developments showed how the strontium isotopic ratio to be a reliable tool for the traceability of Portuguese DO wines, where soils were developed on different geological formations (Martins et al., 2014). Since strontium is also able to replace calcium (Ca) during igneous rocks formation while Rb replaces potassium (K) in the silicate rocks (such as mica rock and potassium feldspar) formation (Faure and Powell, 1972), observing the distribution of such elements, together with the 87Rb/87Sr and 87Sr/86Sr ratios, could increase the chances of
138 predicting the geographical origin of a wine sample. The National R&D Institute for Cryogenics and Isotopic Technologies (ICSI) in Vilcea (RO) (Geană
et al., 2017) has managed to classify, with 100% of
success, the geographical origin of 21 red wines with denomination of origin (PDO) or geographical indication (GI). The developed method combines the Sr isotopic ratio together with Ca/Rb value and other element concentration (aluminium, gallium, strontium). More recently, the lead (Pb) isotopic ratios, namely 204Pb/206Pb, 208Pb/206Pb and 207Pb/206Pb, demonstrated their utility in wine sample discrimination according to geographical origin in Romania (Bora et al., 2018). It must be stated that the isotopic composition in wine could be in some extent modified due to atmospheric lead released as a consequence of the use of leaded-gasoline (Medina et
al., 2010); the heavy metal contamination problem is
decreasing after the removal of this fuel type from the market, but the possibility of observing and increase due to contact with old equipment during the vinification still persists. Anyway, further investigation regarding the technological treatment effect on metals isotopic ratio has been carried out (Kaya et al., 2017; Moreira et al., 2017) confirming what was discovered before by Martins et al. (2014): depending on the vine-growing country, the strontium isotopic ratio can be used to geographically discriminate the wine producing area.
Finally, the research has demonstrated how inspecting the information coded in boron isotopic ratio (11B/10B) for wine geographical origin permits its discrimination, whether it is produced in different countries (Coetzee and Vanhaecke, 2005) or within the same borders (Vorster et al., 2010).
Uncertainty sources
As highlighted in the previous paragraphs, each isotopic ratio encodes one or more categorical variables; this means that variations in their values are to some extent a function of:
Genotype or varietal phenotypic expression; Vintage;
Geographical origin.
However, it is not possible to limit the observations to these parameters as they can be altered by unpredictable external factors; for example their variation during bottle ageing or as a consequence of direct contact with polluting material during processing, must still be evaluated. What would happen during a dry year to the 18O/16O values in case of irrigation? As for the ratio 87Sr/86Sr, there may exist producing areas with common geological origin.
A solution comes from the possibility of inspecting multiple markers (Vorster et al., 2010): the capability of isotopic ratio to discriminate variety and vintage has been proven by Dinca et al. (2015) but, more information about weather trends is needed to discuss relations between sample discrimination and the date of rainfall events. If the goal is to combat mislabelling, it is necessary to increase the amount of information linkable to the categories listed above (Ogrinc et al., 2001). Many official analytical techniques to investigate the wine chemical composition are available (OIV, 2019a,b) but, since it is unthinkable to develop a model that includes them all, it is necessary to inspect the applicability of advanced spectroscopic analytical techniques, such as 1H NMR, ultraviolet (UV), visible (Vis), near infrared (NIR), medium infrared (MIR) and/or Raman. Through the information amount increase, it would be possible to create a chemical fingerprint which, as it works for humans, would univocally code each wine. As shown by Geană et al. (2017), it is essential to determine where this information is coded to create models and, because of that, the combination of chemometrics, bioinformatic and geographical information system (GIS) data, is essential to integrate and translate analytical data (Danezis et al., 2016).
WINE COMPOSITION AS AN INFORMATION SOURCE FOR ITS TRACEABILITY
This section aims to provide a general overview of the wine chemical species of interest to underline possible sources of varietal, geographical origin and vintage information. The main division lies between inorganic and organic compounds.
Mineral elements
The main inorganic compound for concentration in wine is water which, as previously discussed, can
convey interesting information regarding
geographical origin and vintage if studied in terms of its isotopic ratios.
The interest in wine geographical origin assessment through the analysis of mineral elements is one of the main topics regarding foodstuff mislabelling: Geană
et al. (2017) provided interesting observations about
wine samples differentiation based on their elemental composition. In these terms, significant differences were found in the concentration of Ca, gallium (Ga), Sr, aluminium (Al) and in the Ca/Sr ratio according to different production areas; it means that these elements are to some extent predictive of wine geographical origin or, their variation could partially code for that. However, the possibility of observing changes in Ca, Al and Ga profile between must and
139 wine should be considered; during the vinification process, these elements are subject to fluctuations, the intensity of which is often unpredictable. The Ca concentration varies as a consequence of calcium tartrate insolubility and consequently, precipitation can occur during both vinification and wine storage; the other two are part of a larger group of contaminant elements, the concentration of which is strongly affected by sulfur dioxide addition and/or by oenological practices such as bentonite fining and filtration (Catarino et al., 2008a,b; Redan et al., 2019).
The absorption rate of different rootstocks still remains to be studied with respect to the individual elements, depending on the pluviometric trend and their assimilability. In addition, some technological treatment, as destemming (Cheng and Liang, 2012), could change the must/wine mineral composition; this has also been demonstrated after a 90 days ageing with staves trial (Kaya et al., 2017) for Sr, manganese (Mg), nickel (Ni), cobalt (Co) and vanadium (V) concentrations.
Before assessing the wine geographical origin through the realization of a multi-elemental
fingerprint the technological treatment effect on these latter should be considered: in fact, it is not possible in all the cases to assume the direct correlation between soil mineral composition and wine elemental profile (Catarino et al., 2008b). In addition, different behaviour in rootstocks capability to absorb water and minerals has been explained (Marguerit et al., 2012) to be to some extent, genetically controlled; this creates another variability source during wine sample classification and a varietal per vintage per rootstock interaction effect.
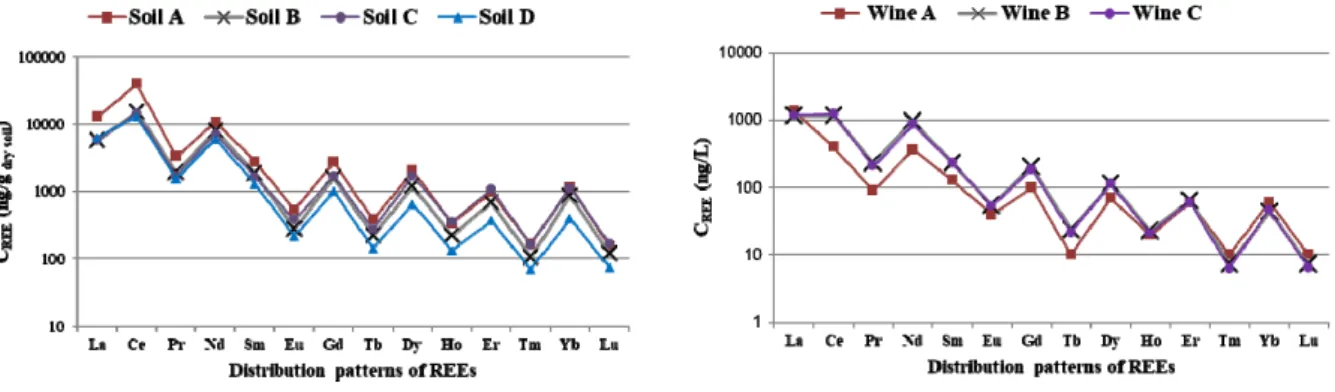
Despite these concerns, studies developed by Catarino et al. (2011, 2018) demonstrated that rare-earth elements (REE) should be considered. Indeed, their chemical similarity and the absence in biotic and abiotic fractionation processes both during rootstock absorption and vinification make these elements interesting targets in wine geographical characterization. The soil/must/wine system change mainly affects the REE total content, as it is clear in Figure 1, where their concentration pattern seems in most cases to follow the soil one.
Figure 1. Chondrite normalised REE concentration (CREE) in soil (ng/gdry soil) and corresponding wines (ng/L) (Catarino et al., 2011). Wine and
related soils of origin are indicated using the same colours: wine A and wine B share the same pattern and “Denominação de Origem” (Óbidos D.O.P.). Soils A (Dão region) and B (Palmela region) show different composition patterns; wine A differs from wines B and C in the lighter REE
concentrations.
Concentração de REE (CREE,) normalizada à condrite, no solo (ng/gsolo seco) e nos vinhos (ng/L) correspondentes (Catarino et al., 2011). O vinho e
os solos de origem relacionados são indicados usando as mesmas cores: o vinho A e o vinho B apresentam o mesmo padrão e a Denominação de Origem (Óbidos D.O.P.). Os solos A (região do Dão) e B (região de Palmela) apresentam diferentes padrões de composição; o vinho A difere dos
vinhos B e C nas concentrações de REE mais leves.
It is interesting to emphasize the similarity between both the B and C patterns, whether soil or wine samples are considered, because these two productions arise from the same region (Óbidos). Though in this case the soil-wine composition
correlation in terms of rare-earth elements is around 0.9, it must be stressed that must and wine fining agents, as bentonite and other silica derivates, greatly influence on REE profiles (Rossano et al., 2007). These adjuvants are largely used to prevent protein
140 casse in white wines and therefore, for now the applicability of this elemental fingerprinting should be limited on red wines.
Organic compounds
The main classes of wine organic molecules are organic acids, nitrogen compounds (amino acids, peptides and proteins), polyphenols, lipids, carbohydrates and aroma compounds (terpenes, norisoprenoids, thiols and esters). Many are the external and genetic influences on their concentration, absolute and/or relative; therefore, knowing the sources of this variability is essential to use them as chemical fingerprints (Danezis et al., 2016).
Flavonoids
The term flavonoid includes different phenolic categories, including flavan-3-ols, flavonols and anthocyanidin-3-o-glucosides. They can be found in the berry, mainly concentrated in the skin layers, and their variation mainly results from the genome-environment interaction. Expression changes of the biosynthetic pathway have been reported by Castellarin et al. (2007): following water stress situations, an increase in expression of genes which encode for enzymes asserting to the anthocyanin pathway is shown; according to the same author, as a result of a greater exposure of the berries to sunlight, an increase in the synthesis rate of flavonols, as biomolecules produced to protect from excessive UV irradiation, has been proven. The same direct radiation alters the anthocyanin profile (relative concentrations) which, although strongly dependent on variety (Jin et al., 2009), seems to be subject to changes during limiting environmental conditions. Flavonoids content in wine also depends on the technological treatment during grape processing, just think to the “blanc de noir” vinification, or the different maceration technologies (Sacchi et al., 2005) for white and red wines.
The term anthocyanins refers to a class of pigments found in many plant species within flowers, leaves and fruits. Their colours vary, depending on oxidation level and the pH of the medium within which they are dissolved, from red to blue (Ribéreau-Gayon et al., 2006a). The anthocyanins absolute and relative content in grapes depends mainly on cultivar (Bautista-Ortín et al., 2016), training system, maturity, and vintage (Canals et al., 2005).
Flavan-3-ols are another class of compounds present in grapes and wine; these are organized into polymeric structures of concatenated sub-units, called proanthocyanidins (PAC), the average degree of polymerization (mDP) of which in berry skin cells
varies as a result of environmental trends and vineyard management (Ribéreau-Gayon et al., 2006a). Flavanol polymerization with other molecules, including anthocyanins, gives rise to a large number of compounds, and the so occurring reaction products are mainly studied according to their size and colouring characteristics (Ribéreau-Gayon et al., 2006a). In addition, from the polymerization between anthocyanins and carbonyl (e.g. ethanal, pyruvic acid) molecules, which
originates mainly during fermentation,
pyranoanthocyanins arise (Romano et al., 1994). The possibility to technologically manage the flavonoid composition, in terms of concentration and mDP, has been largely discussed and represents one of the main wine research topics (Canals et al., 2005; Bosso et al., 2009; Lerno et al., 2015; Smith et al., 2015). From the previous statements it is possible to gather useful information for sample characterisation according to variety, geographical origin and vintage: all these chemical classes are subject to variations which are strictly connected to vine genotype and phenotype expression depending on environmental conditions. This, together with vinification, vineyard management and wine ageing practices, explains itself the complexity in connecting categorical information to few chemical absolute and relative concentrations (Pereira et al., 2006). However, it is still noticeable how these data convey information that encode the environmental characteristics linked to vintage and wine production area.
Non-flavonoids
Non-flavonoids are divided into three main groups: hydrolysable tannins (gallotannins and ellagitannins), phenolic acids and stilbenes. The formers are polymers of different shapes and sizes which are extracted by the contact between wine and wood; they consist in gallic and ellagic acid subunits which concentration in wine mainly depends on the type of wood and contact time (Ribéreau-Gayon et al., 2006a). Non-flavonoids can therefore be considered
as possible indicators of the
process/refinement/ageing that characterise certain denominations more than others. Phenolic acids, on the other hand, are highly concentrated within the berry. These are mainly present in the form of hydroxycinnamoyl tartaric acids (HCTA), even though during vinification they are also released through the hydrolysis of tartaric acid. Coumaric, caffeic, ferulic and gallic acids are the ones known until now; their concentration seems to be affected by varietal components but not by weather changes (Ferrandino et al., 2012; Šuklje et al., 2012). Finally, stilbenes are a very important class for the food
141 industry as they are designed and used as food additives for their high antioxidant activity. Their concentration may vary depending on the weather (vintage), altitude, but are also strongly influenced by the genetic (varietal) component (Bavaresco et al., 2007).
Organic acids
The main organic acids in wine generally come from four sources: grapes, yeasts, lactic and/or acetic bacteria physiological activity and intentionally added (Ribéreau-Gayon et al., 2006b). This discussion has little to do with the addition of exogenous acids; however, it is important to be aware about all treatments to which wine has been subject, since the use of additives can reduce the quantity of categorical coded information because of compositional changes. In terms of concentration, the most important are tartaric, malic, lactic and acetic acids; other acids can be found, whose concentration mainly depends on the fermentation intensity and management (Ribéreau-Gayon et al., 2006b). Tartaric and malic acids are synthesized during the vegetative phase of berry development and accumulate until veraison. During berry maturation, malic acid is used as a carbon source instead of glucose: depending on temperature, its concentration decreases due to cellular respiration (Pereira et al., 2006); during some vinifications, mainly the red wine ones, its transformation into lactic acid by lactic bacteria is required (Ribéreau-Gayon et al., 2006b). In addition, it is possible to achieve similar results through the use of particular yeast strains such as Schizosaccharomyces pombe (Sousa et al., 1991; Loira et al., 2018). In order to increase the malic to lactic acid conversion manageability, these two techniques can be substituted directly adding the malolactic enzyme to the wines or by the use of specific membranes as sustenance (Formisyn et al., 1997; Maicas, 2001). Nitrogen compounds
Protein and peptide concentrations in wine greatly differ comparing white to red wines, but also varietal differences are shown (Pocock et al., 2000). In fact, tanning compounds present in red wine precipitate the majority of proteins before bottling (Ribéreau-Gayon
et al., 2006c). The foncentration of the latter also
varies as a consequence of bentonite treatments (Waters et al., 2005). Pereira et al. (2006) has demonstrated the effect of different bunches exposures (microclimates) on histidine, γ-aminobutyric acid (GABA), alanine, and arginine concentrations; this proves how the environmental conditions affect amino acid wine profile. Pathogenesis related proteins (PR proteins) is an important protein class because of their technological
role in white wines instability (Ferreira et al., 2001). As regards their relative concentration, wines obtained from different geographical areas, varieties and years showed non-dissimilar compositions (Ferreira et al., 2000). In conclusion, unlike the polypeptide composition, both the profile and the amino acid concentration can be important targets for wine fingerprinting.
NEW APPROACHES TO RECOGNISE
COMPOSITIONAL PATTERNS:
METABOLOMICS AND CHEMOMETRICS Metabolomic is the study of the chemical fingerprinting arising by the cellular activity of specific living organisms, such as yeasts or plants. It groups sets of quantitative and qualitative analysis which allow inspecting the composition, in this case, of musts and wines. Through spectroscopic analysis associated with specific chemometrics tools, it is possible to identify patterns statistically correlated to specific samples. Consequently, comparing several wine spectra, it allows exploring the main variability sources, as previously shown for isotopic ratio (Danezis et al., 2016). According to Godelmann et al. (2013) "The information on latent parameters such as
grape variety, origin, and vintage is coded in multivariate patterns of multiple parameters in the NMR spectra rather coded in single spectrum markers”. It means that three categorical variables of
interest, namely variety, geographical origin and vintage, cannot be summarized by the variation of one or a few analytical parameters, but only the combination of a large number of information (multivariate patterns) is able to describe them. This phenomenon is called synergistic effect and can include isotopic data fusion (Monakhova et al., 2014). Chemometrics is a particular branch of chemistry that applies mathematical and statistical models on analytical data to help in their interpretation; this proves itself very useful especially when the quantity of information exceeds by far the number of categorical variables under investigation. For this purpose, statistical tools, as principal component analysis (PCA), have been developed to allow the elimination of part of the information that is not relevant (spurious information). It is possible to regroup such tools into three categories: exploratory analysis, classification analysis and regression analysis (Medina et al., 2019). During sample characterization in terms of geographical origin, vintage and/or variety, chemometrics tools are used to screen into analytical spectra in search of variability sources linked to these categorical variables.
It is important to distinguish between two approaches. A supervised approach is a process of organizing or
142
μ = I γ h
2π Eq. 4
describing data according to a predefined criterion; an example derives from the linear and multiple regression model: the least square criterion tries to minimize the difference between groups of variables from a regression function. On the contrary, the unsupervised approach requires data to be viewed in their entirety in search of a priori (latent) criterion capable of regrouping them into clusters; this type of approach must be associated with model validation procedures.
TARGET VS. NON-TARGET ANALYSIS Compositional analysis on wines and other food matrices can be carried out in two different ways; note that one does not exclude the other and intermediate ways are possible. Profiling and fingerprinting are the two main strategies (Fan et al., 2018). The first one refers to the application of targeted analysis or the determination of the absolute and/or relative concentration of specific chemical species. The second approach involves the application of spectroscopic strategies combined with multivariate statistical methods (chemometrics) without the need for the identification of any the compound. The second one allows investigating information that would not be taken into account through targeted analysis, making the latter a useful approach for investigations in the food sector, especially if used in association with NMR spectroscopy (Godelmann et al., 2013; Christoph et
al., 2015; Danezis et al., 2016; Fan et al., 2018). In
support of this statement, it has been shown in detail by Godelmann et al. (2013) how to increase the information during exploratory analysis makes it possible to discriminate wine samples more effectively, according to variety and/or geographical origin.
1H NMR AND WINE APPLICATIONS
One of the reasons why nuclear magnetic resonance spectroscopic technology is gaining interest is the sample preparation simplicity, which reduces possibilities of giving rise to errors, and its high analytical reproducibility (Godelmann et al., 2016). The latter is essential for analytical procedures to be implemented at legislative level (Tyagi et al., 2010). The NMR was mainly applied in the past in obtaining high-resolution structural information on a wide range of chemical species and for molecular dynamics studies (Danezis et al., 2016). More recently, the possibility to extract compositional information of water rich sample has extended its application to metabolomic analysis. Furthermore, it is possible to use NMR in association with separation techniques, as liquid chromatography (LC) or capillary electrophoresis (Košir and Kidrič, 2002), for the
identification of new chemical species present in wine or in other complex food matrix (Medina et al., 2019).
Nuclear magnetic resonance
Nucleons (neutrons and/or protons) subjectability to magnetic fields can be explained through the spin presence. Using the NMR technology it is possible to investigate the response of specific atomic nuclei within a magnetic field of known intensity following the application of specific radio frequency (RF) pulse (Farrar and Becker, 1971). The nucleons quantum state, quantifiable by the spin quantum number (I), assumes only + 1/2 and -1/2 values (Shriver et al., 2014). It is possible to quantify the response only on nuclei which possess a magnetic dipole moment μ (Equation 4).
where γ indicates the gyromagnetic ratio or the magnetic and angular moment particle ratio, I is the nuclear spin quantum number while h is the Planck constant (Farrar and Becker, 1971).
During the 1H NMR experiments, the hydrogen contained in the sample are inserted into a static magnetic field (B0) which forces the nuclear magnetic moment to precess around its direction. The frequency characterizing this reorientation it is called Larmor frequency (=-H0) and it varies proportionally to the applied magnetic field intensity itself (Farrar and Becker, 1971). When the sample is subjected to a second RF pulse oscillating at the same precession frequency and perpendicular to the direction of the static field, it acquires energy, and the precession angle increases according to the intensity (B1) of the pulse itself; this phenomenon is called resonance. 90° pulse is defined as an RF pulse the intensity of which is able to rotate the nuclear magnetic moments to the plane perpendicular to the magnetic field (Farrar and Becker, 1971). When the stimulus provided by the radio frequency pulse ceases, the nuclear spins of the hydrogen nuclei tend to return to the original state as relaxation processes occur. The free induction decay (FID) is the graphical representation in time of the transversal magnetization intensity (M1) evolution on the plane orthogonal to the external magnetic field (B0) direction; through its analysis it is possible to derive or fit two variables: T1 (longitudinal relaxation time) and T2 (transversal relaxation time), which are used to quantify the reacquisition of the initial total magnetization moment (M0) and the disappearance of the transversal one (Farrar and Becker, 1971), respectively. The reciprocal quantity of T1 and T2 are
143 δppm= νsample νTMS νTMS ∙106 Eq. 6 𝑓 𝑡 𝐴𝑛𝑐𝑜𝑠 𝑛𝜋 𝑇 𝑡 𝐵𝑛𝑠𝑖𝑛 𝑛𝜋 𝑇 𝑡 ∞ 𝑛 1 ∞ 𝑛 0 Eq. 5 defined as spin-latice relaxation rate (1/T1), and spin-spin relaxation rate (1/T2). Measuring the variation of these two parameters as a function of temperature, frequency and chemical-physical characteristics is used to create molecular interaction models. Relaxometry studies molecular motion into liquids and/or solids also through the 1/T1,2 variation measured at different magnetic fields intensities (Sebastião et al., 2011).
1H NMR in wine characterisation: two strategies
How is it possible to obtain compositional information, or spectra, about wine samples starting from T1 and T2 determination? The FID shape depends on the composition of the individual signals of transverse magnetization of each hydrogen nucleus present inside the analysed sample: each hydrogen nucleus, within the same molecule, has a single resonance frequency due to other magnetic centres proximity. Through the application of the Fourier transform (Equation 5), it is possible to describe the FID, as a sum of single sine and/or cosine functions (signals) (Farrar and Becker, 1971).
where T indicates the function period. The graphical representation of the signal intensity as a function of the resonance frequencies is the 1H NMR spectrum: in NMR spectroscopy both profiling and fingerprinting approaches are possible (Godelmann et
al., 2013).
1H NMR profiling
The targeted approach works after associating spectroscopic peaks with certain previously identified molecules. This is made possible through the addition of an internal standard, tetramethylsilane (TMS), and expressing the distance, also called chemical shift (ppm), of all other peaks from this last one (Keeler, 2002) – Equation 6.
Furthermore, the compounds can be quantified by comparing the amplitude of the curve, at a specific peak, with that of a reference compound of known concentration (Keeler, 2002). This analytical strategy in conjunction with the application of chemometrics tools allowed observing the sources of variability in samples with different geographical origins (Son et
al., 2008), variety (Aru et al., 2018) and, in some
cases, vintage (Anastasiadi et al., 2009). It is
important to stress the possibility to work either directly on wine sample or on dried samples even if in the second case some compositional modifications occur during sample pre-analytical treatment (Aru et
al., 2018).
On the other hand, there are cheaper analytical methods to attain comparable results (Danezis et al., 2016) even if both the minimum required intervention on sample preparation, with consequent reduction of analytical time requirements, and the high-throughput information remain interesting (Godelmann et al., 2016). The same author previously demonstrated how, during exploratory chemometrics tools application, the percentage of correct sample-category association benefits from increasing the information quantity (Godelmann et al., 2013).
1H NMR fingerprinting
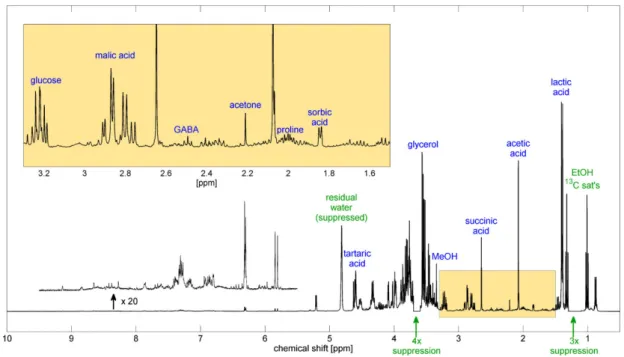
As it can be seen in Figure 2, minor peaks, to which no compositional information is associated, are present; due to the so called binning procedure, the spectrum is divided into smaller frequency intervals, to proceed calculating the area below the NMR line (Fan et al., 2018). Binning operation is a pre-analytical data treatment used to reduce the data quantity. Successively, these areas are used as variables during multivariate statistical analysis (Godelmann et al., 2013), making each spectrum as a unique fingerprint. The information amount thus extracted from each sample is much larger than that obtained with a targeted analysis approach. Therefore, some statistical issues can occur: the increase in number of variables used to classify wine samples could be cause of collinearity problems (Næs and Mevik, 2001); in addition, it is possible to incur in overfitting issues. Both problems can be solved by the application of data mining and/or PCA. Principal component analysis is the most applied statistical tool during NMR spectroscopy because, in addition to solve statistical issues, it permits to regroup sample in a non-guided clustering.
Recently, thanks to fingerprinting approach, many advances in wine classification in terms of vintage, geographical origin, variety, and applied technology have been achieved. The possibility to relate wine terroir, intended as microclimate and soil composition, has been demonstrated (Mazzei et al., 2010). Differences between wines fermented by commercial yeasts strains or autochthonous ones was also shown (Mazzei et al., 2013), indicating another source of data variability. In both projects sample differentiation was obtained, and the greatest sources of data explanation were lactic acid, glycerol, fructose, succinic acid and glucose spectral areas. In
144 varietal, vintage, and geographical origin wine characterization both non-targeted and targeted approaches were compared (Godelmann et al., 2013), showing an increasing in correct sample prediction rate in case of whole 1H NMR spectra use. A similar approach showed the possibility to statistically
regroup sample from two different vine-growing areas (Italy and Slovenia) (Brescia et al., 2003). These are just examples of 1H NMR applicability to wine; the same approach was used to determine different food matrices characteristics (Esteki et al., 2018) proving this technology’s plasticity.
Figure 2. Wine 1H NMR spectrum with some proton line assignments corresponding to underlined molecular groups. The spectrum was obtained
at 400 MHz, with suppression of eight lines, corresponding to the water and ethanol signals. The wine pH has been adjusted to 3.10. 3-(trimethylsilyl)propionic acid sodium salt (TPS) was added for standard reference. GABA term refers to γ-aminobutyric acid (Godelmann et al.,
2013).
Espectros de 1H RMN de vinho com identificação de alguns picos de ressonância associados a moléculas sublinhadas. O espectro foi obtido a
400 MHz. Foram suprimidas oito picos, correspondente a sinais de água e de etanol. O pH do vinho foi ajustado a 3,10. Ácido 3-(trimetilsilil)propiónico sal de sódio (TPS) foi adicionado como referência padrão. O termo GABA refere-se ao ácido γ-aminobutírico
(Godelmann et al., 2013).
CONCLUSIONS
Different approaches have been described in the categorical classification of wine samples giving greater importance to the information contained in the isotopic ratios and deriving from the chemometrics interpretation of the 1H NMR spectral images. In the first case it was shown how, deeply investigating the isotopic fractionation processes, it was possible to develop an official analytical method to face chaptalisation and/or water addition. In the second case the intent was to stress how the spectral information is able to code for the vintage and the geographical, varietal, technological and compositional characterisation but, due to the high
number of environmental factors which impact on fingerprint, the use of chemometrics tools in conjunction with an increase in the amount of available information is required. Some perplexity regarding the a priori samples classification through discriminant analysis (Rodionova et al., 2016) must be clarified. A solution could come from database implementation to increase both compositional and spectral available data. In conclusion, wine is a complex matrix; its composition varies as a function of environmental-genetic expression, technological practices and wine age (Cassino et al., 2019). Therefore, wine classification requires a wide range of knowledge and huge amount of available data.
145 ACKNOWLEDGEMENTS
This work was supported by the Portuguese National Funding Agency for Science and Technology LEAF (UID/AGR/04129/2020); DL 57/2016/CP1382/CT0025.
REFERENCES
Anastasiadi M., Zira A., Magiatis P., Haroutounian S., Skaltsounis A., Mikros E., 2009. 1H NMR-based metabolomics for the
classification of Greek wines according to variety, region, and vintage. Comparison with HPLC data. J. Agric. Food Chem., 57, 11067–11074.
Aru V., Sørensen K., Khakimov B., Toldam-Andersen T., Balling Engelsen S., 2018. Cool-climate red wines - chemical composition and comparison of two protocols for 1H-NMR analysis. Molecules,
23, 160.
Asimov E., 2009. Brunello inquiry cites five wineries. 12 August. The New York Times D, Dining In, Dining Out.
Bautista-Ortín A., Busse-Valverde N., Fernández-Fernández J., Gómez-Plaza E., Gil-Muñoz R., 2016. The extraction kinetics of anthocyanins and proanthocyanidins from grape to wine in three different varieties. OENO One, 50, 91-100.
Bavaresco L., Pezzutto S., Gatti M., Mattivi F., 2007. Role of the variety and some environmental factors on grape stilbenes. Vitis, 46, 57–61.
Bender M., 1971. Variations in the 13C/12C ratios of plants in
relation to the pathway of photosynthetic carbon dioxide fixation. Phytochemistry, 10, 1239–1244.
Bora, D. Donici A., Teodor R., Bunea A., Popescu D., Bunea C., 2018. Elemental profile and 207Pb/206Pb, 208Pb/206Pb, 204Pb/206Pb, 87Sr/86Sr isotope ratio as fingerprints for geographical traceability
of Romanian wines. Not. Bot. Hort. Agrobot. Cluj, 46, 223–239. Bosso A., Guaita M., Panero L., Borsa D., Follis R., 2009. Influence of two winemaking techniques on polyphenolic composition and color of wines. Am. J. Enol. Vitic., 60, 379–385. Bréas O., Reniero F., Serrini G., Martin G., Rossmann A., 1994. Isotope ratio mass spectrometry: analysis of wines from different European countries. Rapid Commun. Mass Spectrom., 8, 967–970. Brescia M., Košir I., Caldarola V., Kidrič J., Sacco A., 2003. Chemometric classification of Apulian and Slovenian wines using
1H NMR and ICP-OES together with HPICE data. J. Agric. Food
Chem., 51, 21–26.
Canals R., Llaudy M., Valls J., Canals J., Zamora F., 2005. Influence of ethanol concentration on the extraction of color and phenolic compounds from the skin and seeds of Tempranillo grapes at different stages of ripening. J. Agric. Food Chem., 53, 4019– 4025.
Cassino C., Tsolakis C., Bonello F., Gianotti V., Osella D., 2019. Wine evolution during bottle aging, studied by 1H NMR
spectroscopy and multivariate statistical analysis. Food Sci. Technol. Int., 116, 566–577.
Castellarin S., Pfeiffer A., Sivilotti P., Degan M., Peterlunger E., Di Gaspero G., 2007. Transcriptional regulation of anthocyanin biosynthesis in ripening fruits of grapevine under seasonal water deficit. Plant Cell Environ., 30, 1381–1399.
Catarino S., Curvelo-Garcia A., Sousa R., 2008a. Revisão: Elementos contaminantes nos vinhos. Ciência Tec. Vitiv., 23, 3–19.
Catarino S., Madeira M., Monteiro F., Caldeira I., Bruno de Sousa R., Curvelo-Garcia A., 2018. Mineral composition through soil-wine system of Portuguese vineyards and its potential for soil-wine traceability. Beverages, 4, 85.
Catarino S., Madeira M., Monteiro F., Rocha F., Curvelo-Garcia A., De Sousa R., 2008b. Effect of bentonite characteristics on the elemental composition of wine. J. Agric. Food Chem., 56, 158– 165.
Catarino S., Trancoso I., Madeira M., Monteiro F., Bruno de Sousa R., Curvelo-Garcia A., 2011. Rare earths data for geographical origin assignment of wine: a Portuguese case study. Bulletin de l’OIV, 84, 333–346.
Cheng J., Liang C., 2012. The variation of mineral profiles from grape juice to monovarietal Cabernet sauvignon wine in the vinification process. J. Food Process. Preserv., 36, 262–266. Christoph N., Hermann A., Wachter H., 2015. 25 years authentication of wine with stable isotope analysis in the European Union–review and outlook. BIO Web of Conferences, 5, 02020. Coetzee P., Vanhaecke F., 2005. Classifying wine according to geographical origin via quadrupole based ICP–mass spectrometry measurements of boron isotope ratios. Anal. Bioanal. Chem., 383, 977–984.
Craig H., 1961. Isotopic variations in meteoric waters. Science, 133, 1702–1703.
Danezis G., Tsagkaris A., Brusic V., Georgiou C., 2016. Food authentication: state of the art and prospects. Curr. Opin. Food Sci., 10, 22–31.
Diamond J., 2005. Collapse: How societies choose to fail or fucceed. 173 p. Penguin Books, London, UK.
Dinca O.-R., Ursu S., Costinel D., Popescu R., Miricioiu M., Radu G.-L., Popa D., Campeanu C., Elena R., 2015. Samburesti wines characterization in terms of their stable isotope content. U.P.B. Sci. Bull., 77, 176-187.
Dongmann G., Nürnberg H., Förstel H., Wagener K., 1974. On the enrichment of H218O in the leaves of transpiring plants. Rad. and
Environm. Biophys., 11, 41–52.
Dunbar J., 1982. A study of the factors affecting the 18O/16O ratio
of the water of wine. Z. Lebensm. Unters. Forsch., 174, 355–359. English N., Betancourt J., Dean J., Quade J., 2001. Strontium isotopes reveal distant sources of architectural timber in Chaco Canyon, New Mexico. Proc. Natl. Acad. Sci. USA, 98, 11891– 11896.
Esteki M., Shahsavari Z., Simal-Gandara J., 2018. Use of spectroscopic methods in combination with linear discriminant analysis for authentication of food products. Food Control, 91, 100–112.
Everstine K., Spink J., Kennedy S., 2013. Economically motivated adulteration (EMA) of food: common characteristics of EMA incidents. J. Food Prot., 76, 723–735.
Fan S., Zhong Q., Fauhl-Hassek C., Pfister M.-H., Horn B., Huang Z., 2018. Classification of Chinese wine varieties using 1H NMR
spectroscopy combined with multivariate statistical analysis. Food Control, 88, 113–122.
Farquhar G., O’Leary M., Berry J., 1982. On the relationship between carbon isotope discrimination and the intercellular carbon dioxide concentration in leaves. Funct. Plant Biol., 9, 121–137. Farrar T., Becker E., 1971. Basic concepts in NMR. In: Pulse and Fourier transform NMR: Introduction to theory and methods, 1-8. Academic Press, New York, NY, USA.